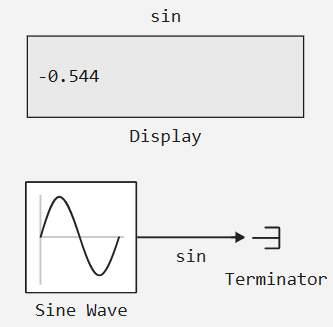
Display
Displays the current value of the selected signal during the simulation.
blockType: Display
|
Path in the library: |

Description
Block Display designed to display on the canvas the current value of the selected signal during the simulation. The unit can display scalar, vector and matrix signals. Bus mapping is not supported. The unit can display real and complex signals.
After adding to the canvas, the block displays the inscription: Signal not connected. After adding a signal, its value will be displayed on the block. How to add a signal to the display, see the article Virtual devices.
In the block menu, you can configure:
-
format of data representation in the parameter Presentation Format:
short(by default)|long|short_e|long_e; -
alignment for the output data in the parameter Alignment:
left(by default) |center|right; -
the label for the selected signal in the parameter Mark:
hide(by default) |bottom|top; -
a grid for non-scalar signals in the parameter Display grid for non-scalar signals: this check box is unchecked by default;
-
colors for the layout in the parameter group Colors:
Text|Background|Grid.
For more information about using Dashboard blocks, see Virtual devices