传说
|
该页面正在翻译中。 |
从元素创建图例
您可以通过传递图例条目向量和标签向量以及可选标题作为第三个参数来创建基本图例。
图例条目向量中的元素可以是plot对象,也可以是Lineelement、MarkerElement和PolyElement等Legendelement。 或者它们可以是将作为一个分层在一起的此类对象的向量。
图例元素属性
标准绘图对象如 散点,散点 或 线条 有预定义的转换到 标记,标记s和 行距;行距将相关情节属性复制到图例元素的s。 如果属性具有类似矢量的值,则会回退到图例的标量默认值。 默认情况下,图例默认值本身是从主主题继承的。 例如, 扩音器,扩音器 传说又回到了 贴片宽度 的主旋律。 在下面的示例中,您可以看到 sca2 复制 :rect 标记但不是矢量值颜色。
</无翻译>
using CairoMakie

f = Figure()

Axis(f[1, 1])

xs = 0:0.5:10
ys = sin.(xs)
lin = lines!(xs, ys, color = :blue)
sca = scatter!(xs, ys, color = :red)
sca2 = scatter!(xs, ys .+ 0.5, color = 1:length(xs), marker = :rect)

Legend(f[1, 2],
    [lin, sca, [lin, sca], sca2],
    ["a line", "some dots", "both together", "rect markers"])

f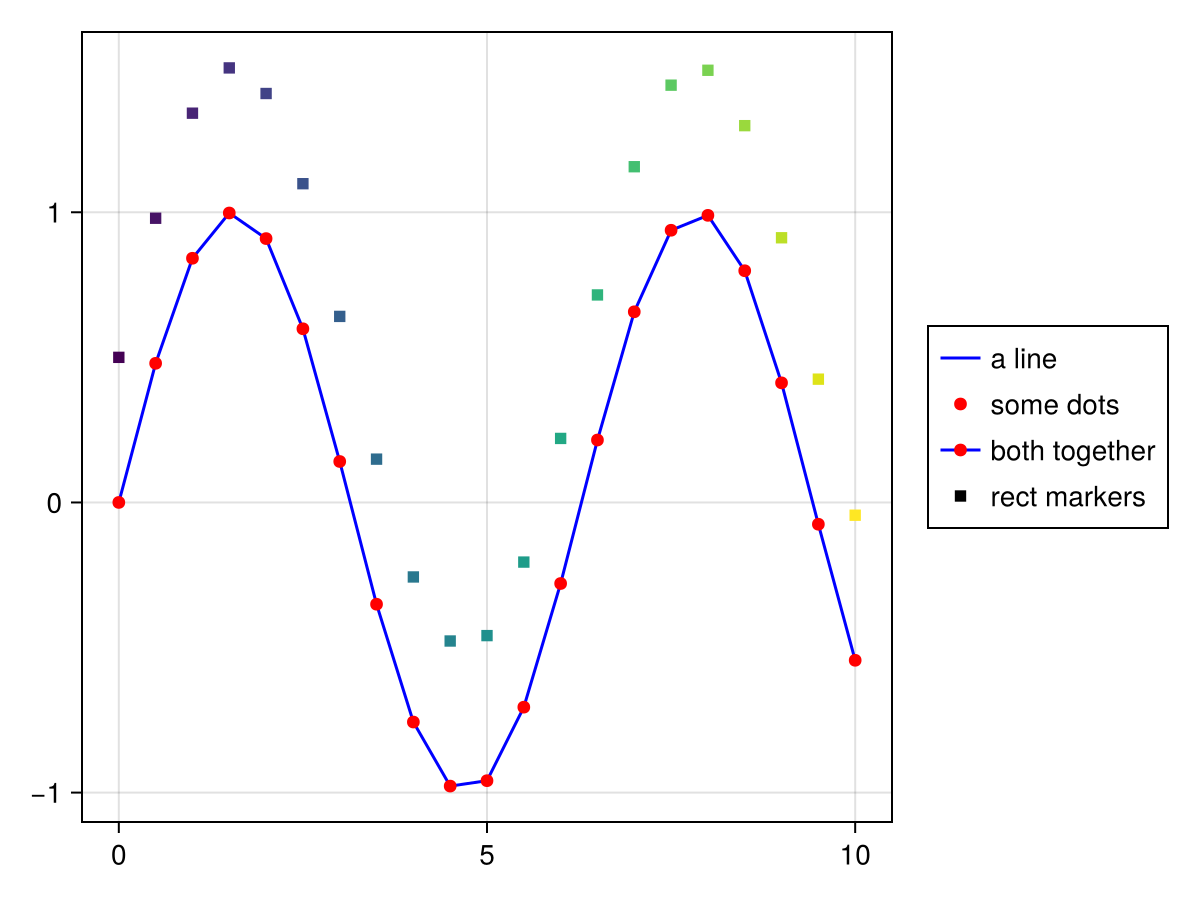
从轴创建图例
您也可以通过传递一个轴对象来创建一个图例,如 轴心,轴心, LScene,LScene 或 场景. 所有有 标签 属性集将按照它们在轴中出现的顺序放入图例中,并且您可以选择将标题作为第三个参数传递。
</无翻译>
using CairoMakie

f = Figure()

ax = f[1, 1] = Axis(f)

lines!(0..15, sin, label = "sin", color = :blue)
lines!(0..15, cos, label = "cos", color = :red)
lines!(0..15, x -> -cos(x), label = "-cos", color = :green)

f[1, 2] = Legend(f, ax, "Trig Functions", framevisible = false)

f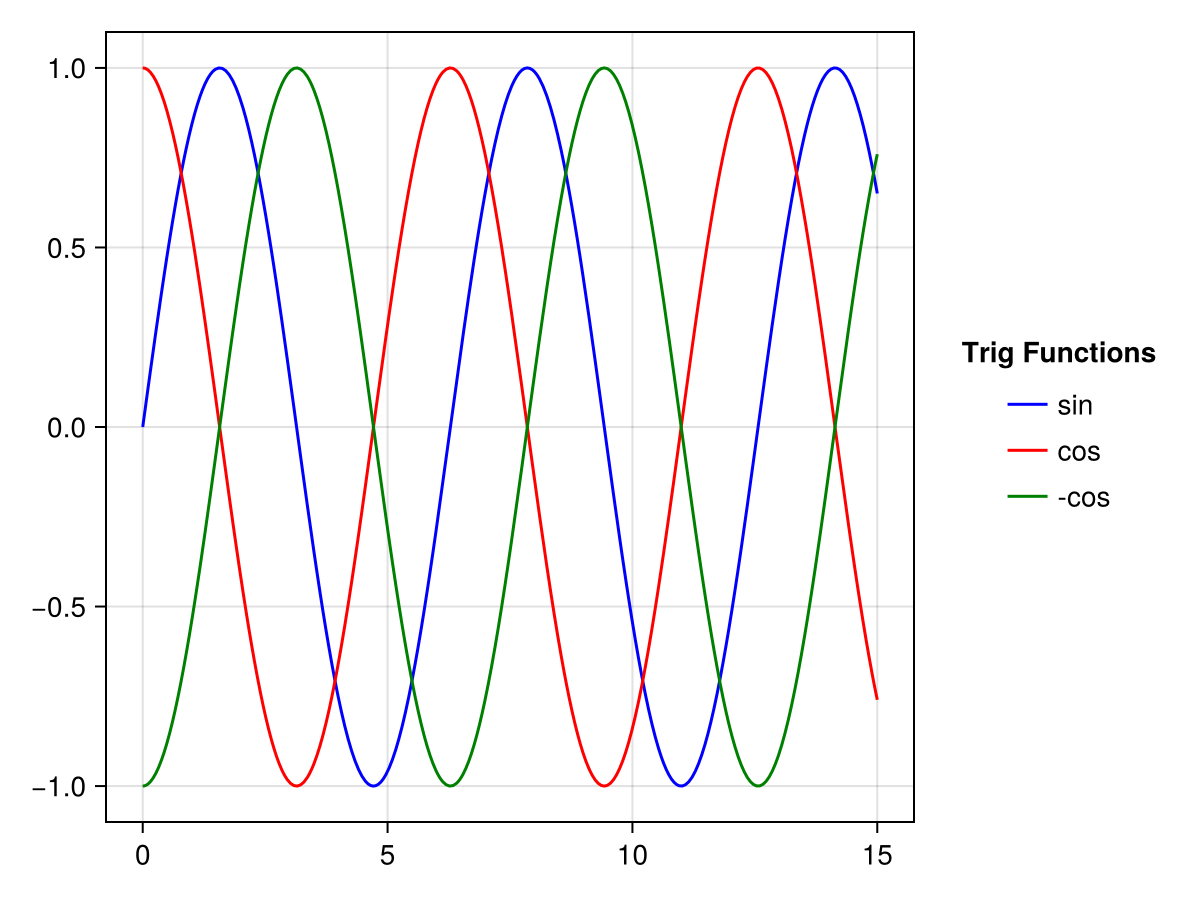
与关键字 合并;合并 和 独特的 您可以控制如何处理具有相同标签的绘图对象。 如果 合并;合并 是 真的,所有具有相同标签的绘图对象将被分层到一个图例条目中。 如果 独特的 是 真的,具有相同情节类型和标签的所有情节对象将减少到一次出现。
</无翻译>
using CairoMakie

f = Figure()

traces = cumsum(randn(10, 5), dims = 1)

for (i, (merge, unique)) in enumerate(
        Iterators.product([false, true], [false true]))

    axis = Axis(f[fldmod1(i, 2)...],
        title = "merge = $merge, unique = $unique")

    for trace in eachcol(traces)
        lines!(trace, label = "single", color = (:black, 0.2))
    end

    mu = vec(sum(traces, dims = 2) ./ 5)
    lines!(mu, label = "mean")
    scatter!(mu, label = "mean")

    axislegend(axis, merge = merge, unique = unique)

结束

f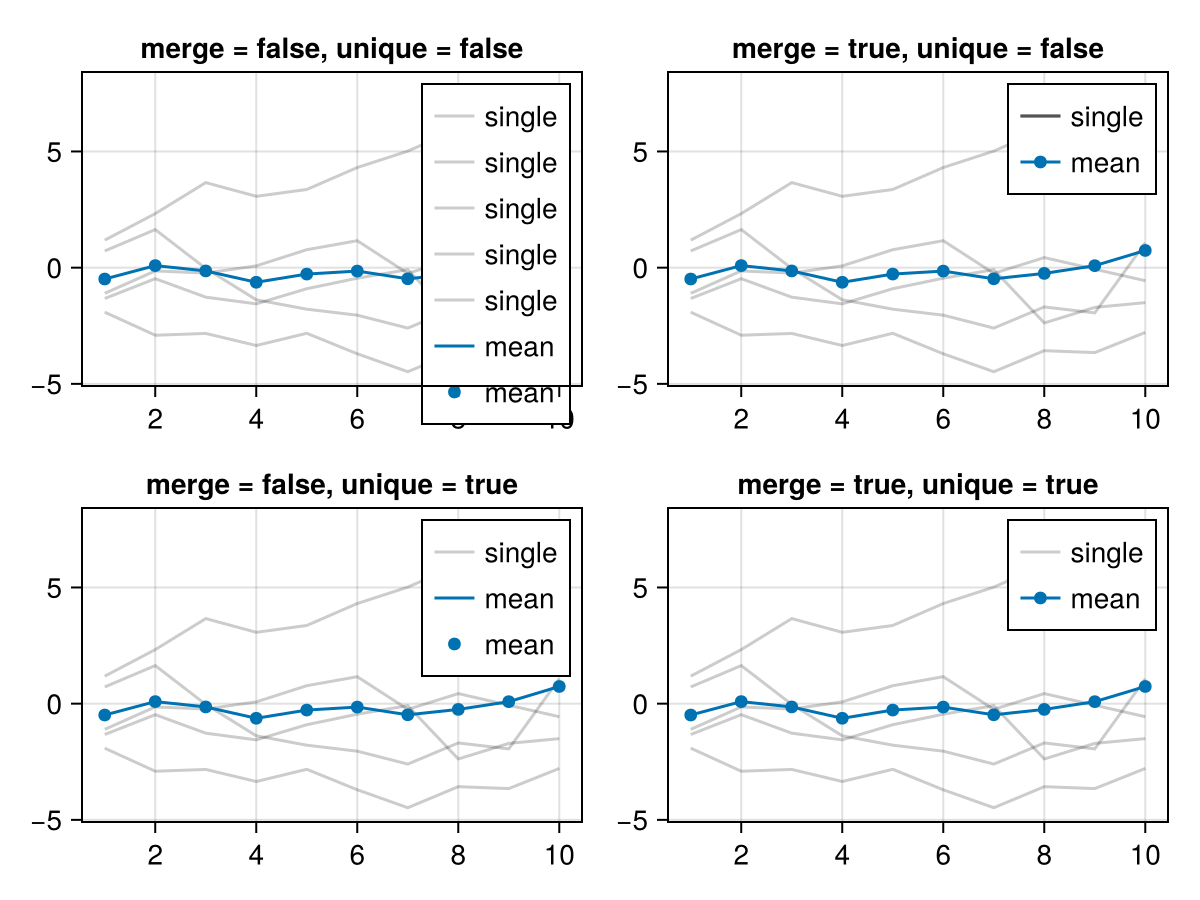
轴内的图例
该 n.轴,轴 函数是向轴添加图例的快速方法。 您可以传递一个选定的轴加上参数,这些参数被转发到 传说 构造函数,或者默认使用当前轴。 如果您只传递一个字符串,它将用作当前轴的标题。
位置可以通过一个快捷符号来设置,首先是halign(l,r,c),然后是valign(b,t,c),例如:lt表示左边,顶部和:cb表示中间底部。 或者您可以使用元素从0到1的元组(halign,valign)设置位置: 位置=(0.1,0.9)
</无翻译>
using CairoMakie

f = Figure()

ax = Axis(f[1, 1])

sc1 = scatter!(randn(10, 2), color = :red, label = "Red Dots")
sc2 = scatter!(randn(10, 2), color = :blue, label = "Blue Dots")
scatter!(randn(10, 2), color = :orange, label = "Orange Dots")
scatter!(randn(10, 2), color = :cyan, label = "Cyan Dots")

axislegend()

axislegend("Titled Legend", position = :lb)

axislegend(ax, [sc1, sc2], ["One", "Two"], "Selected Dots", position = :rb,
    orientation = :horizontal)

f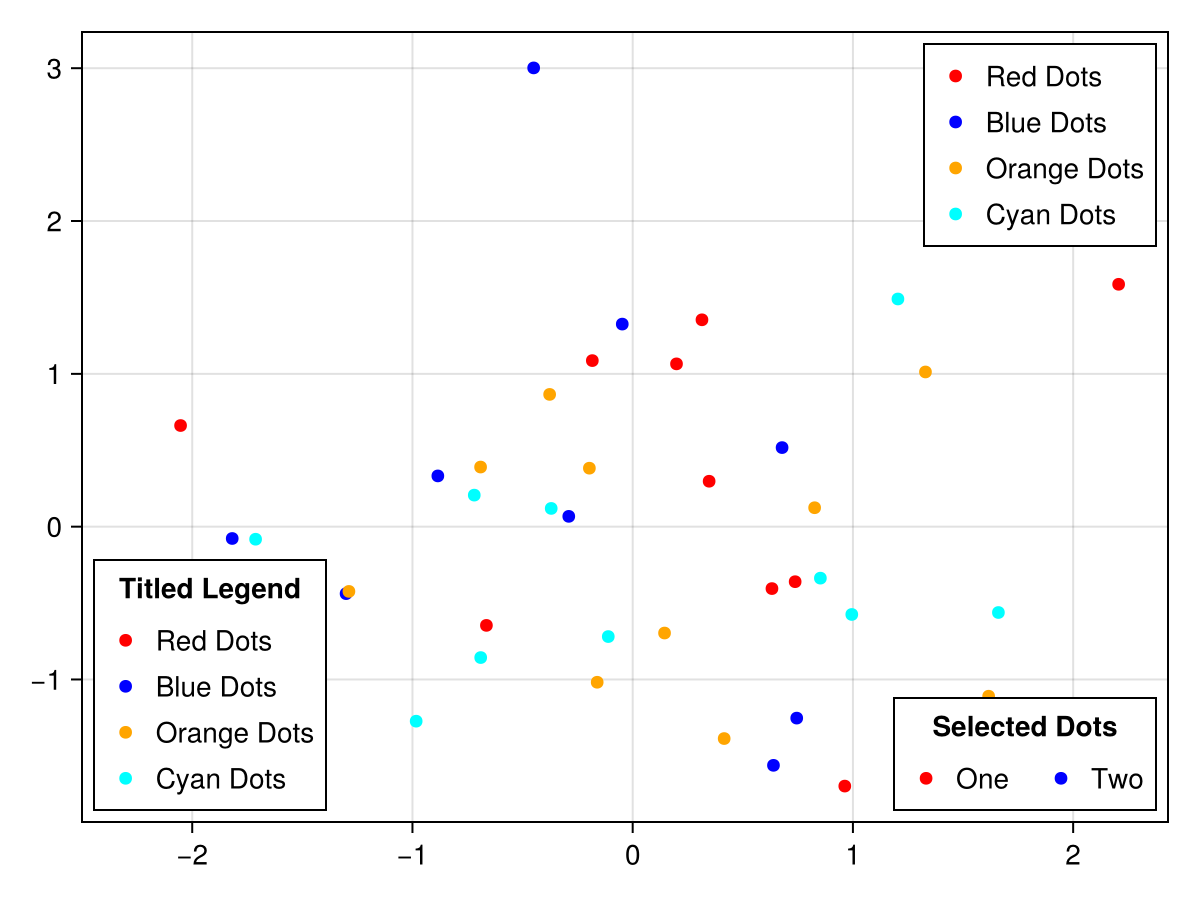
或者,您可以简单地将图例添加到轴所在的同一布局槽中。 只要轴大于图例,您就可以设置图例的 告诉我们 和 告诉宽度 到 错误 并使用对齐变量定位它。 您可以使用margin关键字来防止图例与轴棘接触。
</无翻译>
using CairoMakie

haligns = [:left, :right, :center]
valigns = [:top, :bottom, :center]

f = Figure()

Axis(f[1, 1])

xs = 0:0.1:10
lins = [lines!(xs, sin.(xs .* i), color = color)
    for (i, color) in zip(1:3, [:red, :blue, :green])]

for (j, ha, va) in zip(1:3, haligns, valigns)
    Legend(
        f[1, 1], lins, ["Line $i" for i in 1:3],
        "$ha & $va",
        tellheight = false,
        tellwidth = false,
        margin = (10, 10, 10, 10),
        halign = ha, valign = va, orientation = :horizontal
    )
end

f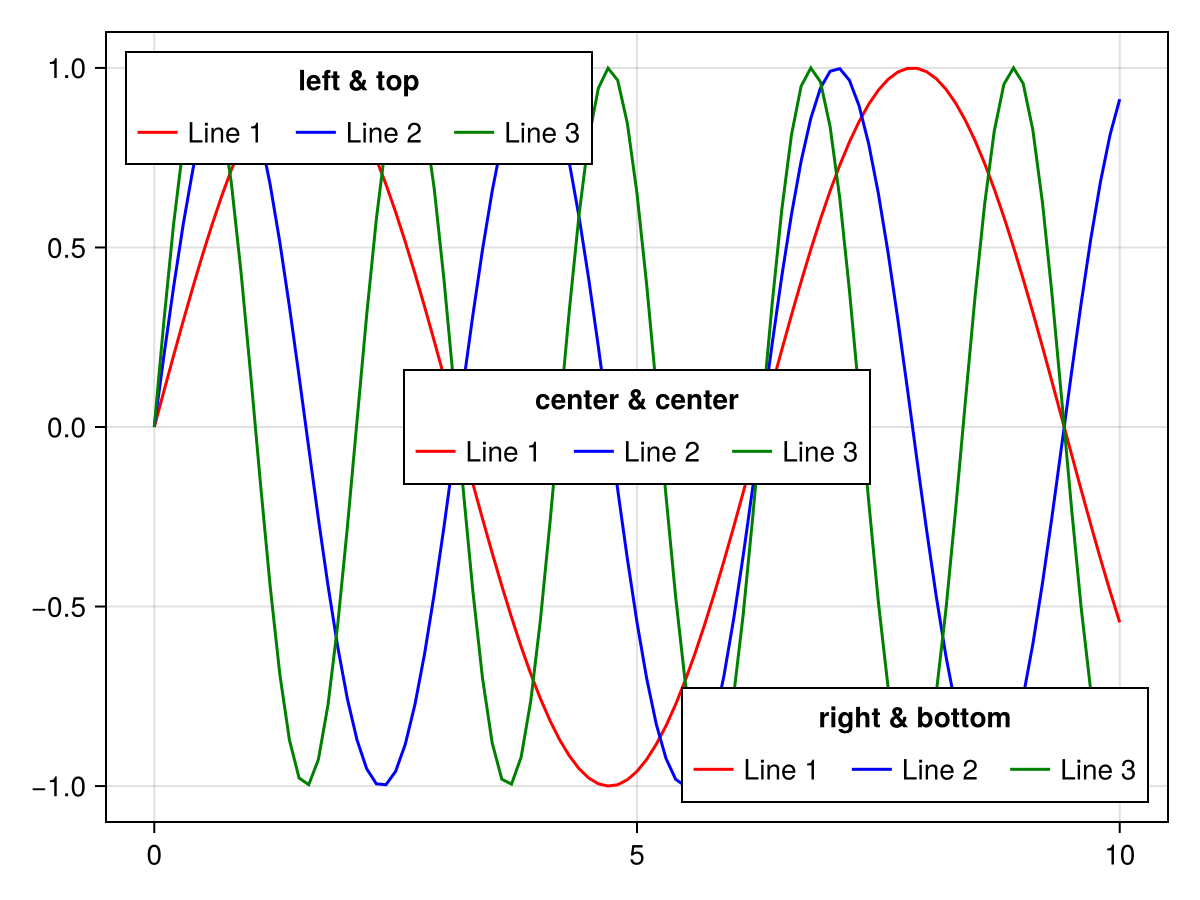
手动创建图例条目
有时您可能希望从头开始构建图例条目以获得最大程度的控制。 到目前为止,您可以使用 线程;线程s, 标记,标记s或 多元元素这些元素的属性如下( [] 直接构造这些元素时可以省略部分,但必须为图例所包含的属性完全写出):
# LineElement
[line]points, [line]color, linestyle, linewidth

# MarkerElement
[marker]points, marker, markersize, [marker]color,
[marker]strokewidth, [marker]strokecolor

# PolyElement
[poly]points, [poly]color, [poly]strokewidth, [poly]strokecolor
属性 线点,线点, 标记点 和 多点剂,多点剂 确定图例条目patch矩形中绘图对象的位置。 这些值应归一化为1乘1矩形,最终形状取决于 补丁大小 的传说。 例如,如果你想要更宽的线和多标记,你可以设置 补丁大小 传说中的 (50, 30).
</无翻译>
using CairoMakie

f = Figure()

轴(f[1,1])

elem_1=[LineElement(color=:red,linestyle=nothing),
          MarkerElement(color=:blue,marker='x',markersize=15,
          strokecolor=:黑色)]

elem_2=[多元元素(颜色=:红色,strokecolor=:蓝色,strokewidth=1),
          LineElement(color=:black,linestyle=:dash)]

elem_3=LineElement(color=:green,linestyle=nothing,
        积分=Point2f[(0, 0), (0, 1), (1, 0), (1, 1)])

elem_4=MarkerElement(颜色=:蓝色,标记='π',markersize=15,
        积分=Point2f[(0.2, 0.2), (0.5, 0.8), (0.8, 0.2)])

elem_5=多元元素(颜色=:绿色,strokecolor=:黑色,strokewidth=2,
        积分=Point2f[(0, 0), (1, 0), (0, 1)])

图例(f[1,2],
    [elem_1,elem_2,elem_3,elem_4,elem_5],
    ["线和标记","Poly&Line","线","标记","Poly"],
    patchsize=(35,35),rowgap=10)

f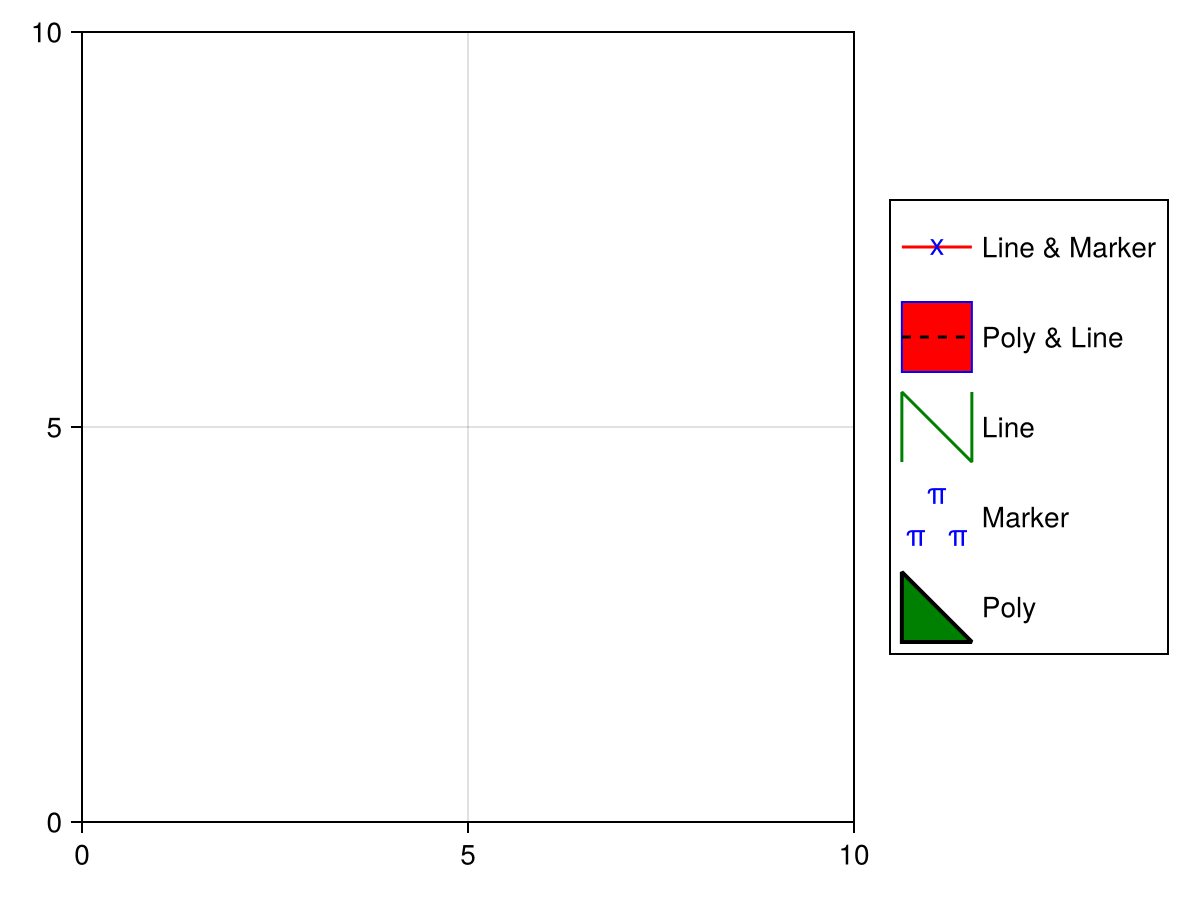
复盖图例条目属性
默认情况下,图例继承其所属图的视觉属性。 有时,有必要复盖其中一些属性以使图例更清晰。 您可以将键值对象配对,如 命名的,命名的 或一个 Dict{Symbol} 到一个情节的 标签 要复盖其自动图例条目,例如增加a的标记大小 散点,散点:
</无翻译>
using CairoMakie
f, ax, sc = scatter(
    cos.(range(0, 7pi, 100)),
    color = :black,
    markersize = 8,
    label = "cos" => (; markersize = 15)
)
scatter!(
    sin.(range(0, 7pi, 100)),
    color = :black,
    marker = :utriangle,
    markersize = 8,
    label = "sin" => (; markersize = 15)
)
Legend(f[1, 2], ax)
f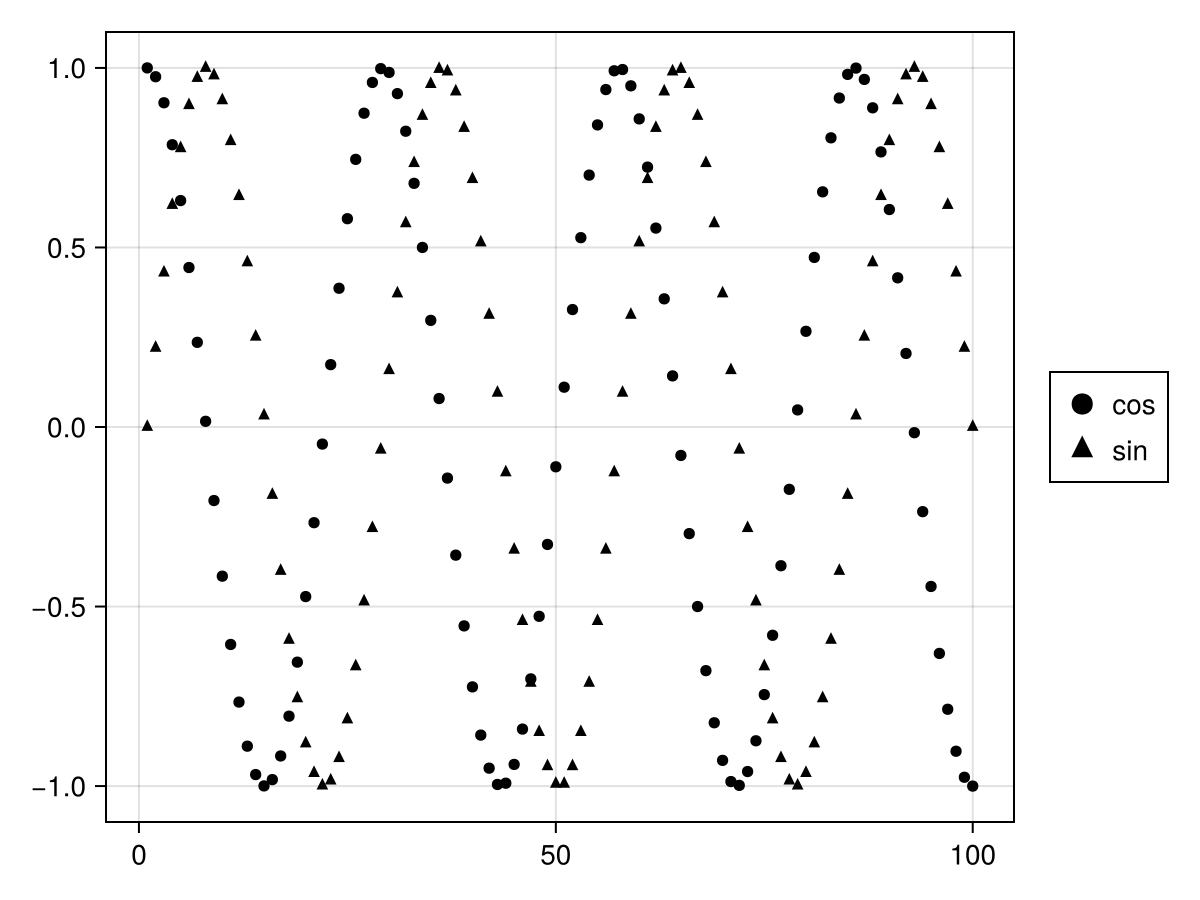
这些是您可以复盖的属性(请注意,其中一些具有方便别名,如 颜色 它适用于所有元素,而 多色,多色 只适用于 多元元素s):
-
标记,标记-
[标记]点,标记大小,[标记]strokewidth,[标记]颜色,[标记]strokecolor,[标记]颜色范围,[标记]颜色表
-
-
线程;线程-
[线]点,线宽,[线]颜色,林泳,林泳,[线]颜色范围,[线]颜色表
-
-
多元元素-
[聚]点,[聚]strokewidth,[聚]颜色,[聚]strokecolor,[多]颜色变化,[聚]颜色表
-
using CairoMakie
f, ax, bp = barplot(
    1:5,
    [1, 3, 2, 5, 4],
    color = 1:5,
    colorrange = (1, 5),
    colormap = :Set1_5,
    label = [label => (; color = i)
        for (i, label) in enumerate(["red", "blue", "green", "purple", "orange"])]
)
Legend(f[1, 2], ax)
f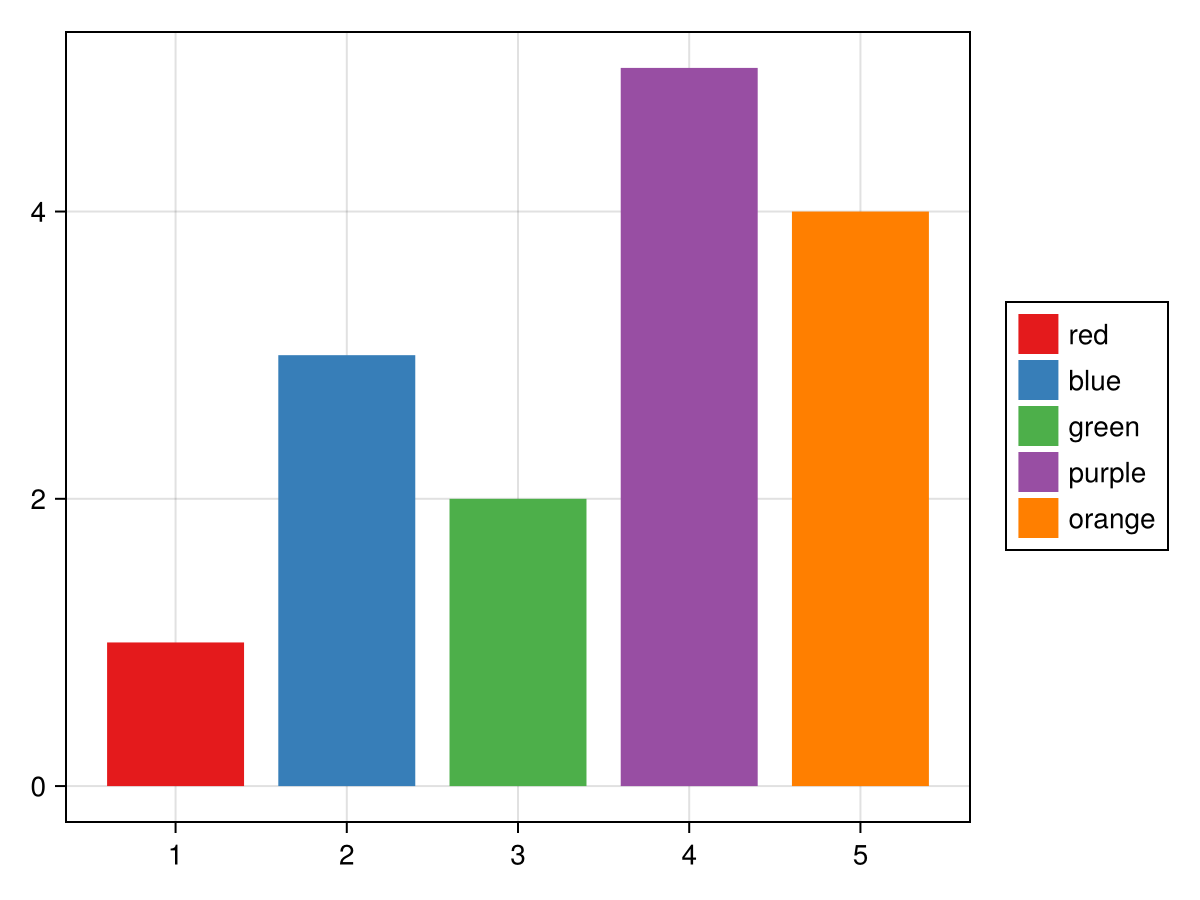
using CairoMakie
f = Figure()
ax = Axis(f[1, 1])
li = lines!(ax, 1:5, linestyle = :dot)
sc = scatter!(ax, 1:5, markersize = 10)
Legend(
    f[1, 2],
    [
        sc => (; markersize = 20),
        li => (; linewidth = 3),
        [li, sc] => (; color = :red),
        [li => (; linewidth = 3), sc => (; markersize = 20)],
    ],
    ["Scatter", "Line", "Both", "Both 2"],
    patchsize = (40, 20),
)
f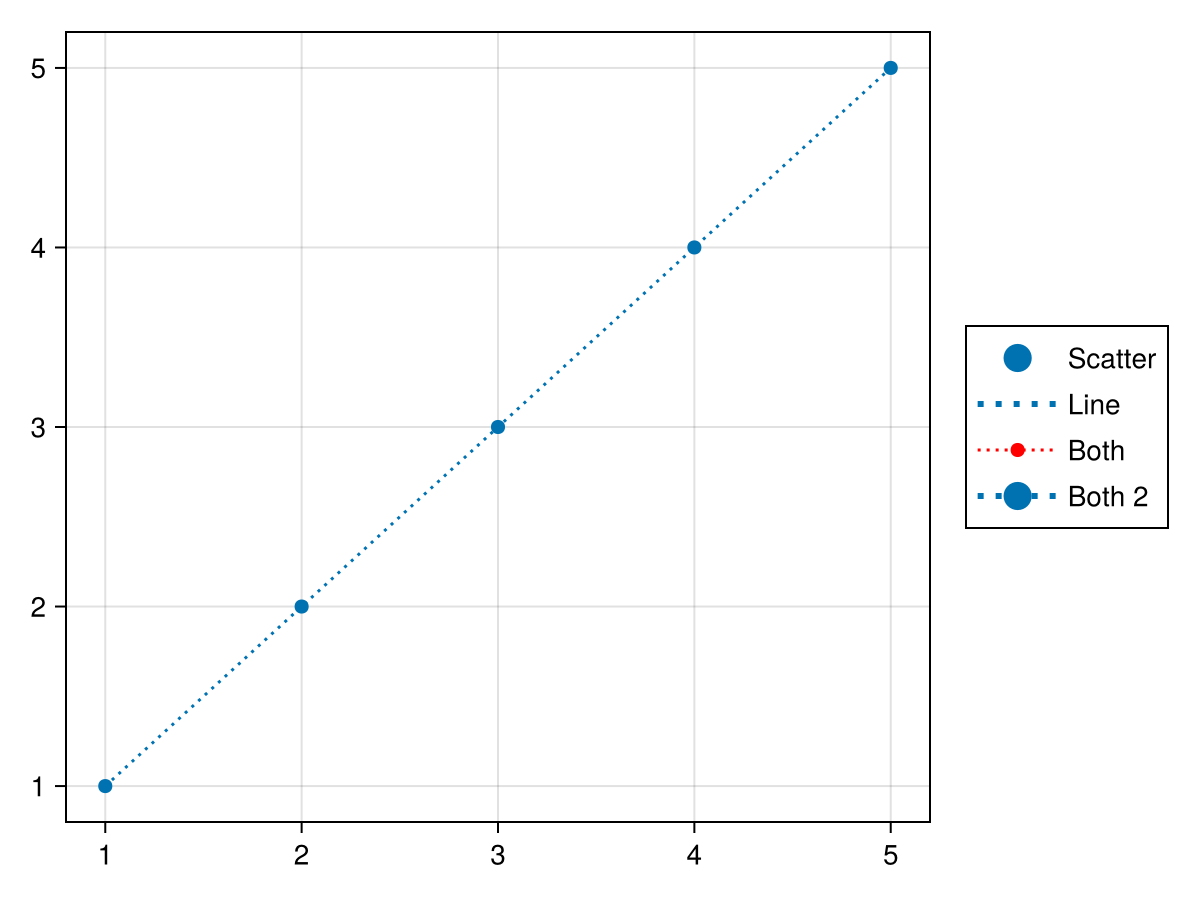
多组传奇
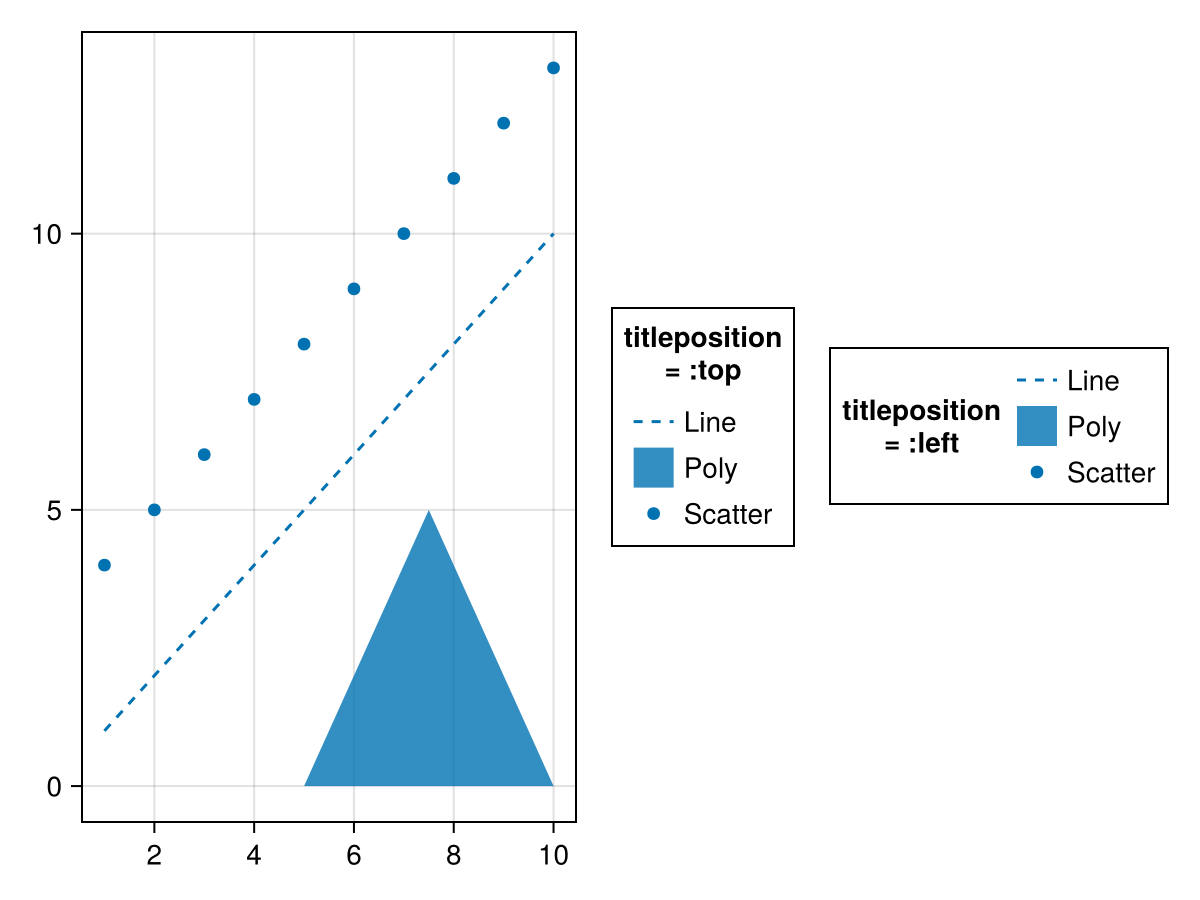
有时一个图例由多个组组成,例如在一个图中,标记大小和颜色都是不同的,这些属性需要单独可视化,但仍然在一个图例中一起显示。 每个组的内容以元素数组和标签数组的形式给出,每个元素都在一个集体数组中。 您可以使用 [医]定位 属性,要么 :左 或 :顶部.
</无翻译>
using CairoMakie

f = Figure()

markersizes = [5, 10, 15, 20]
colors = [:red, :green, :blue, :orange]

group_size = [MarkerElement(marker = :circle, color = :black,
    strokecolor = :transparent,
    markersize = ms) for ms in markersizes]

group_color = [PolyElement(color = color, strokecolor = :transparent)
    for color in colors]

legends = [Legend(f,
    [group_size, group_color],
    [string.(markersizes), string.(colors)],
    ["Size", "Color"], tellheight = true) for _ in 1:4]

f[1, 1:2] = legends[1:2]
f[2, :] = legends[3]
f[3, :] = legends[4]

for l in legends[3:4]
    l.orientation = :horizontal
    l.tellheight = true
    l.tellwidth = false
end

legends[2].titleposition = :left
legends[4].titleposition = :left

传说[1]。nbanks=2
传说[4]。nbanks=2

Label(f[1,1,Left()],"titleposition=:top\norientation=:vertical\nnbanks=2",font=:italic,padding= (0, 10, 0, 0))
Label(f[1,2,Right()],"titleposition=:left\norientation=:vertical\nnbanks=1",font=:italic,padding= (10, 0, 0, 0))
Label(f[2,1:2,Top()],"titleposition=:top,orientation=:horizontal\nnbanks=1",font=:italic)
Label(f[3,1:2,Top()],"titleposition=:left,orientation=:horizontal\nnbanks=2",font=:italic)

f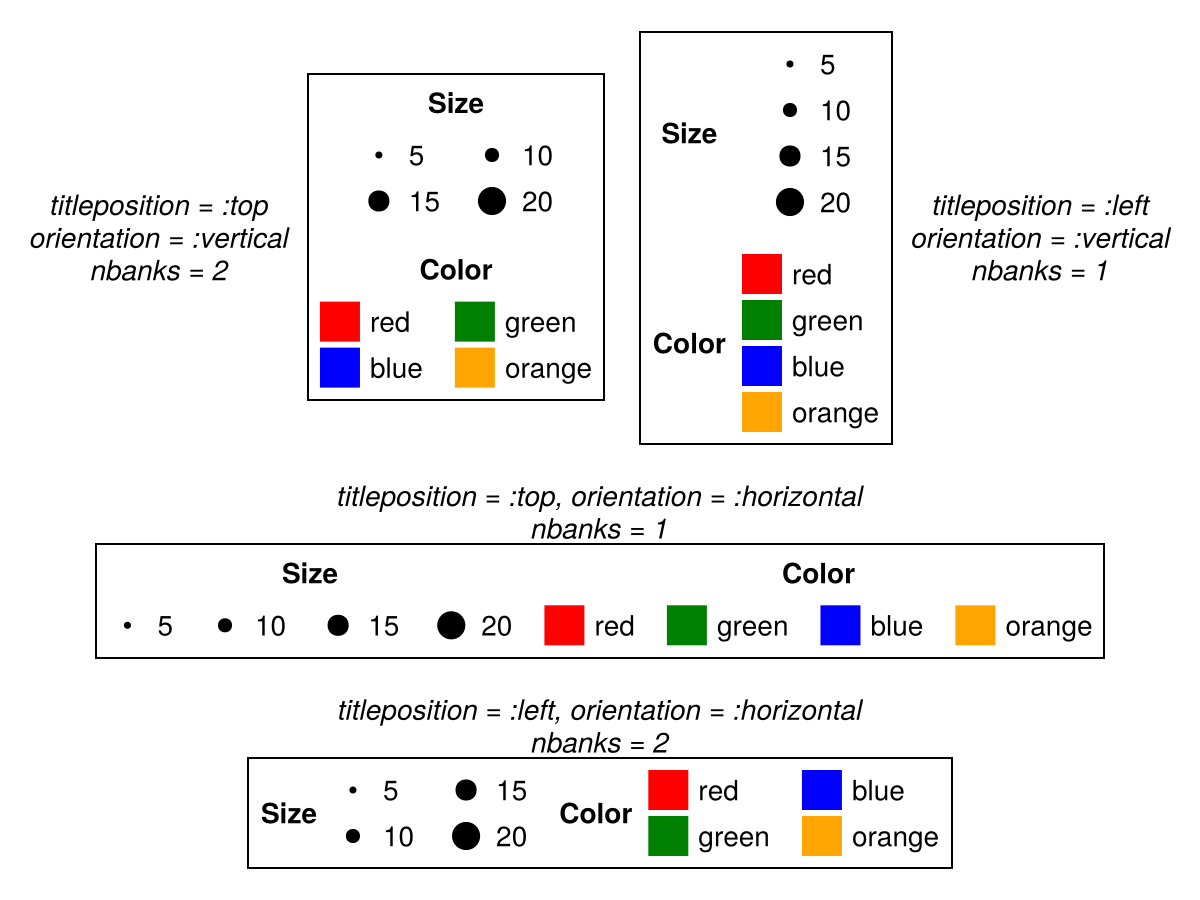
属性
科尔加普
默认值为 16
using CairoMakie
fig = Figure()
ax = Axis(fig[1, 1])
lines!(ax, 1:10, linestyle = :dash, label = "Line")
poly!(ax, [(5, 0), (10, 0), (7.5, 5)], label = "Poly")
scatter!(ax, 4:13, label = "Scatter")
Legend(fig[1, 2], ax, "Default", nbanks = 2)
Legend(fig[1, 3], ax, "colgap = 40", nbanks = 2, colgap = 40)
fig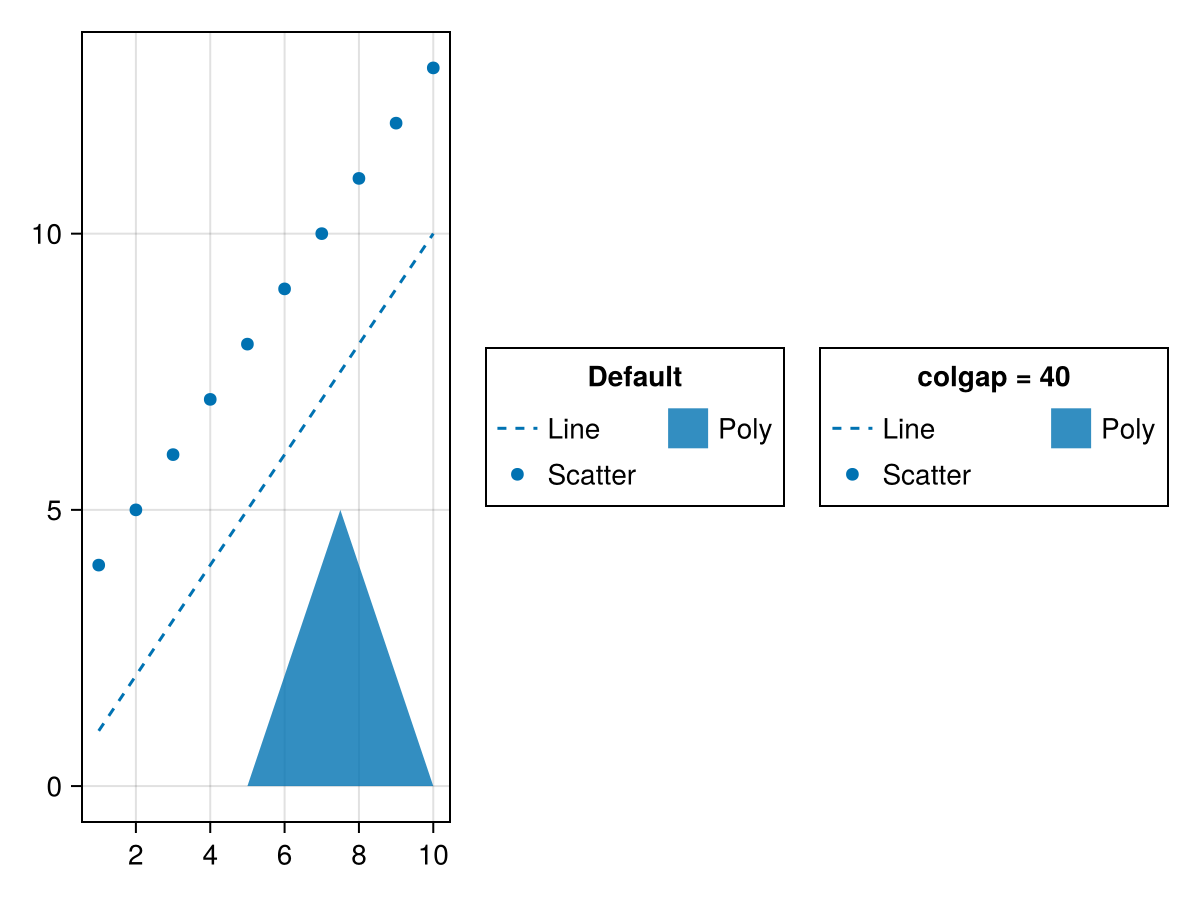
团体/团体
默认值为 16
using CairoMakie
fig = Figure()
ax = Axis(fig[1, 1])
lin = lines!(ax, 1:10, linestyle = :dash)
pol = poly!(ax, [(5, 0), (10, 0), (7.5, 5)])
sca = scatter!(ax, 4:13)
Legend(fig[1, 2],
    [[lin], [pol], [sca]],
    [["Line"], ["Poly"], ["Scatter"]],
    ["Default", "Group 2", "Group 3"];

)
Legend(fig[1, 3],
    [[lin], [pol], [sca]],
    [["Line"], ["Poly"], ["Scatter"]],
    ["groupgap = 30", "Group 2", "Group 3"];
    groupgap = 30,
)
fig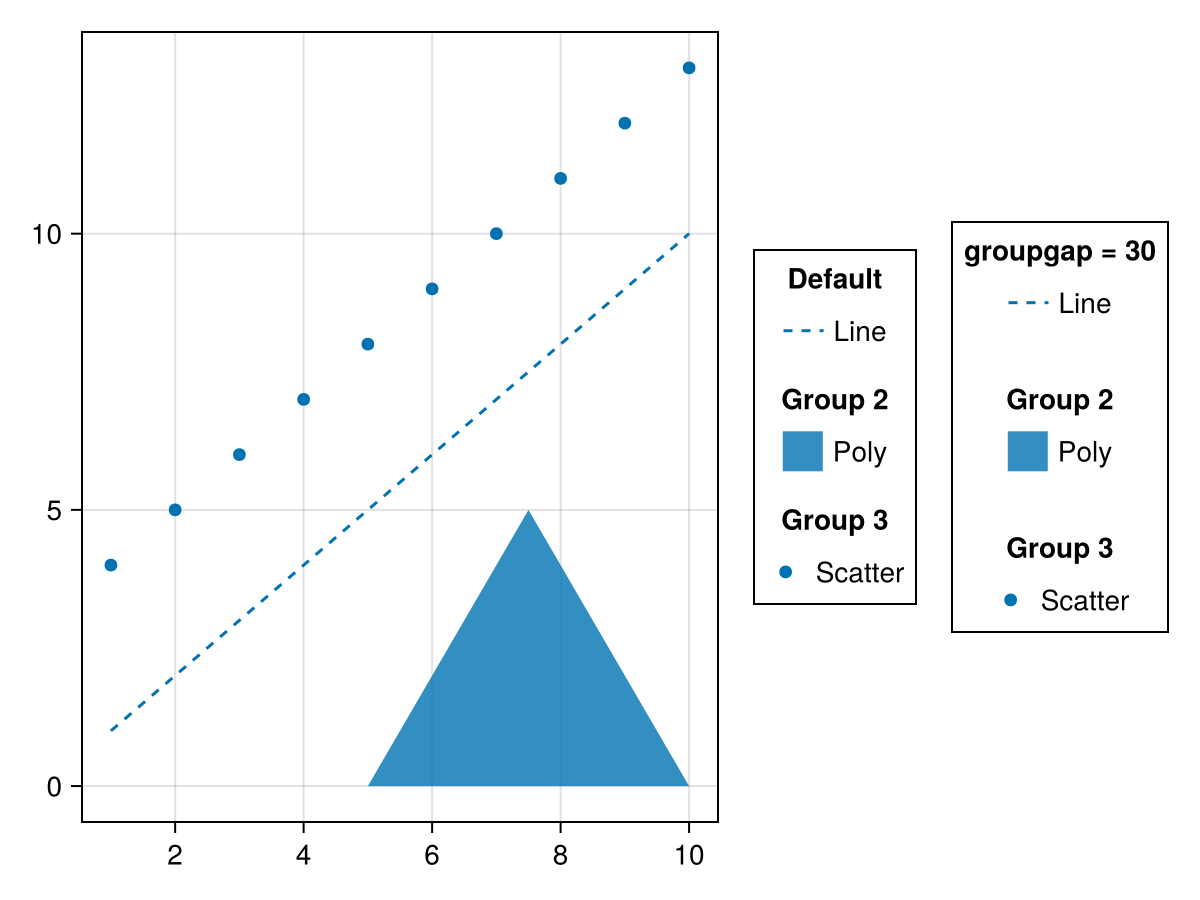
nbanks
默认值为 1
using CairoMakie
fig = Figure()
ax = Axis(fig[1, 1])
lines!(ax, 1:10, linestyle = :dash, label = "Line")
poly!(ax, [(5, 0), (10, 0), (7.5, 5)], label = "Poly")
scatter!(ax, 4:13, label = "Scatter")
grid = GridLayout(fig[1, 2], tellheight = false)
Legend(grid[1, 1], ax, "nbanks = 1", nbanks = 1, tellheight = true)
Legend(grid[1, 2], ax, "nbanks = 2", nbanks = 2, tellheight = true)
Legend(grid[2, :], ax, "nbanks = 3", nbanks = 3, tellheight = true)
fig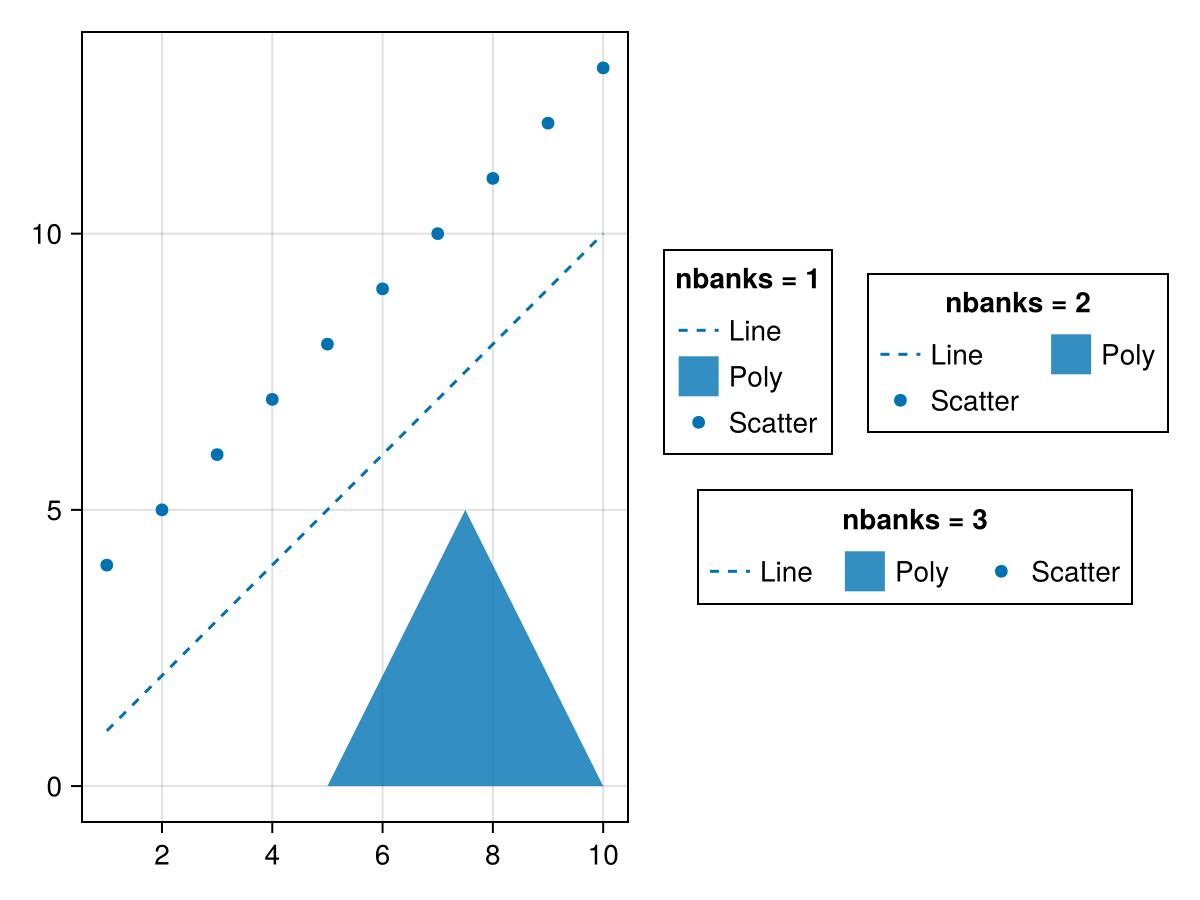
using CairoMakie
fig = Figure()
ax = Axis(fig[1, 1])
lines!(ax, 1:10, linestyle = :dash, label = "Line")
poly!(ax, [(5, 0), (10, 0), (7.5, 5)], label = "Poly")
scatter!(ax, 4:13, label = "Scatter")
grid = GridLayout(fig[2, 1], tellwidth = false)
Legend(grid[1, 1], ax, "nbanks = 1", nbanks = 1,
    orientation = :horizontal, tellwidth = true)
Legend(grid[2, 1], ax, "nbanks = 2", nbanks = 2,
    orientation = :horizontal, tellwidth = true)
Legend(grid[:, 2], ax, "nbanks = 3", nbanks = 3,
    orientation = :horizontal, tellwidth = true)
fig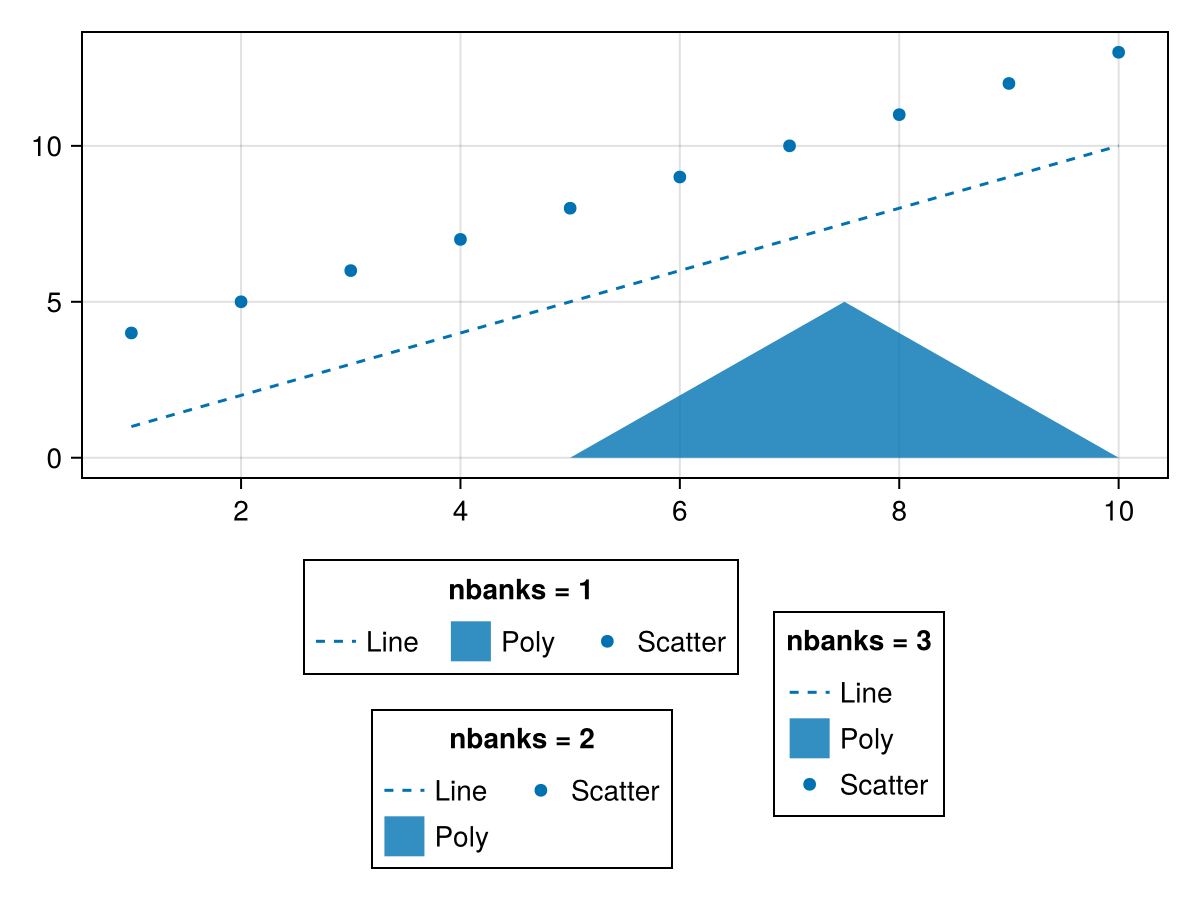
方向感
默认值为 :垂直
using CairoMakie
fig = Figure()
ax = Axis(fig[1, 1])
lines!(ax, 1:10, linestyle = :dash, label = "Line")
poly!(ax, [(5, 0), (10, 0), (7.5, 5)], label = "Poly")
scatter!(ax, 4:13, label = "Scatter")
Legend(fig[2, 1], ax, "orientation
= :horizontal", orientation = :horizontal)
Legend(fig[1, 2], ax, "orientation
= :vertical", orientation = :vertical)
fig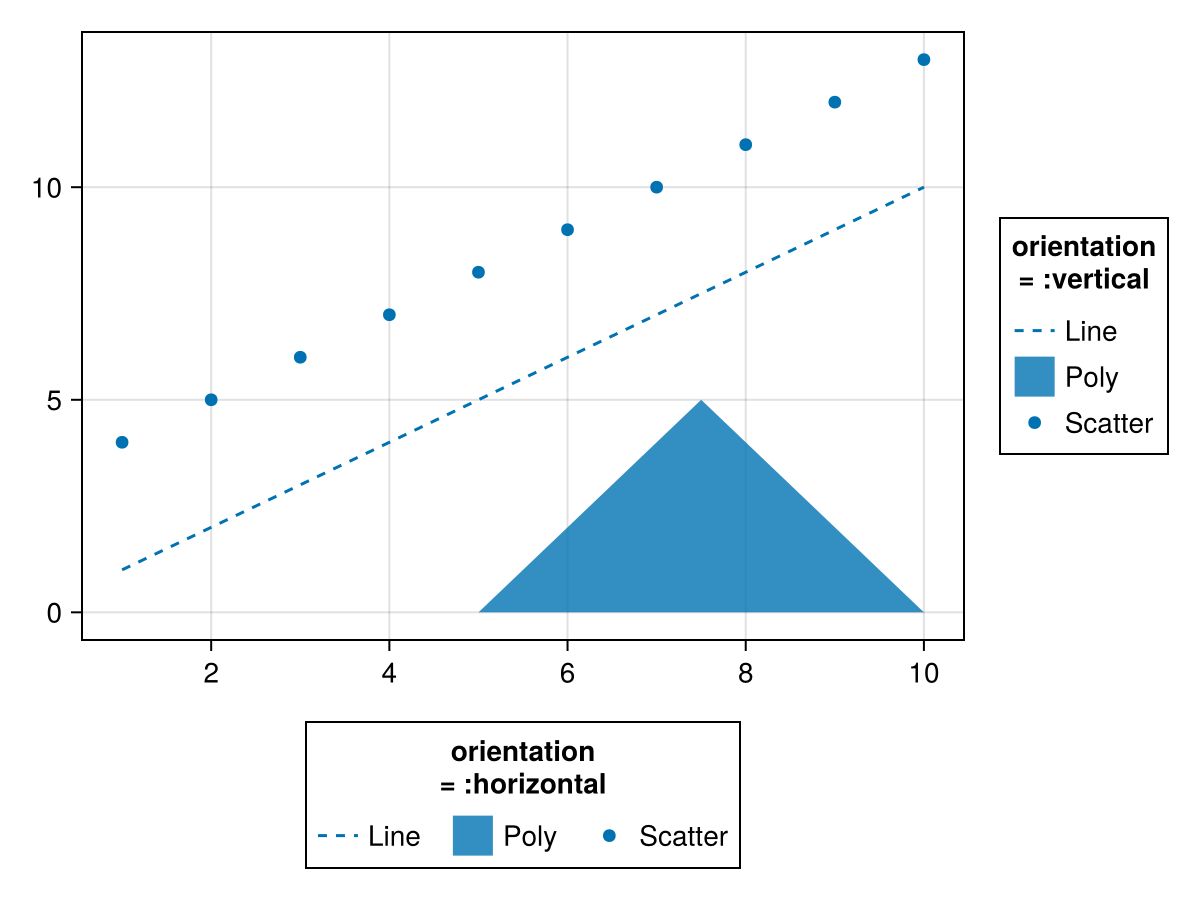
[医]贴片,贴片
默认值为 5
using CairoMakie
fig = Figure()
ax = Axis(fig[1, 1])
lines!(ax, 1:10, linestyle = :dash, label = "Line")
poly!(ax, [(5, 0), (10, 0), (7.5, 5)], label = "Poly")
scatter!(ax, 4:13, label = "Scatter")
Legend(fig[1, 2], ax, "Default")
Legend(fig[1, 3], ax, "patchlabelgap
= 20", patchlabelgap = 20)
fig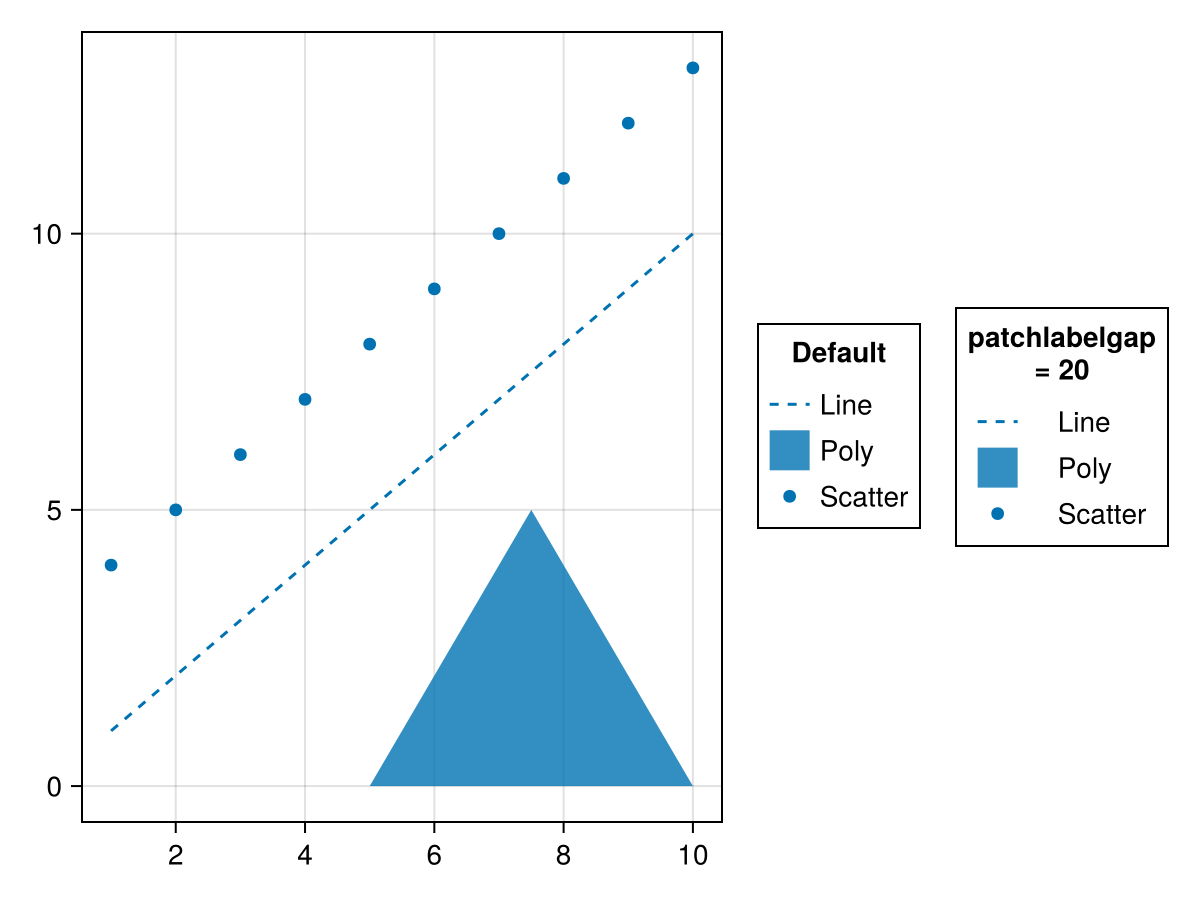
补丁大小
默认值为 (20.0f0,20.0f0)
using CairoMakie
fig = Figure()
ax = Axis(fig[1, 1])
lines!(ax, 1:10, linestyle = :dash, label = "Line")
poly!(ax, [(5, 0), (10, 0), (7.5, 5)], label = "Poly")
scatter!(ax, 4:13, label = "Scatter")
Legend(fig[1, 2], ax, "Default")
Legend(fig[1, 3], ax, "(40, 20)", patchsize = (40, 20))
fig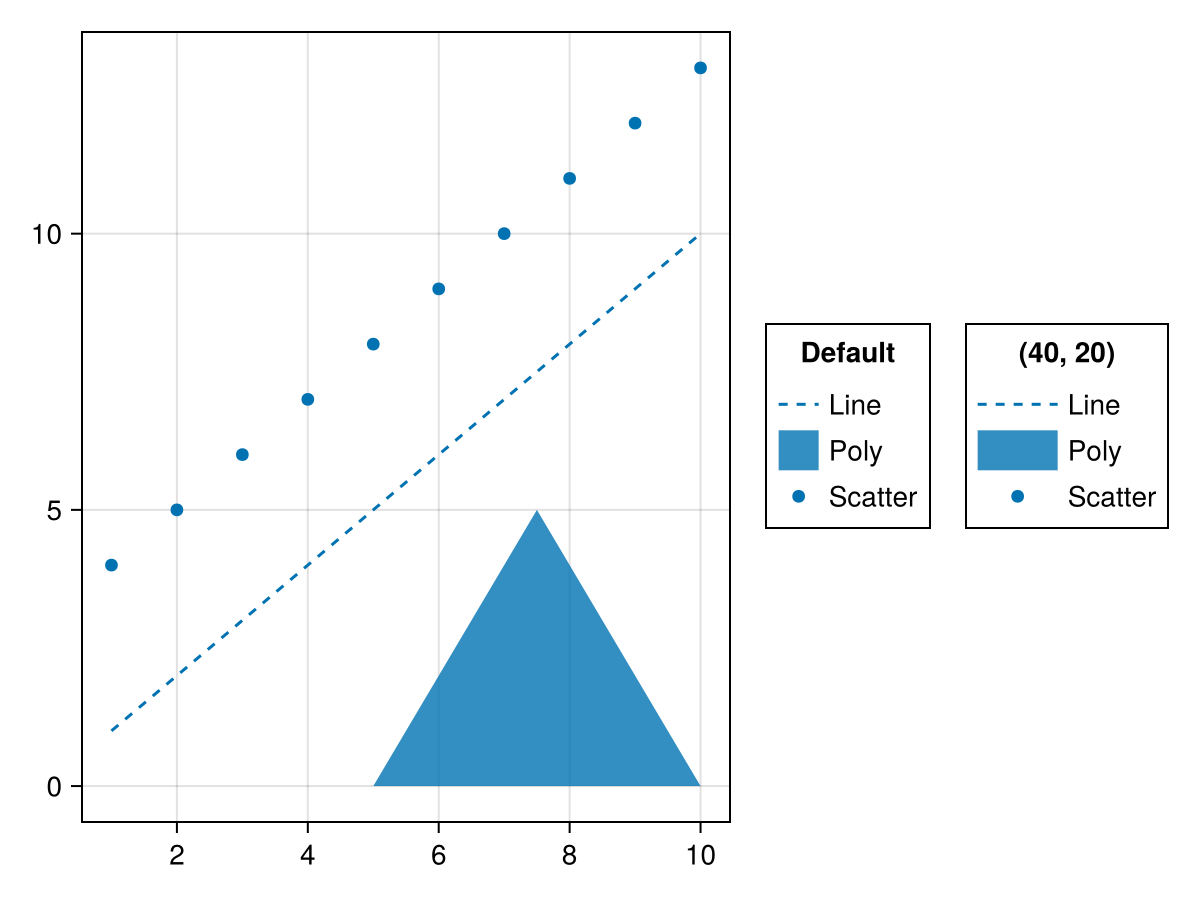
rowgap,rowgap
默认值为 3
using CairoMakie
fig = Figure()
ax = Axis(fig[1, 1])
lines!(ax, 1:10, linestyle = :dash, label = "Line")
poly!(ax, [(5, 0), (10, 0), (7.5, 5)], label = "Poly")
scatter!(ax, 4:13, label = "Scatter")
Legend(fig[1, 2], ax, "Default")
Legend(fig[1, 3], ax, "rowgap = 10", rowgap = 10)
fig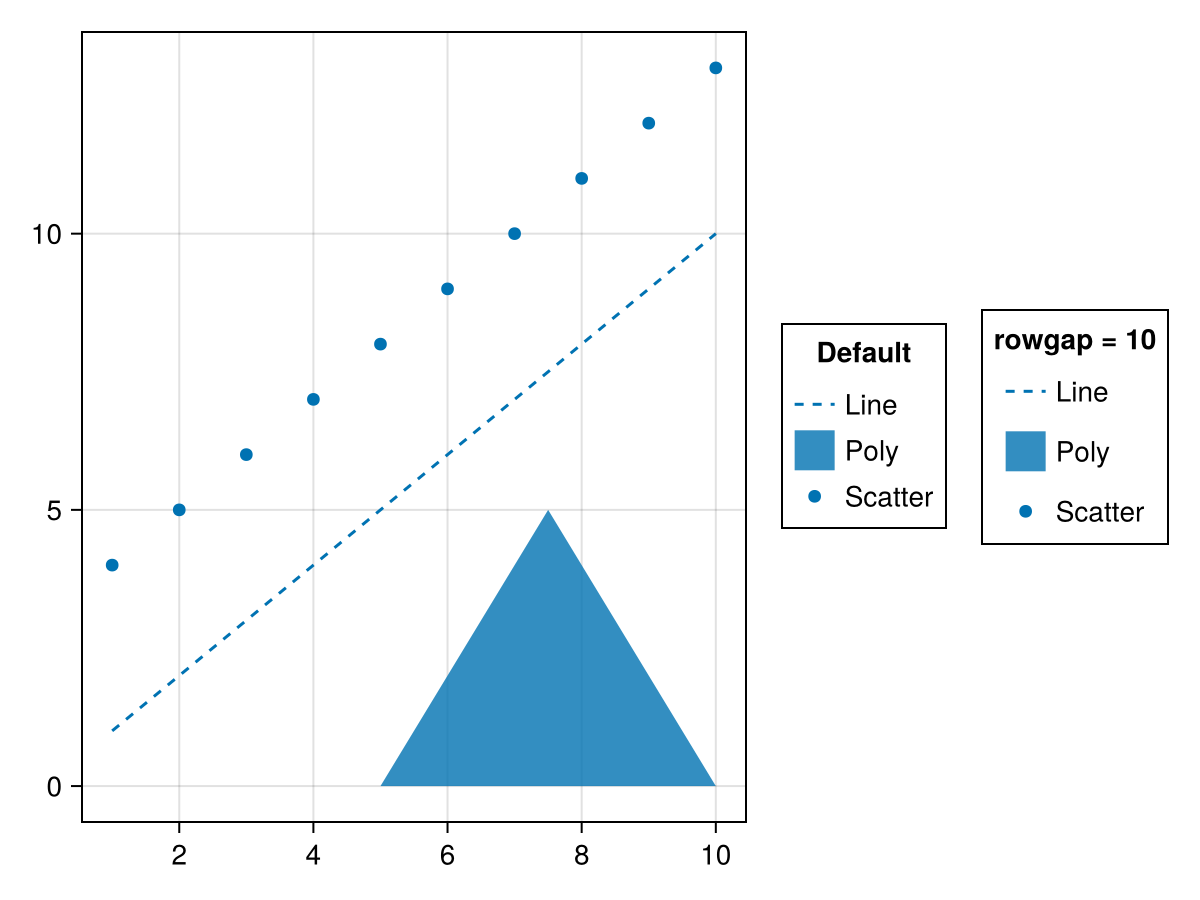
浮出水面
默认值为 (-0.7 .. 0.7, -0.7 .. 0.7,[-0.007*x^3*(1-0.05*y^2)对于x=-5:5,y=-5:5])
用于基于曲面的网格单元的默认(x,y,z)数据。 对于3D元素,摄像机位于(1,1,1)处,朝向(0,0,0),z向上。
[医]定位
默认值为 :顶部
using CairoMakie
fig = Figure()
ax = Axis(fig[1, 1])
lines!(ax, 1:10, linestyle = :dash, label = "Line")
poly!(ax, [(5, 0), (10, 0), (7.5, 5)], label = "Poly")
scatter!(ax, 4:13, label = "Scatter")
Legend(fig[1, 2], ax, "titleposition
= :top", titleposition = :top)
Legend(fig[1, 3], ax, "titleposition
= :left", titleposition = :left)
fig