Примеры
Ненаправленный граф
Построим ненаправленный граф с помеченными узлами и индивидуальными размерами или цветами узлов.
using GraphRecipes
using Plots
const n = 15
const A = Float64[ rand() < 0.5 ? 0 : rand() for i=1:n, j=1:n]
for i=1:n
A[i, 1:i-1] = A[1:i-1, i]
A[i, i] = 0
end
graphplot(A,
markersize = 0.2,
node_weights = 1:n,
markercolor = range(colorant"yellow", stop=colorant"red", length=n),
names = 1:n,
fontsize = 10,
linecolor = :darkgrey
)Теперь построим граф в трех измерениях.
graphplot(A,
node_weights = 1:n,
markercolor = :darkgray,
dim = 3,
markersize = 5,
linecolor = :darkgrey,
linealpha = 0.5
)Graphs.jl
Вы можете визуализировать Graphs.AbstractGraph, передав его в graphplot.
using GraphRecipes, Plots
using Graphs
g = wheel_graph(10)
graphplot(g, curves=false)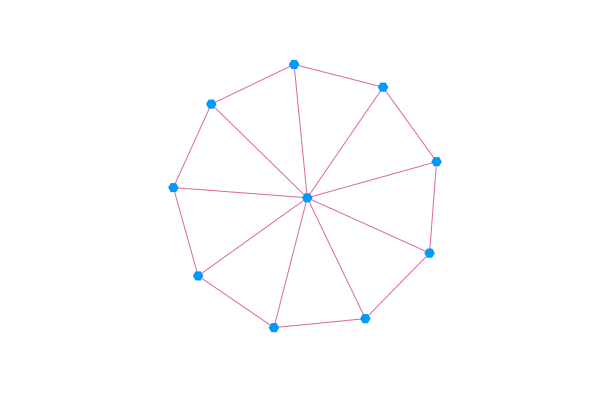
Направленные графы
Если передать graphplot Graphs.DiGraph или асимметричную матрицу смежности, graphplot будет использовать стрелки для указания направления ребер. Обратите внимание, что использование атрибута arrow с бэкендом pythonplot позволяет управлять эстетикой стрелок.
using GraphRecipes, Plots
g = [0 1 1;
0 0 1;
0 1 0]
graphplot(g, names=1:3, curvature_scalar=0.1)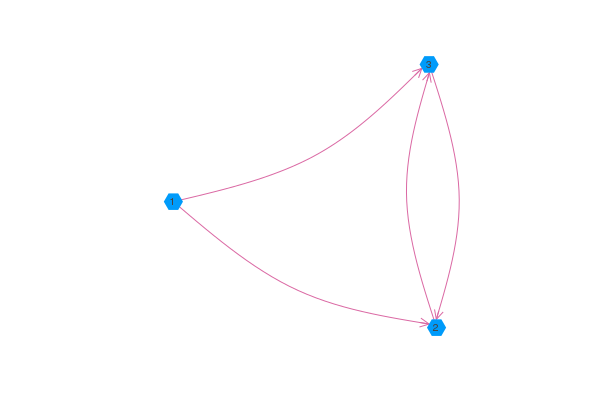
Подписи ребер
Подписи ребер можно передать с помощью именованного аргумента edgelabel. Подписи ребер можно передавать в виде словаря (si::Int, di::Int) => label, где si, di — это индексы исходного и конечного узлов для помечаемого ребра. Или можно передать матрицу или вектор подписей. graphplot попытается преобразовать любую переданную надпись в строку, если только не будет передано одно из значений missing, NaN, nothing, false или "". В этом случае graphplot пропустит надпись.
using GraphRecipes, Plots
using Graphs
n = 8
g = wheel_digraph(n)
edgelabel_dict = Dict()
edgelabel_mat = Array{String}(undef, n, n)
for i in 1:n
for j in 1:n
edgelabel_mat[i, j] = edgelabel_dict[(i, j)] = string("edge ", i, " to ", j)
end
end
edgelabel_vec = edgelabel_mat[:]
graphplot(g, names=1:n, edgelabel=edgelabel_dict, curves=false, nodeshape=:rect) # Или edgelabel=edgelabel_mat, или edgelabel=edgelabel_vec.Петли
using Graphs, Plots, GraphRecipes
g = [1 1 1;
0 0 1;
0 0 1]
graphplot(DiGraph(g), self_edge_size=0.2)Мультиграфы
graphplot([[1,1,2,2],[1,1,1],[1]], names="node_".*string.(1:3), nodeshape=:circle, self_edge_size=0.25)Дуговые и хордовые диаграммы
using LinearAlgebra
using SparseArrays
using GraphRecipes
using Plots
adjmat = Symmetric(sparse(rand(0:1,8,8)))
plot(
graphplot(adjmat,
method=:chorddiagram,
names=[text(string(i), 8) for i in 1:8],
linecolor=:black,
fillcolor=:lightgray),
graphplot(adjmat,
method=:arcdiagram,
markersize=0.5,
linecolor=:black,
markercolor=:black)
)Код Julia — AST
using GraphRecipes
using Plots
default(size=(1000, 1000))
code = :(
function mysum(list)
out = 0
for value in list
out += value
end
out
end
)
plot(code, fontsize=12, shorten=0.01, axis_buffer=0.15, nodeshape=:rect)Деревья типов Julia
using GraphRecipes
using Plots
default(size=(1000, 1000))
plot(AbstractFloat, method=:tree, fontsize=10, nodeshape=:ellipse)Деревья AbstractTrees
using AbstractTrees
AbstractTrees.children(d::Dict) = [p for p in d]
AbstractTrees.children(p::Pair) = AbstractTrees.children(p[2])
function AbstractTrees.printnode(io::IO, p::Pair)
str = isempty(AbstractTrees.children(p[2])) ? string(p[1], ": ", p[2]) : string(p[1], ": ")
print(io, str)
end
d = Dict(:a => 2,:d => Dict(:b => 4,:c => "Hello"),:e => 5.0)
using GraphRecipes
using Plots
default(size=(1000, 1000))
plot(TreePlot(d), method=:tree, fontsize=10, nodeshape=:ellipse)