PolarAxis
|
Страница в процессе перевода. |
PolarAxis — это ось для данных, заданных в полярных координатах, т. е. с радиусом и углом. В настоящее время это экспериментальная функция, поэтому некоторые возможности могут отсутствовать или не работать. Блок PolarAxis (более) активно поддерживает изменения.
Построение графика по PolarAxis
Как и в случае с Axis, изменяемые функции построения двумерных графиков можно использовать непосредственно для PolarAxis. Входные аргументы функций построения графиков будут интерпретироваться в полярных координатах, то есть как угол (в радианах) и радиус. Порядок аргументов можно изменить с помощью ax.theta_as_x.
using CairoMakie
f = Figure(size = (800, 400))

ax = PolarAxis(f[1, 1], title = "Theta as x")
lineobject = lines!(ax, 0..2pi, sin, color = :red)

ax = PolarAxis(f[1, 2], title = "R as x", theta_as_x = false)
scatobject = scatter!(range(0, 10, length=100), cos, color = :orange)

f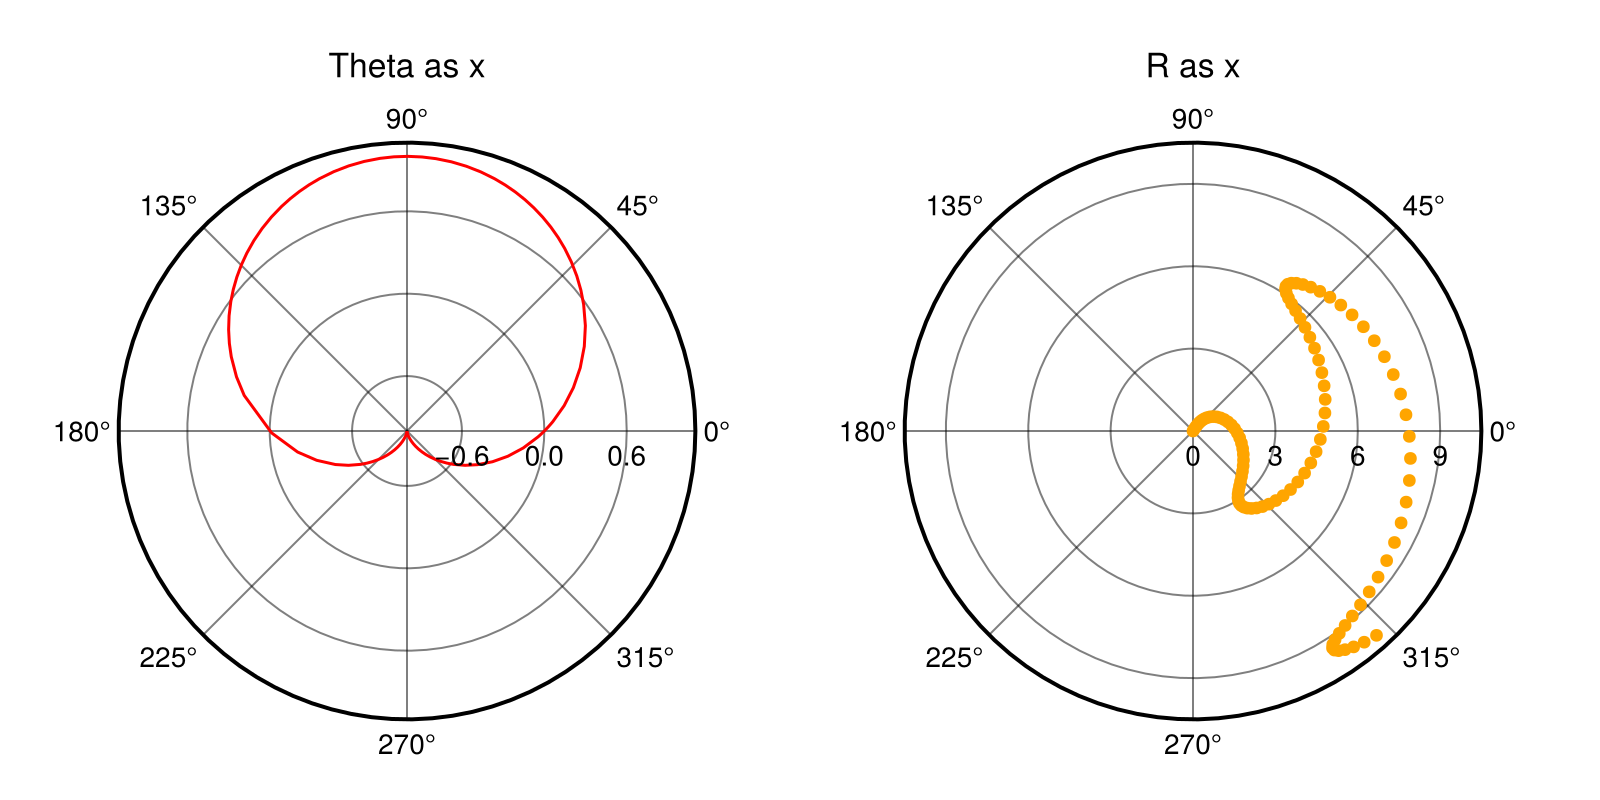
Ограничения для PolarAxis
По умолчанию PolarAxis использует po.rlimits[] = (0.0, nothing) и po.thetalimits[] = (0.0, 2pi) для отображения полного круга. Вы можете настроить эти границы для отображения различных срезов PolarAxis. Например, можно ограничить thetalimits меньшим диапазоном, чтобы сгенерировать сектор круга, и далее ограничить rmin с помощью rlimits, чтобы вырезать центр по дуге.
using CairoMakie
f = Figure(size = (600, 600))

ax = PolarAxis(f[1, 1], title = "Default")
lines!(ax, range(0, 8pi, length=300), range(0, 10, length=300))
ax = PolarAxis(f[1, 2], title = "thetalimits", thetalimits = (-pi/6, pi/6))
lines!(ax, range(0, 8pi, length=300), range(0, 10, length=300))

ax = PolarAxis(f[2, 1], title = "rlimits", rlimits = (5, 10))
lines!(ax, range(0, 8pi, length=300), range(0, 10, length=300))
ax = PolarAxis(f[2, 2], title = "both")
lines!(ax, range(0, 8pi, length=300), range(0, 10, length=300))
thetalims!(ax, -pi/6, pi/6)
rlims!(ax, 5, 10)

f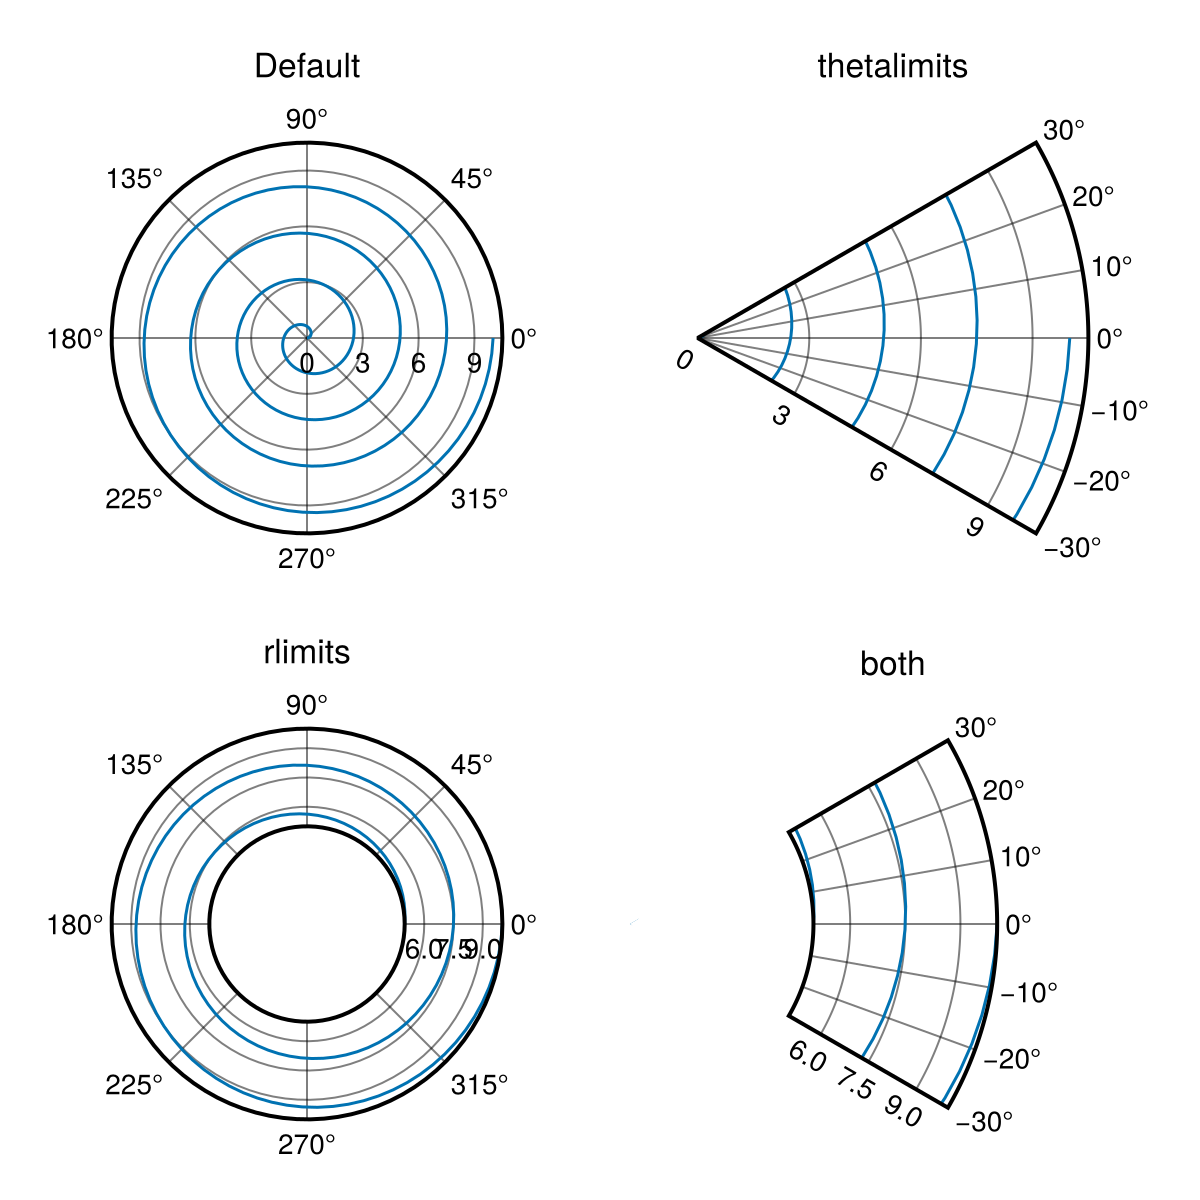
Чтобы внести дополнительные изменения в ориентацию PolarAxis, настройте ax.theta_0 и ax.direction. В этом случае настраивается интерпретация углов полярным преобразованием по формуле output_angle = direction * (input_angle + theta_0).
using CairoMakie
f = Figure()

ax = PolarAxis(f[1, 1], title = "Reoriented Axis", theta_0 = -pi/2, direction = -1)
lines!(ax, range(0, 8pi, length=300), range(0, 10, length=300))
thetalims!(ax, -pi/6, pi/6)
rlims!(ax, 5, 10)

f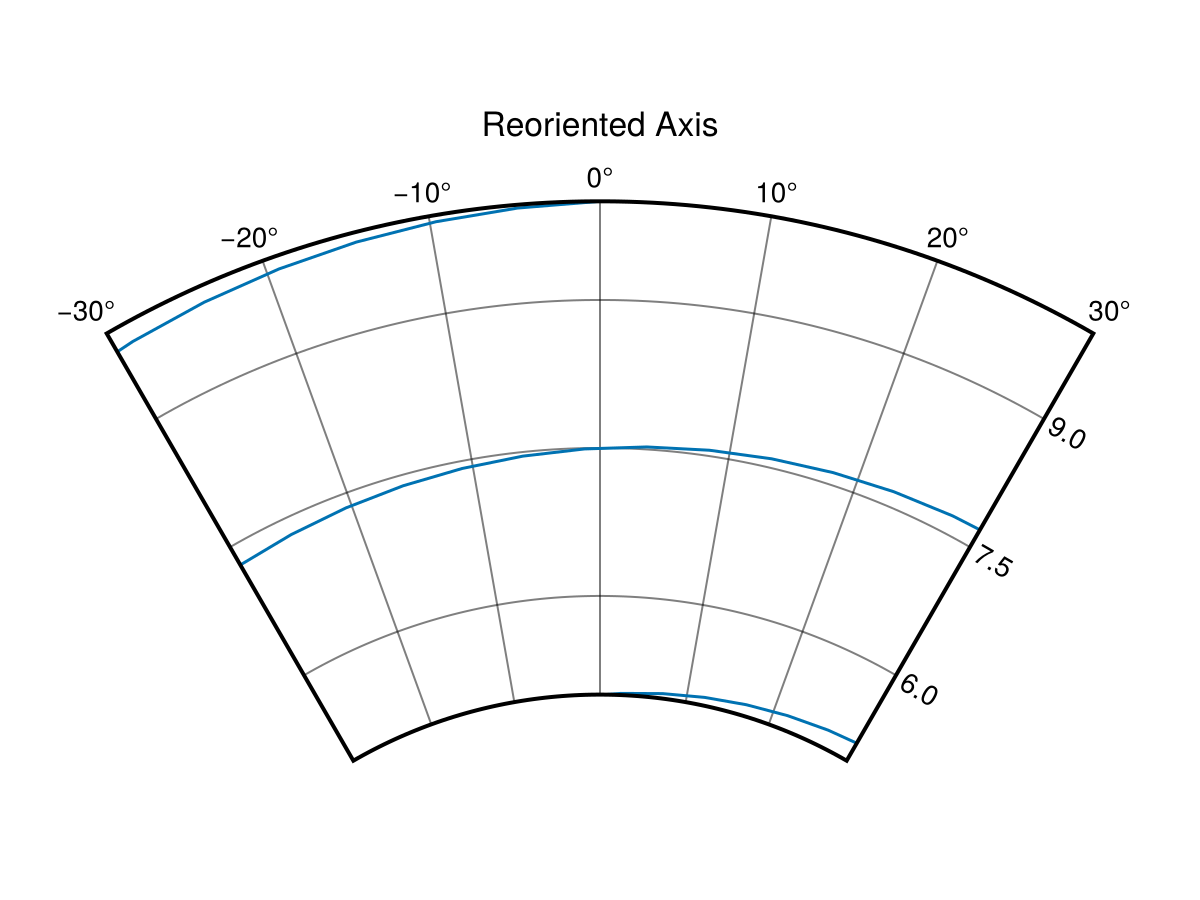
Обратите внимание, что по умолчанию перемещения в настройках rmin и thetalimits блокируются. Их можно разблокировать, вызвав функцию autolimits!(ax[, true]), которая также указывает PolarAxis на возможность получения r- и thetalimits из данных, или задав ax.fixrmin[] = false и ax.thetazoomlock[] = false.
Совместимость типов графиков
Не все типы графиков совместимы с полярным преобразованием. Например, изображение (image) не предназначено для отображения на прямоугольнике. heatmap в некоторой степени работает в CairoMakie, но не в GLMakie из-за различий в реализации бэкенда. surface можно использовать вместо image, так как он генерирует треугольную сетку. Чтобы избежать расширения графика surface в z-направлении и тем самым нарушения порядка отрисовки, рекомендуется передавать данные о цвете через атрибут color и использовать матрицу нулей для z-данных. В качестве замены heatmap можно использовать voronoiplot, который генерирует ячейки произвольной формы вокруг заданных точек. Здесь вам придется задать rlims!(ax, rmax) самостоятельно.
using CairoMakie
f = Figure(size = (800, 500))

ax = PolarAxis(f[1, 1], title = "Surface")
rs = 0:10
phis = range(0, 2pi, 37)
cs = [r+cos(4phi) for phi in phis, r in rs]
p = surface!(ax, 0..2pi, 0..10, zeros(size(cs)), color = cs, shading = NoShading, colormap = :coolwarm)
ax.gridz[] = 100
tightlimits!(ax) # графики поверхности включают заполнение по умолчанию
Colorbar(f[2, 1], p, vertical = false, flipaxis = false)

ax = PolarAxis(f[1, 2], title = "Voronoi")
rs = 1:10
phis = range(0, 2pi, 37)[1:36]
cs = [r+cos(4phi) for phi in phis, r in rs]
p = voronoiplot!(ax, phis, rs, cs, show_generators = false, strokewidth = 0)
rlims!(ax, 0.0, 10.5)
Colorbar(f[2, 2], p, vertical = false, flipaxis = false)

f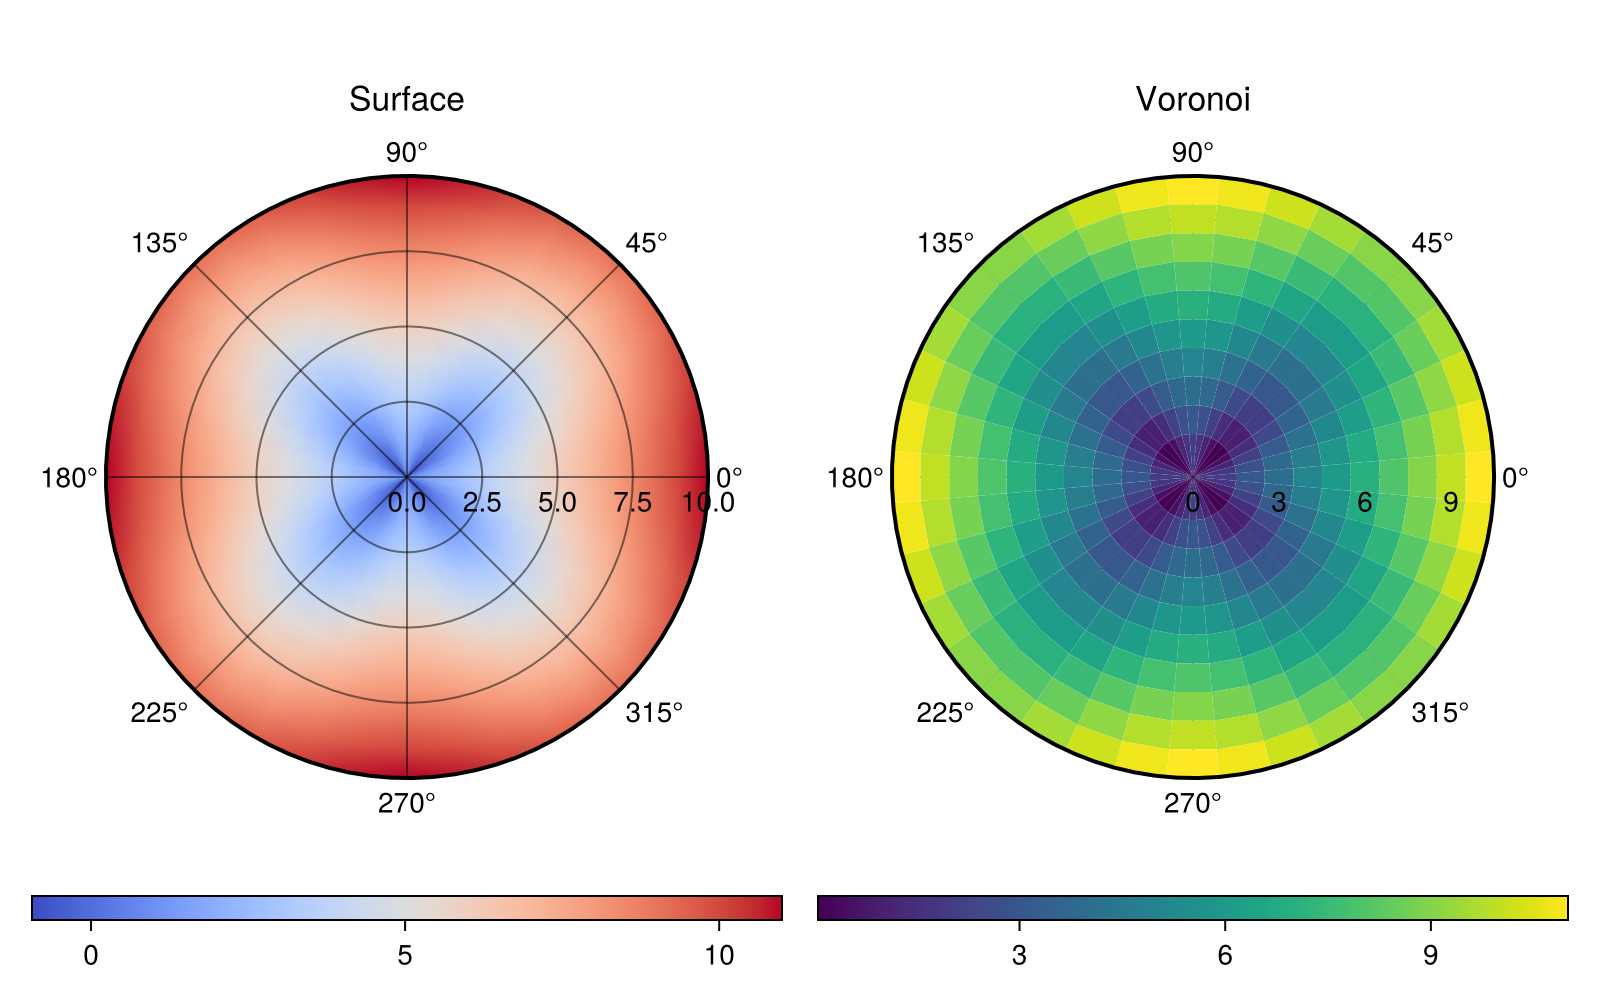
Обратите внимание, что для того, чтобы увидеть сетку, нужно настроить ее глубину с помощью ax.gridz[] = 100 (большее значение z означает меньшую глубину). Жесткие ограничения для ax.gridz составляют (-10_000, 10_000), а 9000 представляет собой мягкое ограничение, при котором упорядочение компонентов оси может быть неправильным.
Скрытие линий и дополнительных элементов
Для PolarAxis внешнее кольцо, ограничивающее область построения, интерпретируется как линия оси. Работа с ней осуществляется с помощью атрибутов spine....
using CairoMakie
f = Figure(size = (800, 400))
ax1 = PolarAxis(f[1, 1], title = "No spine", spinevisible = false)
scatterlines!(ax1, range(0, 1, length=100), range(0, 10pi, length=100), color = 1:100)

ax2 = PolarAxis(f[1, 2], title = "Modified spine")
ax2.spinecolor[] = :red
ax2.spinestyle[] = :dash
ax2.spinewidth[] = 5
scatterlines!(ax2, range(0, 1, length=100), range(0, 10pi, length=100), color = 1:100)

f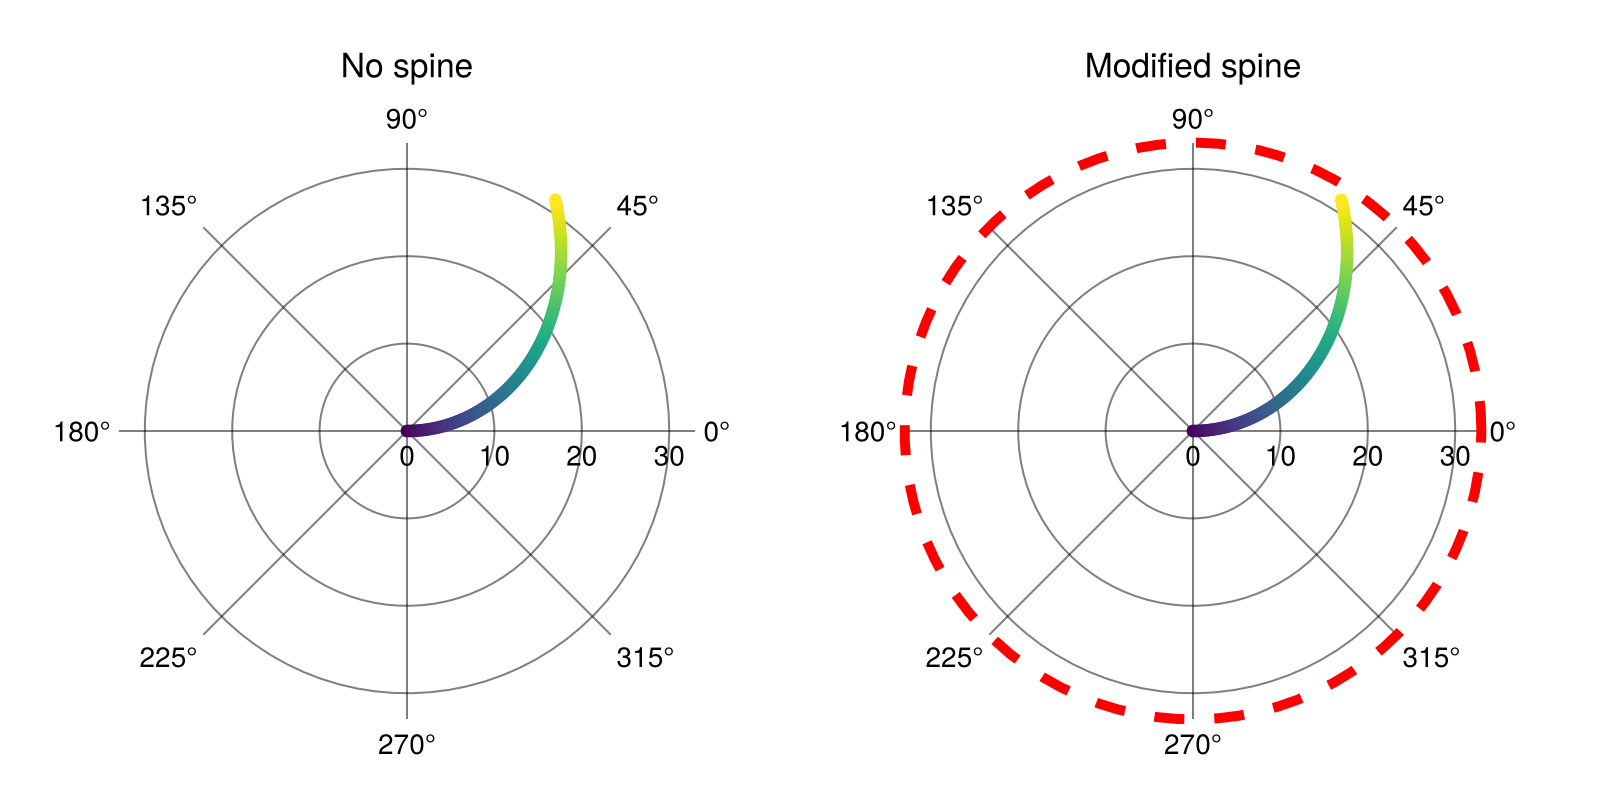
И с помощью атрибутов можно также настроить дополнительные элементы, такие как линии сетки и метки делений.
using CairoMakie
f = Figure(size = (600, 600), backgroundcolor = :black)
ax = PolarAxis(
    f[1, 1],
    backgroundcolor = :black,
    # вспомогательная r-сетка
    rminorgridvisible = true, rminorgridcolor = :red,
    rminorgridwidth = 1.0, rminorgridstyle = :dash,
    # вспомогательная тета-сетка
    thetaminorgridvisible = true, thetaminorgridcolor = :lightblue,
    thetaminorgridwidth = 1.0, thetaminorgridstyle = :dash,
    # основная сетка
    rgridwidth = 2, rgridcolor = :red,
    thetagridwidth = 2, thetagridcolor = :lightblue,
    # r-метки
    rticklabelsize = 18, rticklabelcolor = :red,
    rticklabelstrokewidth = 1.0, rticklabelstrokecolor = :white,
    # тета-метки
    thetaticklabelsize = 18, thetaticklabelcolor = :lightblue
)

f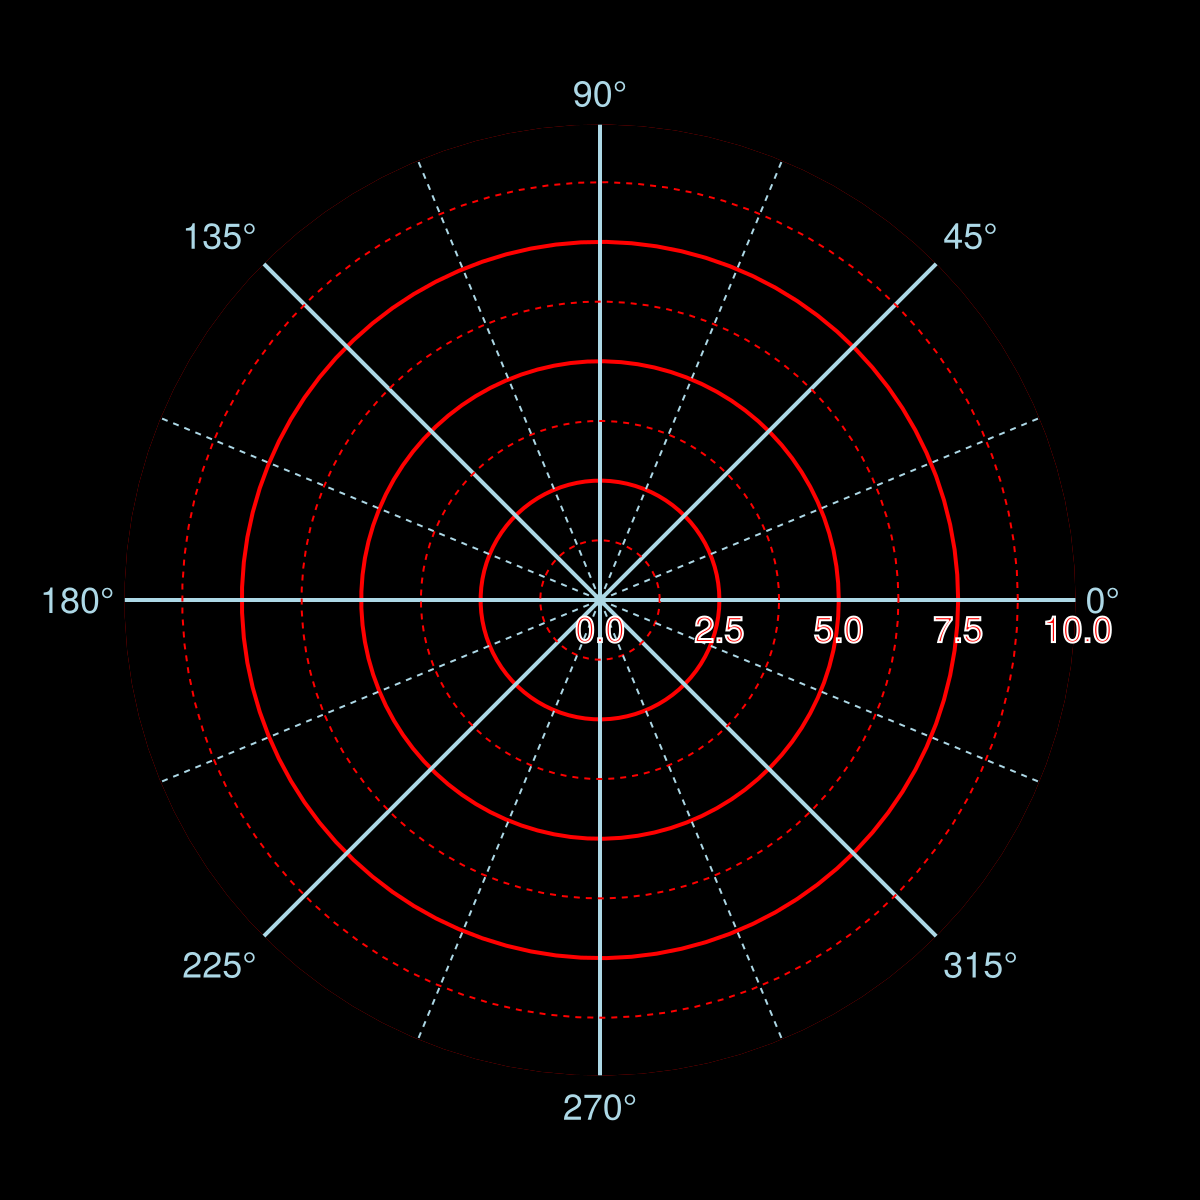
Также можно скрыть созданные линии с помощью hidespines!(ax). Чтобы скрыть метки делений, сетку и (или) вспомогательную сетку, используйте hidedecorations!, hiderdecorations и hidethetadecorations!.
using CairoMakie
fig = Figure()
fullaxis(figpos, title) = PolarAxis(figpos;
                                    title,
                                    thetaminorgridvisible=true,
                                    rminorgridvisible=true,
                                    rticklabelrotation=deg2rad(-90),
                                    rticklabelsize=12,
                                    )
ax1 = fullaxis(fig[1, 1][1, 1], "all decorations")
ax2 = fullaxis(fig[1, 1][1, 2], "hide spine")
hidespines!(ax2)
ax3 = fullaxis(fig[2, 1][1, 1], "hide r decorations")
hiderdecorations!(ax3)
ax4 = fullaxis(fig[2, 1][1, 2], "hide theta decorations")
hidethetadecorations!(ax4)
ax5 = fullaxis(fig[2, 1][1, 3], "hide all decorations")
hidedecorations!(ax5)
fig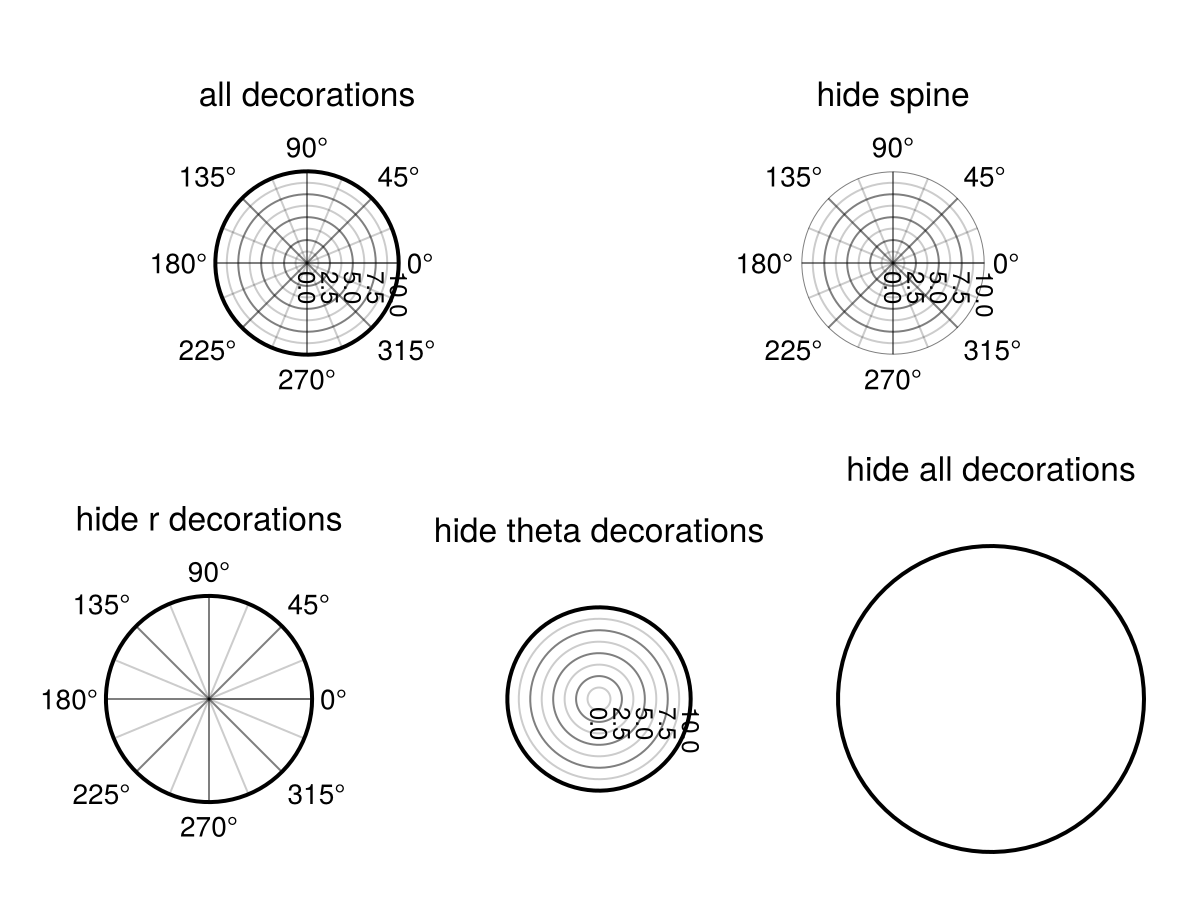
Интерактивность
В настоящее время PolarAxis реализует масштабирование, перемещение и сброс настроек. Масштабирование осуществляется с помощью прокрутки, при этом ax.rzoomkey = Keyboard.r ограничивает масштабирование радиальным направлением, а ax.thetazoomkey = Keyboard.t — угловым. Чтобы заблокировать масштабирование в r-направлении, задайте ax.rzoomlock = true и ax.thetazoomlock = true для тета-направления. Кроме того, вы можете отключить масштабирование от изменения только rmin с помощью ax.fixrmin = true и настроить его скорость с помощью ax.zoomspeed = 0.1.
Перемещения осуществляются с помощью перетаскивания при нажатии кнопки мыши. По умолчанию радиальные перемещения используют ax.r_translation_button = Mouse.right, а угловые — ax.theta_translation_button = Mouse.right. Если ax.fixrmin = true, перемещение в r-направлении запрещено. Чтобы отключить одно из этих взаимодействий, задайте false для соответствующей кнопки.
Кроме того, можно поворачивать всю ось с помощью ax.axis_rotation_button = Keyboard.left_control & Mouse.right и сбрасывать представление оси с помощью ax.reset_button = Keyboard.left_control & Mouse.left для соответствующей оси (Axis). С помощью ax.reset_axis_orientation = false можно настроить, следует ли сбрасывать поворот оси.
Обратите внимание, что PolarAxis сейчас не реализует интерфейс взаимодействия, используемый Axis.
Другие примечания
Построение графиков вне PolarAxis
В настоящее время за пределами области PolarAxis есть два полигональных графика, которые обрезают содержимое до нужной области. Чтобы выполнять построение вне отсечения, ограничивающего полярную ось, но при этом в пределах области сцены, нужно преобразовать эти графики в z-диапазон между 9000 и 10_000 или отключить обрезку с помощью атрибута clip.
Для справки: значения z, используемые PolarAxis, равны po.griddepth[] = 8999 для линий сетки, 9000 для многоугольников обрезки, 9001 для линий оси и 9002 для меток делений.
Радиальное смещение
После построения графика со значением rlimits, далеким от 0, у вас будет много пустого пространства в PolarAxis. Рассмотрим пример:
using CairoMakie
fig = Figure()
ax = PolarAxis(fig[1, 1], thetalimits = (0, pi))
lines!(ax, range(0, pi, length=100), 10 .+ sin.(0.3 .* (1:100)))
fig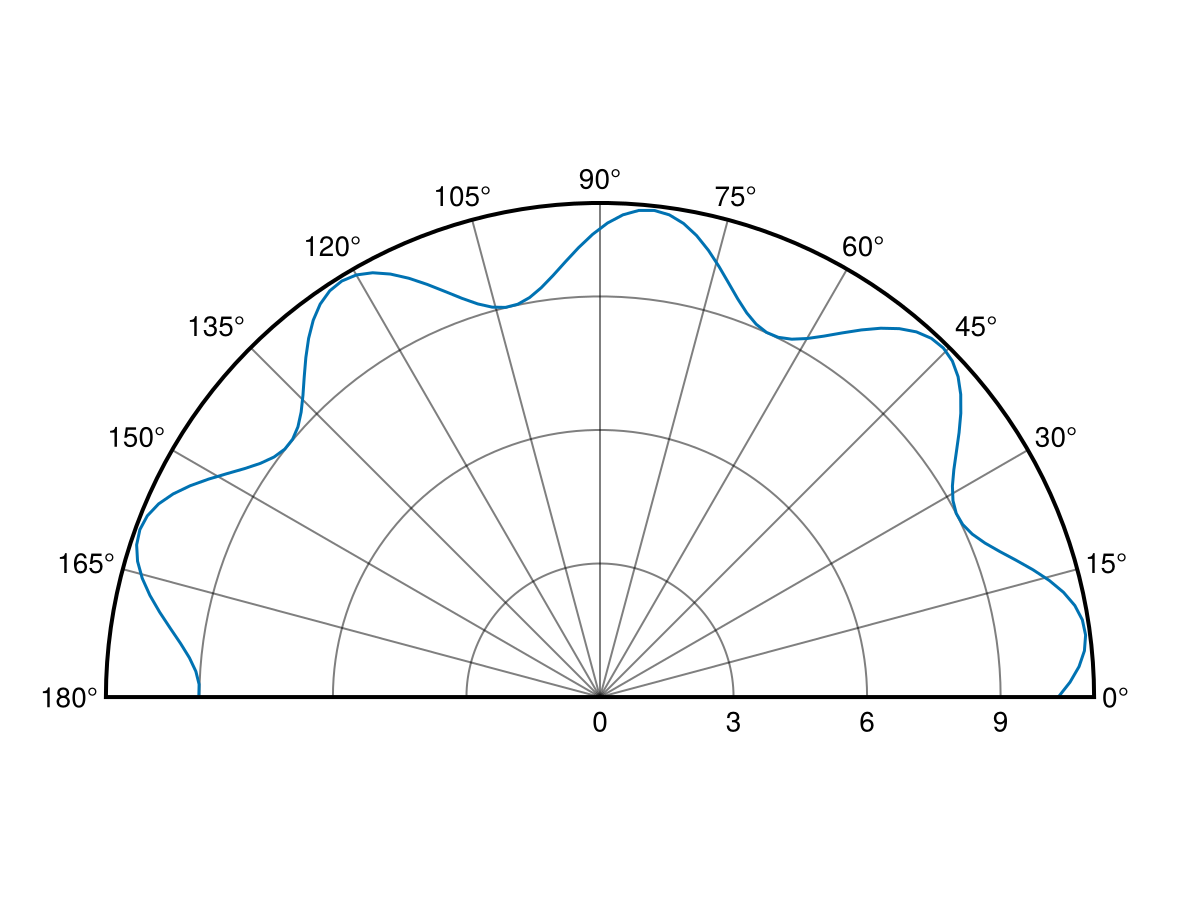
В данном случае вы можете сместить r-направление, чтобы отображалось больше данных. Поэтому нужно задать ax.radius_at_origin для преобразования радиуса r_out = r_in - radius_at_origin.
using CairoMakie
fig = Figure()
ax = PolarAxis(fig[1, 1], thetalimits = (0, pi), radius_at_origin = 8)
lines!(ax, range(0, pi, length=100), 10 .+ sin.(0.3 .* (1:100)))
fig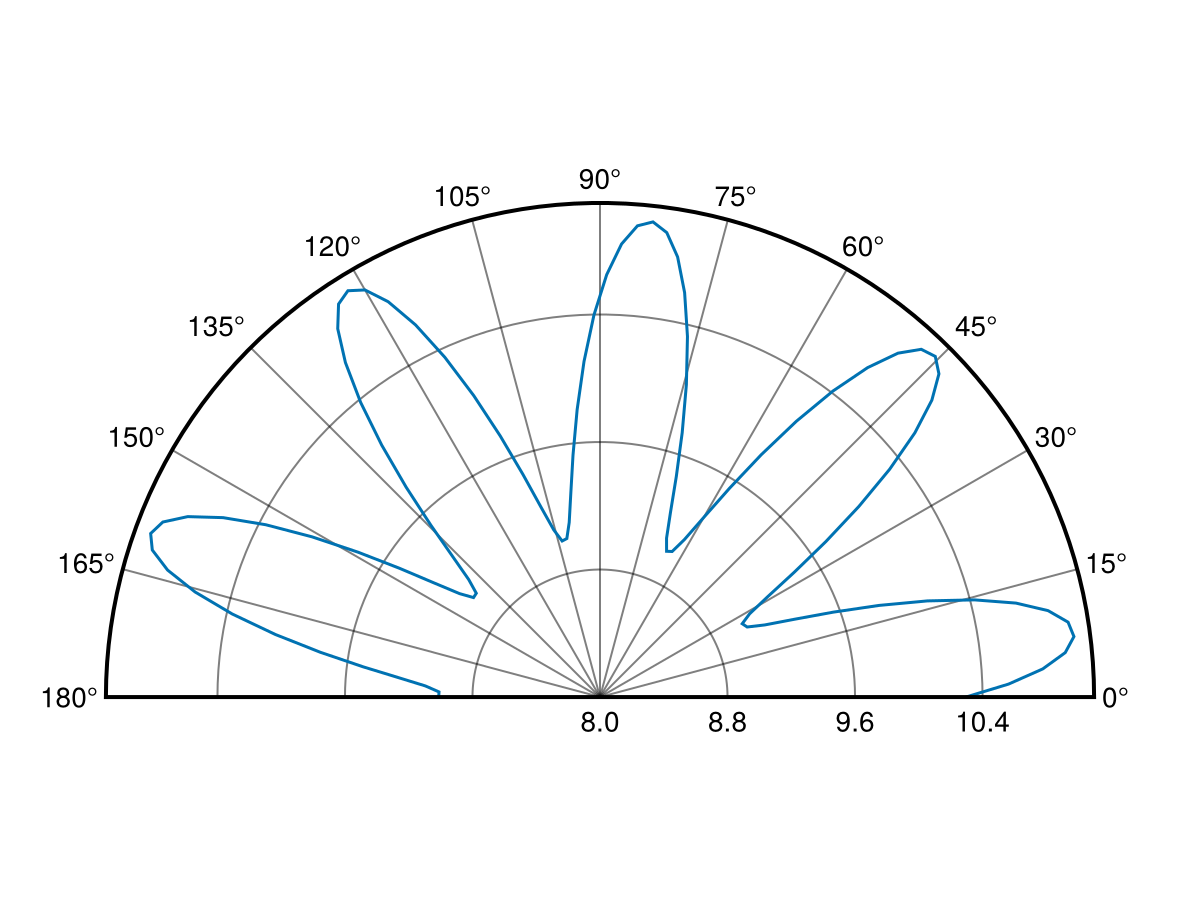
using CairoMakie
fig = Figure()
ax = PolarAxis(fig[1, 1], thetalimits = (0, pi), radius_at_origin = -12)
lines!(ax, range(0, pi, length=100), sin.(0.3 .* (1:100)) .- 10)
fig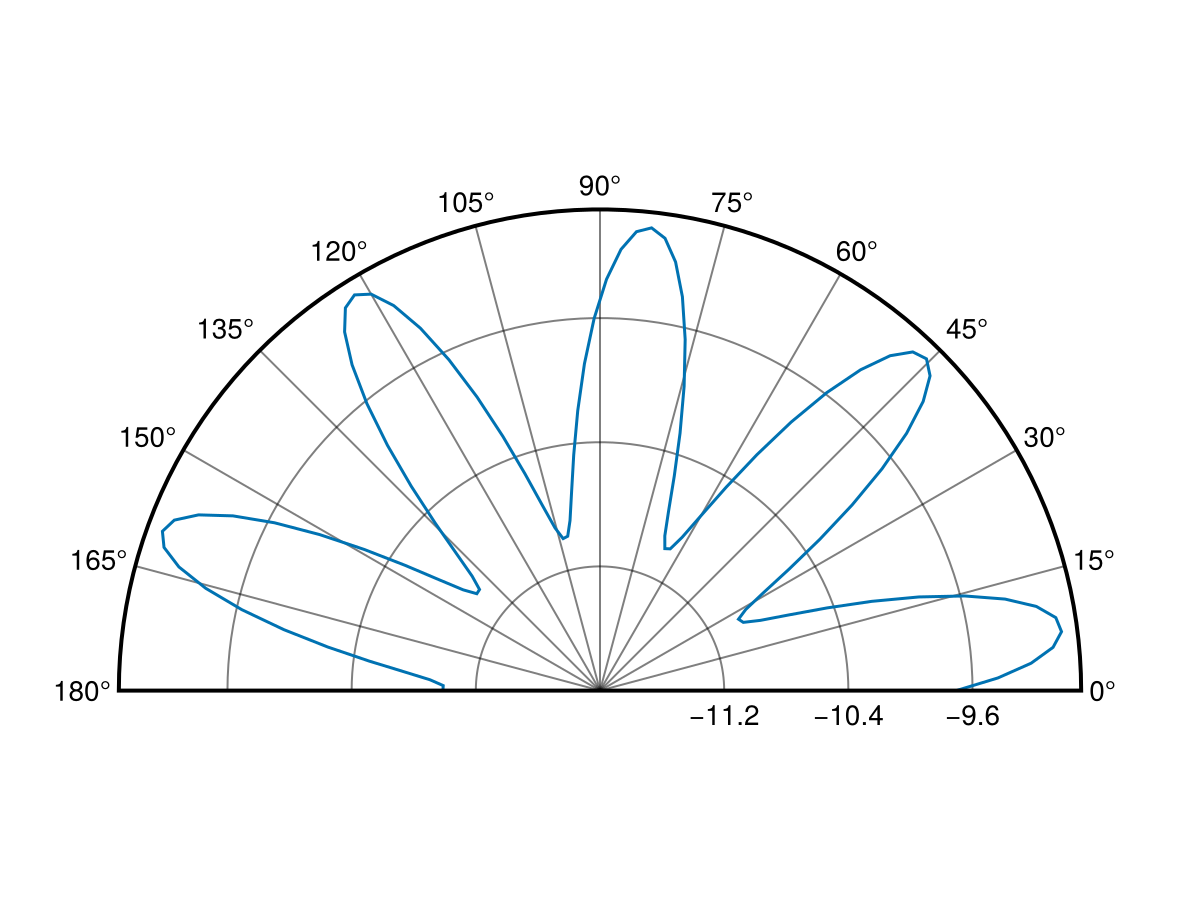
using CairoMakie
phis = range(pi/4, 9pi/4, length=201)
rs = 1.0 ./ sin.(range(pi/4, 3pi/4, length=51)[1:end-1])
rs = vcat(rs, rs, rs, rs, rs[1])

fig = Figure(size = (900, 300))
ax1 = PolarAxis(fig[1, 1], radius_at_origin = -2,  title = "radius_at_origin = -2")
ax2 = PolarAxis(fig[1, 2], radius_at_origin = 0,   title = "radius_at_origin = 0")
ax3 = PolarAxis(fig[1, 3], radius_at_origin = 0.5, title = "radius_at_origin = 0.5")
for ax in (ax1, ax2, ax3)
    lines!(ax, phis, rs .- 2, color = :red, linewidth = 4)
    lines!(ax, phis, rs, color = :black, linewidth = 4)
    lines!(ax, phis, rs .+ 0.5, color = :blue, linewidth = 4)
end
fig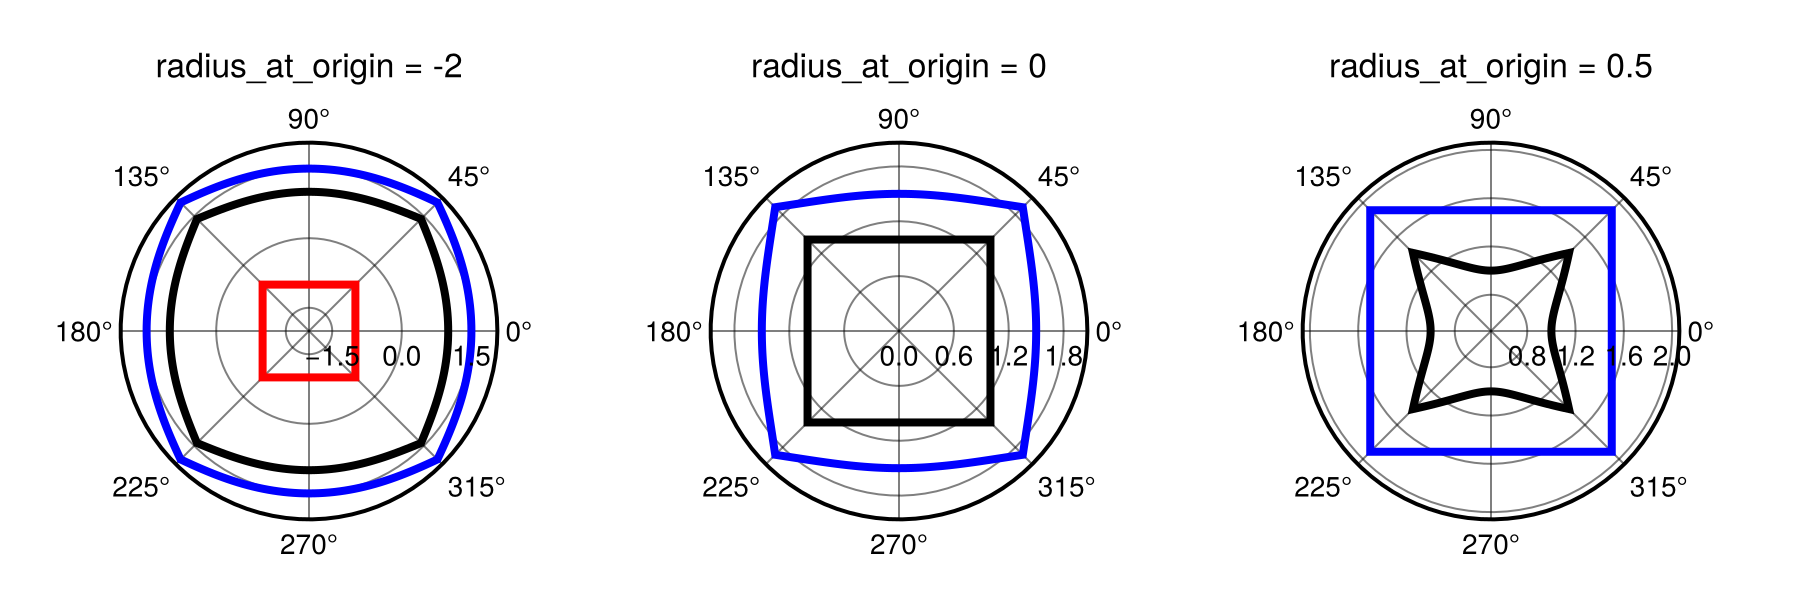
Радиальное отсечение
По умолчанию радиусы r_out = r_in - radius_at_origin < 0 обрезаются полярным преобразованием. Эту возможность можно отключить с помощью ax.clip_r = false. Так r_out < 0 пройдет через полярное преобразование как есть, и в результате будет получена координата в точке .
using CairoMakie
fig = Figure(size = (600, 300))
ax1 = PolarAxis(fig[1, 1], radius_at_origin = 0.0, clip_r = true, title = "clip_r = true")
ax2 = PolarAxis(fig[1, 2], radius_at_origin = 0.0, clip_r = false, title = "clip_r = false")
for ax in (ax1, ax2)
    lines!(ax, 0..2pi, phi -> cos(2phi) - 0.5, color = :red, linewidth = 4)
    lines!(ax, 0..2pi, phi -> sin(2phi), color = :black, linewidth = 4)
end
fig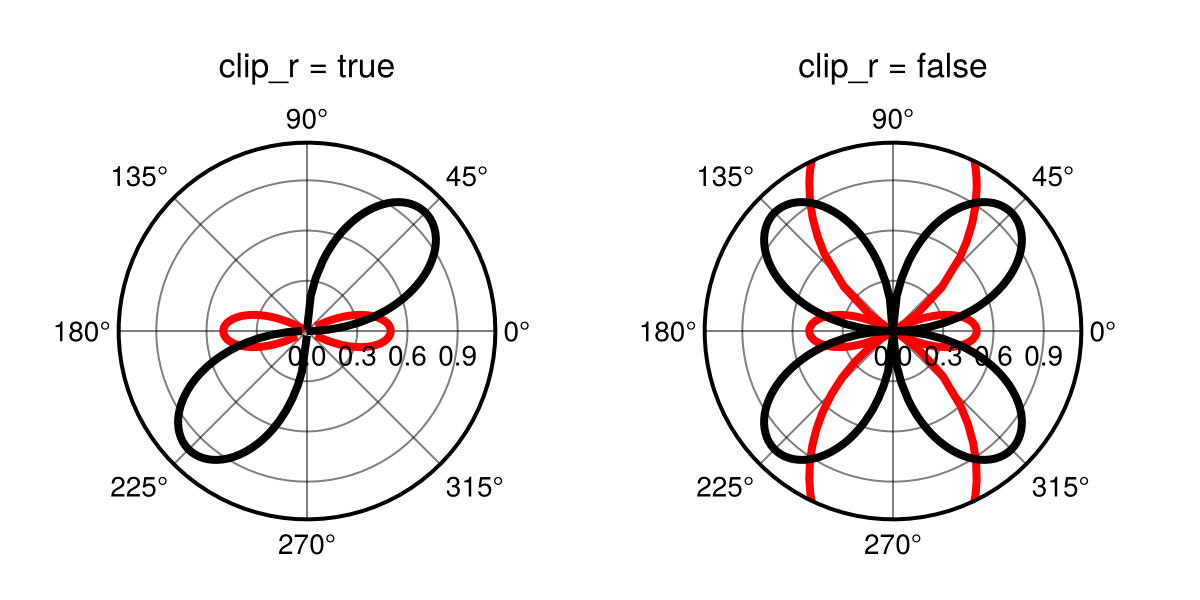
Атрибуты
axis_rotation_button
Значение по умолчанию: Keyboard.left_control & Mouse.right
Устанавливает кнопку для поворота поляроаксиса в целом. Это заменяет тета-трансляцию при запуске и должно включать в себя нажатие кнопки мыши.
clip
Значение по умолчанию: true
Определяет, следует ли активировать функцию нелинейного клипа. Обратите внимание, что это не следует использовать, когда фон в конечном счете прозрачен.
clip_r
Значение по умолчанию: true
Определяет, будет ли r < 0 (после применения radius_at_origin) обрезано (true) или нет (false).
clipcolor
Значение по умолчанию: automatic
Задает цвет многоугольника клипа. В основном для целей отладки.
direction
Значение по умолчанию: 1
Направление вращения. Может быть равно -1 (по часовой стрелке) или 1 (против часовой стрелки).
fixrmin
Значение по умолчанию: true
Определяет, остается ли значение rmin фиксированным во время масштабирования и перевода. (Последнее будет отключено, если установить для этого параметра значение true.)
gridz
Значение по умолчанию: -100
Задает значение z для линий сетки. Чтобы разместить сетку над графиками, установите это значение в диапазоне от 1 до 8999.
halign
Значение по умолчанию: :center
Горизонтальное выравнивание сцены в предполагаемой ограничивающей рамке.
normalize_theta_ticks
Значение по умолчанию: true
Определяет, будут ли отображаемые тета-тики нормализованы к диапазону от -2 до 2 пикселей на дюйм. Если нет, то в качестве этого диапазона будут показаны пределы, такие как (2 на дюйм, 4 на дюйм).
r_translation_button
Значение по умолчанию: Mouse.right
Устанавливает кнопку мыши для перемещения графика в направлении r.
radius_at_origin
Значение по умолчанию: automatic
Устанавливает радиус в начале полярной оси таким образом, что r_out = r_in - radius_at_origin. Может быть установлено в automatic , чтобы соответствовать rmin. Обратите внимание, что это повлияет на форму отображаемых объектов.
rautolimitmargin
Значение по умолчанию: (0.05, 0.05)
Относительные границы, добавленные к автоматическим ограничениям в направлении r.
reset_axis_orientation
Значение по умолчанию: false
Определяет, будет ли сброшена ориентация оси (измененная с помощью кнопки axis_rotation_button) при сбросе оси. Если установлено значение false, будут сброшены только ограничения.
reset_button
Значение по умолчанию: Keyboard.left_control & Mouse.left
Задает кнопку или комбинацию кнопок для сброса вида оси. (Это должно быть совместимо с ispressed.)
rgridcolor
Значение по умолчанию: inherit(scene, (:Axis, :xgridcolor), (:black, 0.5))
Цвет самого r сетка.
rgridstyle
Значение по умолчанию: inherit(scene, (:Axis, :xgridstyle), nothing)
Линейный стиль этого r сетка.
rgridvisible
Значение по умолчанию: inherit(scene, (:Axis, :xgridvisible), true)
Определяет, видна ли сетка r .
rminorgridcolor
Значение по умолчанию: inherit(scene, (:Axis, :xminorgridcolor), (:black, 0.2))
Цвет r мелкие сетки.
rminorgridstyle
Значение по умолчанию: inherit(scene, (:Axis, :xminorgridstyle), nothing)
Линейный стиль r второстепенной сетки.
rminorgridvisible
Значение по умолчанию: inherit(scene, (:Axis, :xminorgridvisible), false)
Определяет, видна ли второстепенная сетка r .
rminorgridwidth
Значение по умолчанию: inherit(scene, (:Axis, :xminorgridwidth), 1)
Ширина линии r второстепенной сетки.
rminorticksvisible
Значение по умолчанию: false
Определяет, видны ли незначительные отметки на оси r
rtickalign
Значение по умолчанию: 0.0
Выравнивание меток rtick относительно корешка оси (0 = наружу, 1 = внутрь).
rticklabelcolor
Значение по умолчанию: inherit(scene, (:Axis, :xticklabelcolor), inherit(scene, :textcolor, :black))
Цвет самого r отмечайте ярлыки галочками.
rticklabelfont
Значение по умолчанию: inherit(scene, (:Axis, :xticklabelfont), inherit(scene, :font, Makie.defaultfont()))
Шрифт меток r отмечать галочками.
rticklabelrotation
Значение по умолчанию: automatic
Устанавливает вращение r отмечайте ярлыки галочками.
Опции:
-
:radialповорачивает надписи в зависимости от угла, под которым они отображаются -
:horizontalсохраняет горизонтальную ориентацию надписей -
:alignedповорачивает надписи в зависимости от угла, под которым они отображаются, но сохраняет их вертикальными и близкими к горизонтали -
automaticиспользует:horizontalкогда диапазон тета-пределов >1,9pi и:alignedиначе -
::Realустанавливает поворот надписи на определенное значение
rticklabelsize
Значение по умолчанию: inherit(scene, (:Axis, :yticklabelsize), inherit(scene, :fontsize, 16))
Свойство FontSize из r метки.
rticklabelstrokecolor
Значение по умолчанию: automatic
Цвет контура r помечается галочками. По умолчанию используется цвет фона.
rticklabelstrokewidth
Значение по умолчанию: 0.0
Ширина контура равна r отметкам. Установка значения 0 приведет к удалению контура.
rticklabelsvisible
Значение по умолчанию: inherit(scene, (:Axis, :xticklabelsvisible), true)
Определяет, видны ли галочки r .
rticks
Значение по умолчанию: LinearTicks(4)
Спецификатор для радиальных (r) отметок, аналогичный xticks для нормальной оси.
rticksmirrored
Значение по умолчанию: false
Если установлено значение true и тета-диапазон меньше 2pi, то r-метки отражаются в другую сторону по полярной оси.
rzoomkey
Значение по умолчанию: Keyboard.r
Устанавливает клавишу, используемую для ограничения масштабирования в направлении r. Может быть установлено значение true , чтобы всегда ограничивать масштабирование или false чтобы отключить взаимодействие.
rzoomlock
Значение по умолчанию: false
Определяет, заблокирована ли настройка rлимитов с помощью интерактивного масштабирования.
sample_density
Значение по умолчанию: 90
Плотность, с которой отбираются кривые линии. (линии сетки, корешковые линии, клип)
tellheight
Значение по умолчанию: true
Определяет, может ли родительский макет подстраиваться под высоту этого элемента
tellwidth
Значение по умолчанию: true
Определяет, может ли родительский макет подстраиваться под ширину этого элемента
theta_0
Значение по умолчанию: 0.0
Угловое смещение (1, 0) по полярной оси. При этом ось поворачивается.
theta_as_x
Значение по умолчанию: true
Управляет порядком аргументов полярного преобразования. Если theta_as_x = true это (θ, r), в противном случае (r, θ).
theta_translation_button
Значение по умолчанию: Mouse.right
Устанавливает кнопку мыши для перемещения графика в тета-направлении. Обратите внимание, что это может быть то же самое, что radial_translation_button.
thetaautolimitmargin
Значение по умолчанию: (0.05, 0.05)
Относительные границы добавляются к автолимитам в направлении тета.
thetagridcolor
Значение по умолчанию: inherit(scene, (:Axis, :ygridcolor), (:black, 0.5))
Цвет самого theta сетка.
thetagridstyle
Значение по умолчанию: inherit(scene, (:Axis, :ygridstyle), nothing)
Линейный стиль этого theta сетка.
thetagridvisible
Значение по умолчанию: inherit(scene, (:Axis, :ygridvisible), true)
Определяет, видна ли сетка theta .
thetagridwidth
Значение по умолчанию: inherit(scene, (:Axis, :ygridwidth), 1)
Ширина линии theta сетка.
thetalimits
Значение по умолчанию: (0.0, 2pi)
Угловые границы поляроаксиса. (0,0, 2 дюйма на дюйм) отображает полный круг. (ничего, ничего) отображает границы, выбранные на основе границ графика.
thetaminorgridcolor
Значение по умолчанию: inherit(scene, (:Axis, :yminorgridcolor), (:black, 0.2))
Цвет theta мелкие сетки.
thetaminorgridstyle
Значение по умолчанию: inherit(scene, (:Axis, :yminorgridstyle), nothing)
Линейный стиль theta второстепенной сетки.
thetaminorgridvisible
Значение по умолчанию: inherit(scene, (:Axis, :yminorgridvisible), false)
Определяет, видна ли второстепенная сетка theta .
thetaminorgridwidth
Значение по умолчанию: inherit(scene, (:Axis, :yminorgridwidth), 1)
Ширина линии theta второстепенной сетки.
thetaminorticks
Значение по умолчанию: IntervalsBetween(2)
Определитель для второстепенных theta отметок.
thetaminorticksvisible
Значение по умолчанию: false
Определяет, видны ли незначительные тики на оси тета
thetatickalign
Значение по умолчанию: 0.0
Выравнивание тета-точек относительно оси позвоночника (0 = наружу, 1 = внутрь).
thetaticklabelcolor
Значение по умолчанию: inherit(scene, (:Axis, :yticklabelcolor), inherit(scene, :textcolor, :black))
Цвет самого theta отмечайте ярлыки галочками.
thetaticklabelfont
Значение по умолчанию: inherit(scene, (:Axis, :yticklabelfont), inherit(scene, :font, Makie.defaultfont()))
Шрифт меток theta отмечать галочками.
thetaticklabelsize
Значение по умолчанию: inherit(scene, (:Axis, :xticklabelsize), inherit(scene, :fontsize, 16))
Свойство FontSize из theta метки.
thetaticklabelstrokecolor
Значение по умолчанию: automatic
Цвет контура theta помечается галочками. По умолчанию используется цвет фона.
thetaticklabelstrokewidth
Значение по умолчанию: 0.0
Ширина контура равна theta отметкам. Установка значения 0 приведет к удалению контура.
thetaticklabelsvisible
Значение по умолчанию: inherit(scene, (:Axis, :yticklabelsvisible), true)
Определяет, видны ли галочки theta .
thetaticks
Значение по умолчанию: AngularTicks(180 / pi, "°")
Спецификатор для угловых (theta) отметок, аналогичный yticks для нормальной оси.
thetaticksmirrored
Значение по умолчанию: false
Если установлено значение true и rmin > 0, тета-тики отражаются на другой стороне полярной оси.
thetazoomkey
Значение по умолчанию: Keyboard.t
Устанавливает клавишу, используемую для ограничения масштабирования в направлении тета. Может быть установлено значение true для постоянного ограничения масштабирования или false чтобы отключить взаимодействие.
thetazoomlock
Значение по умолчанию: true
Определяет, заблокирована ли настройка предельных значений с помощью интерактивного масштабирования.
titlealign
Значение по умолчанию: :center
Выравнивание заголовка. Может быть любым из :center, :left, или :right.
titlecolor
Значение по умолчанию: inherit(scene, (:Axis, :titlecolor), inherit(scene, :textcolor, :black))
Цвет заголовка.
titlefont
Значение по умолчанию: inherit(scene, (:Axis, :titlefont), inherit(scene, :font, Makie.defaultfont()))
Шрифт заголовка.
titlegap
Можно наследовать(сцена, (:Ось, :размер заголовка), карта((x->начало
x / 2
конец), наследовать(сцена, :размер шрифта, 16)))
Промежуток между заголовком и вершиной оси
titlesize
Можно изменить(сцена, (:ось, :размер заголовка), картаx->начать 1.2x end), наследовать(сцена, :размер шрифта, 16)`
Размер шрифта заголовка.
titlevisible
Значение по умолчанию: inherit(scene, (:Axis, :titlevisible), true)
Определяет, виден ли заголовок.