Условные обозначения
|
Страница в процессе перевода. |
Создание условных обозначений из элементов
Для создания базового блока Legend можно передать вектор записей условных обозначений и вектор меток, а также необязательный заголовок в качестве третьего аргумента.
Элементы в векторе записей условных обозначений могут быть либо объектами графика, либо такими элементами, как LineElement, MarkerElement и PolyElement. Или же они могут быть векторами таких объектов, которые будут наложены друг на друга как единое целое.
Атрибуты элемента условных обозначений
Стандартные объекты графика, такие как Scatter или Lines, имеют предопределенные конвертации в MarkerElement и LineElement, которые копируют соответствующие атрибуты графика в элемент условных обозначений. Если атрибут имеет векторное значение, он возвращается к скалярному значению по умолчанию для условных обозначений. Сами значения условных обозначений по умолчанию наследуются от основной темы. Например, polystrokewidth условных обозначений возвращается к patchstrokewidth основной темы. В следующем примере видно, что условные обозначения для sca2 копируют маркер :rect, но не векторнозначный цвет.
using CairoMakie

f = Figure()

Axis(f[1, 1])

xs = 0:0.5:10
ys = sin.(xs)
lin = lines!(xs, ys, color = :blue)
sca = scatter!(xs, ys, color = :red)
sca2 = scatter!(xs, ys .+ 0.5, color = 1:length(xs), marker = :rect)

Legend(f[1, 2],
    [lin, sca, [lin, sca], sca2],
    ["a line", "some dots", "both together", "rect markers"])

f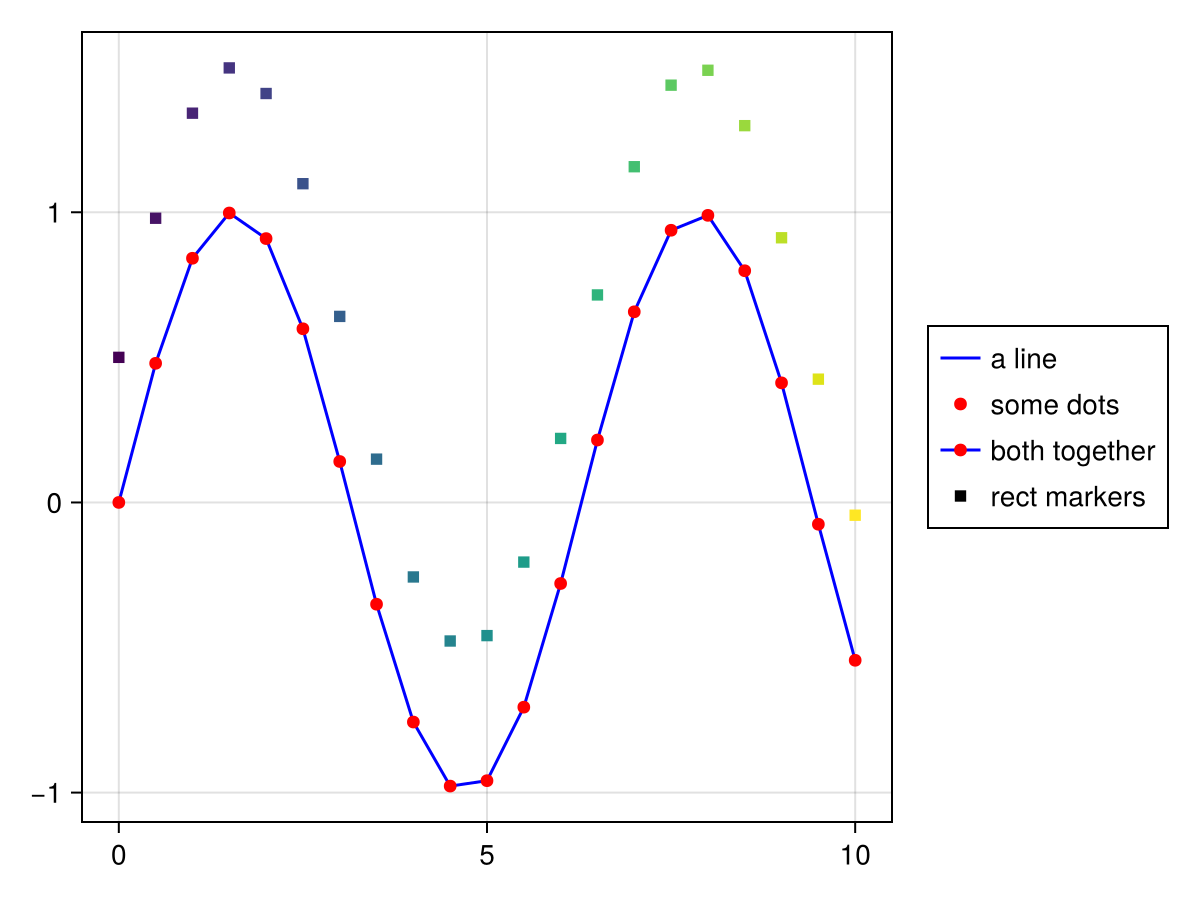
Создание условных обозначений из оси
Можно также создать условные обозначения, передав им объект оси, например Axis, LScene или Scene. Все графики с заданным атрибутом label будут помещены в блок Legend в том порядке, в котором они появляются на оси. В качестве третьего аргумента можно передать заголовок.
using CairoMakie

f = Figure()

ax = f[1, 1] = Axis(f)

lines!(0..15, sin, label = "sin", color = :blue)
lines!(0..15, cos, label = "cos", color = :red)
lines!(0..15, x -> -cos(x), label = "-cos", color = :green)

f[1, 2] = Legend(f, ax, "Trig Functions", framevisible = false)

f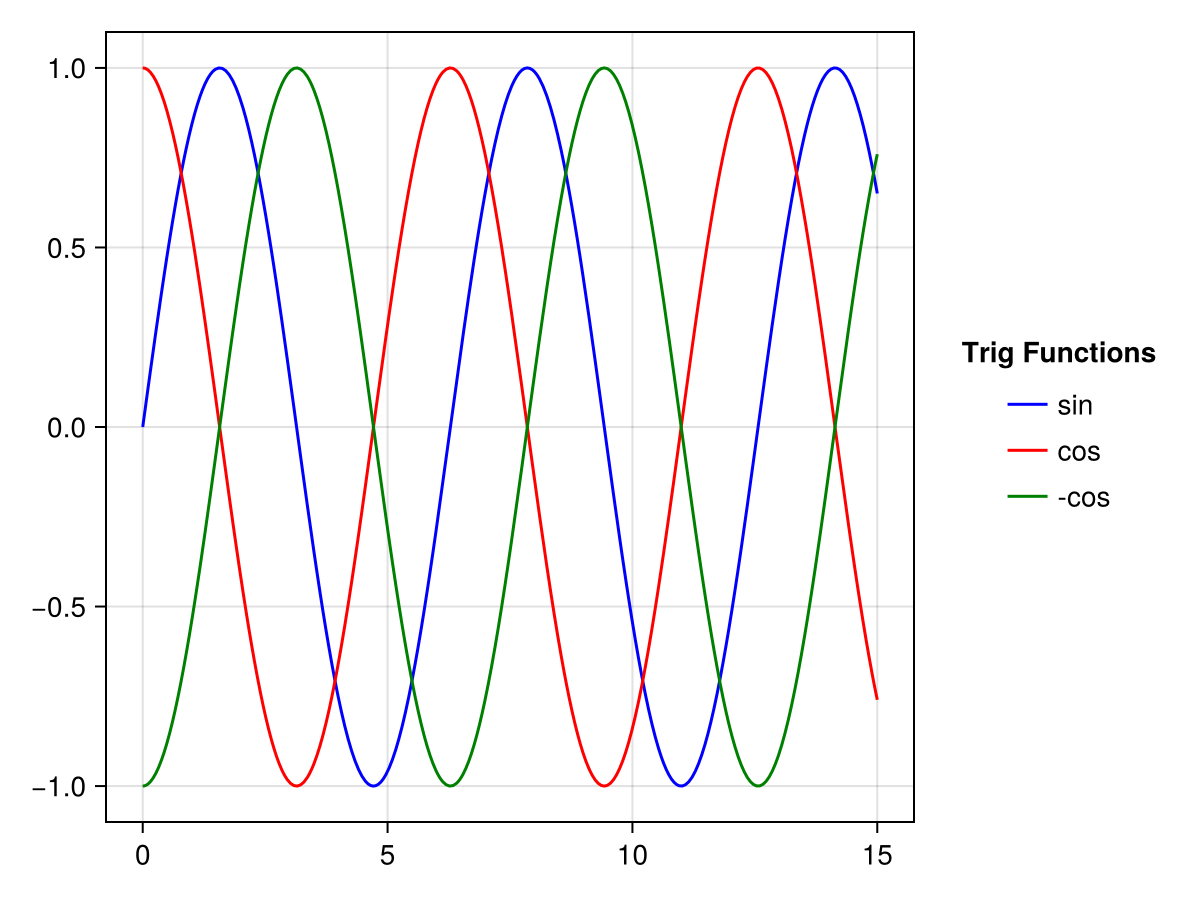
Ключевые слова merge и unique позволяют управлять способами обработки объектов графика с одинаковыми метками. Если merge имеет значение true, все объекты графика с одинаковой меткой будут накладываться друг на друга в одной записи условных обозначений. Если unique имеет значение true, вхождение всех объектов графика с одинаковым типом графика и меткой будет сведено до одного раза.
using CairoMakie

f = Figure()

traces = cumsum(randn(10, 5), dims = 1)

for (i, (merge, unique)) in enumerate(
        Iterators.product([false, true], [false true]))

    axis = Axis(f[fldmod1(i, 2)...],
        title = "merge = $merge, unique = $unique")

    for trace in eachcol(traces)
        lines!(trace, label = "single", color = (:black, 0.2))
    end

    mu = vec(sum(traces, dims = 2) ./ 5)
    lines!(mu, label = "mean")
    scatter!(mu, label = "mean")

    axislegend(axis, merge = merge, unique = unique)

end

f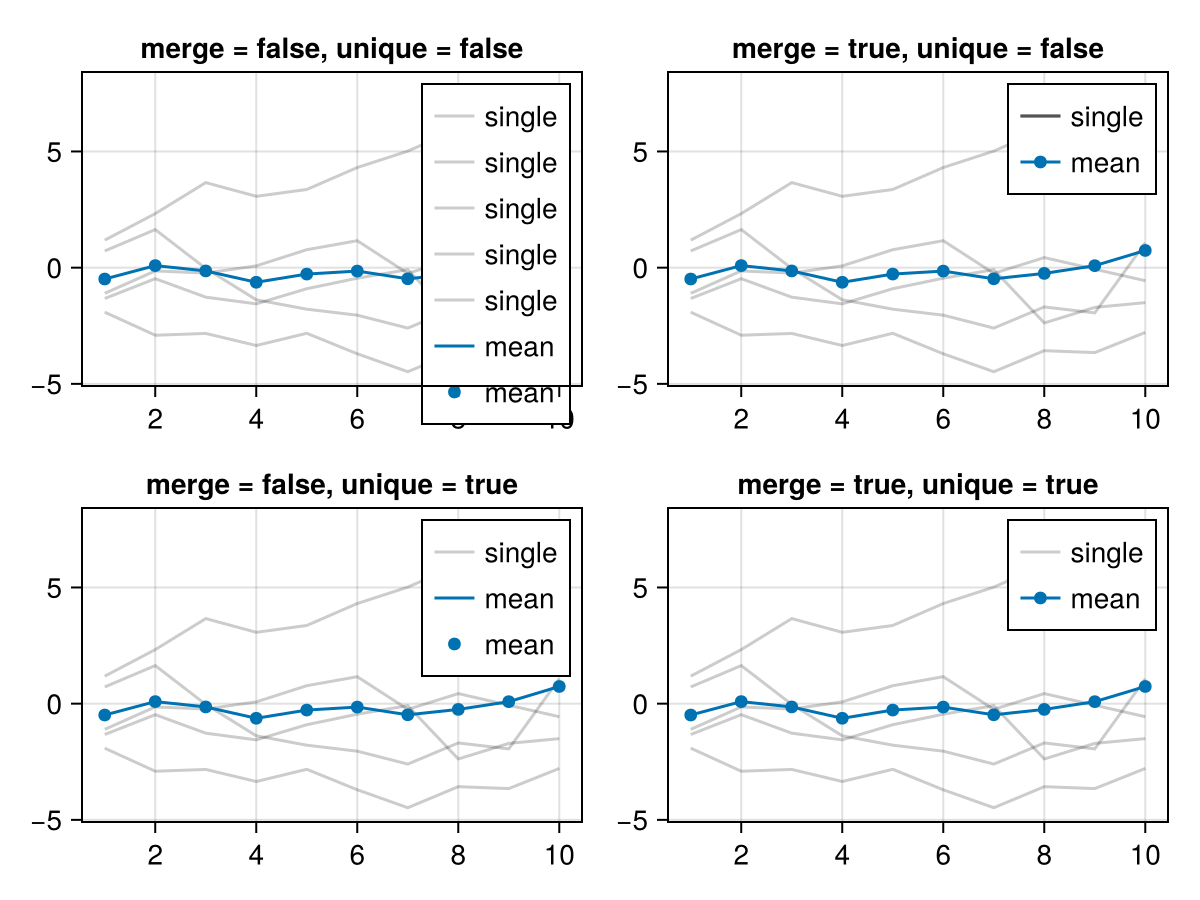
Условные обозначения внутри оси
Быстро добавить условные обозначения к оси можно с помощью функции axislegend. Можно передать выбранную ось вместе с аргументами, которые будут переданы конструктору Legend, или же по умолчанию используется текущая ось. Если передать только строку, она будет использоваться в качестве заголовка с текущей осью.
Позицию можно задать с помощью символа быстрого доступа: сначала halign (l, r, c), затем valign (b, t, c), например :lt для левой, верхней и :cb для нижней центральной части. Или для этого можно использовать кортеж (halign, valign) с элементами от 0 до 1: position = (0.1, 0.9).
using CairoMakie

f = Figure()

ax = Axis(f[1, 1])

sc1 = scatter!(randn(10, 2), color = :red, label = "Red Dots")
sc2 = scatter!(randn(10, 2), color = :blue, label = "Blue Dots")
scatter!(randn(10, 2), color = :orange, label = "Orange Dots")
scatter!(randn(10, 2), color = :cyan, label = "Cyan Dots")

axislegend()

axislegend("Titled Legend", position = :lb)

axislegend(ax, [sc1, sc2], ["One", "Two"], "Selected Dots", position = :rb,
    orientation = :horizontal)

f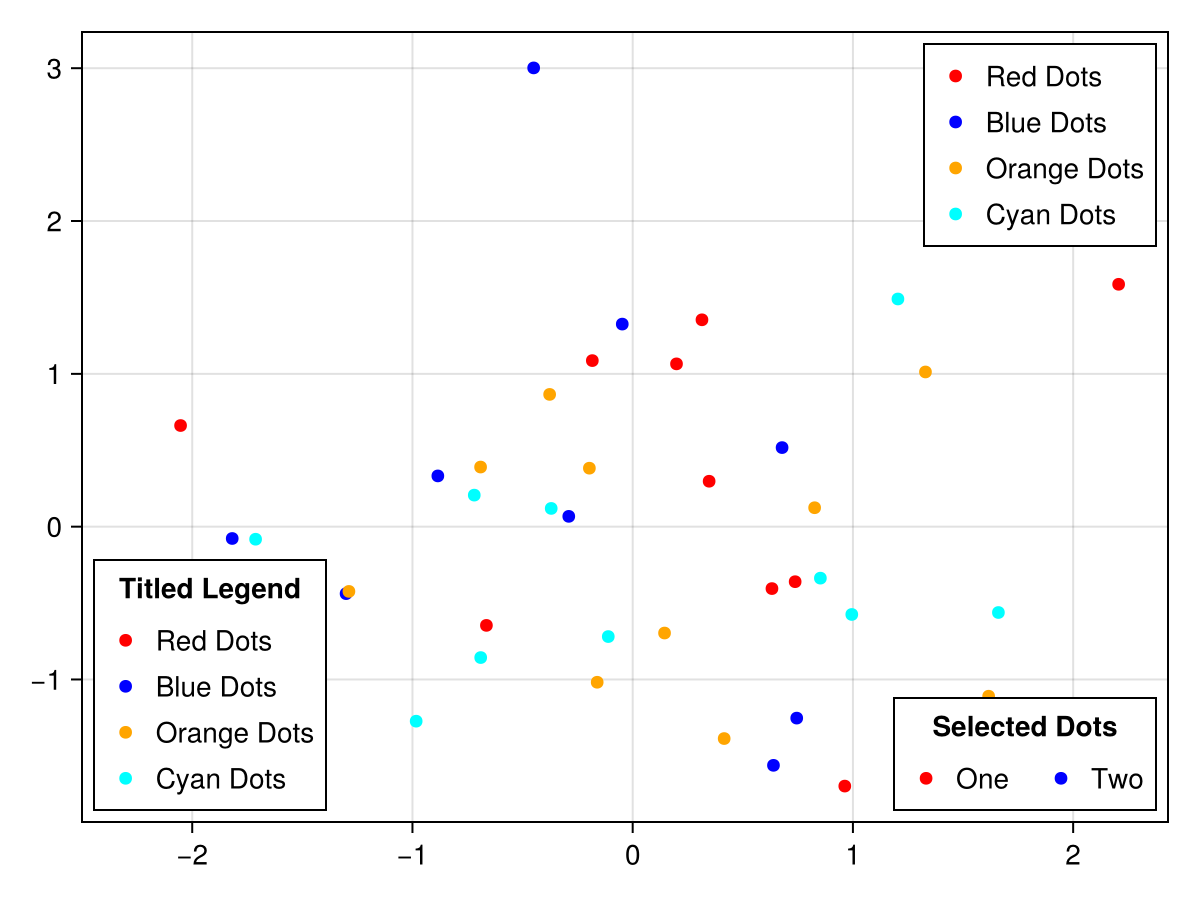
Кроме того, можно просто добавить блок Legend в тот же слот макета, в котором находится ось. Пока ось больше условных обозначений, можно задать параметрам tellheight и tellwidth условных обозначений значение false и разместить их с помощью переменных выравнивания. Чтобы условные обозначения не касались линий осей, используйте ключевое слово margin.
using CairoMakie

haligns = [:left, :right, :center]
valigns = [:top, :bottom, :center]

f = Figure()

Axis(f[1, 1])

xs = 0:0.1:10
lins = [lines!(xs, sin.(xs .* i), color = color)
    for (i, color) in zip(1:3, [:red, :blue, :green])]

for (j, ha, va) in zip(1:3, haligns, valigns)
    Legend(
        f[1, 1], lins, ["Line $i" for i in 1:3],
        "$ha & $va",
        tellheight = false,
        tellwidth = false,
        margin = (10, 10, 10, 10),
        halign = ha, valign = va, orientation = :horizontal
    )
end

f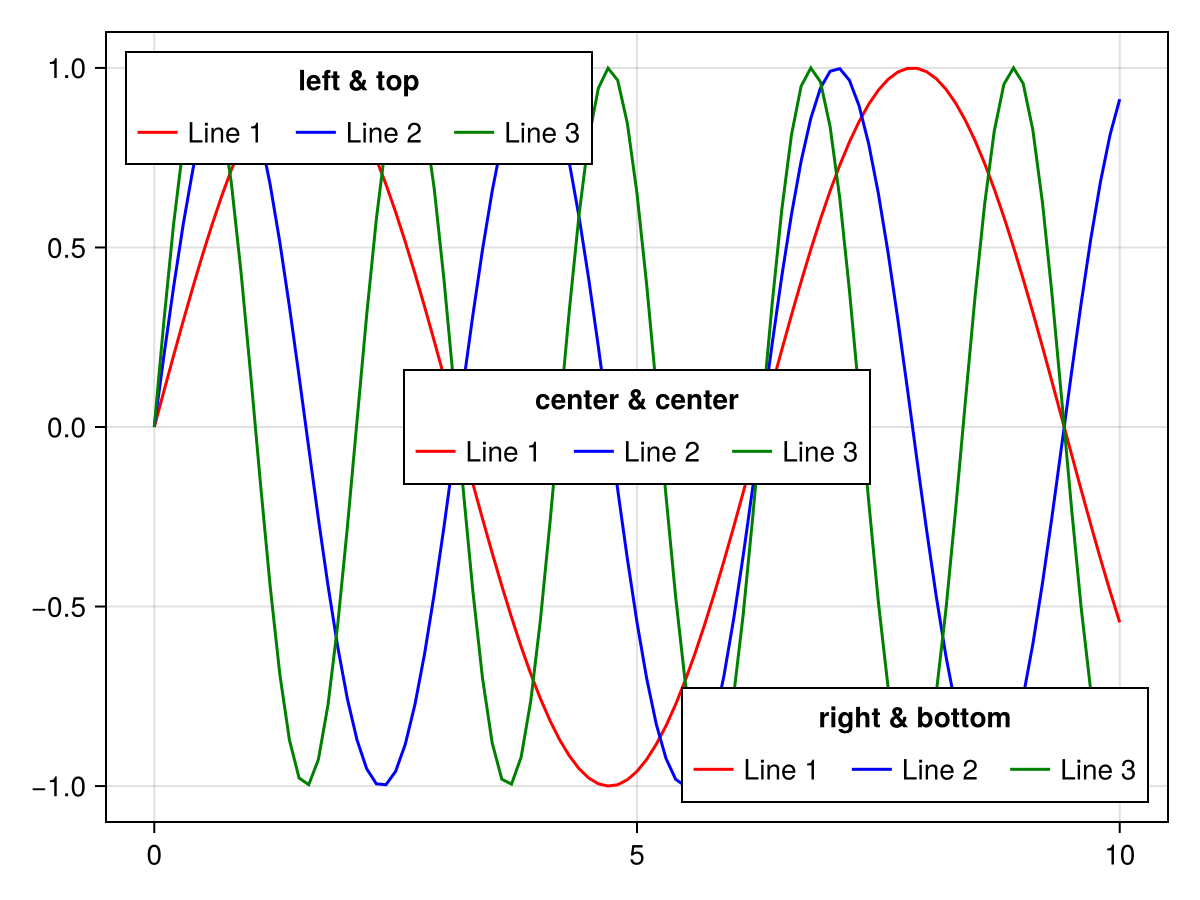
Создание записей условных обозначений вручную
Иногда, чтобы максимально контролировать условные обозначения, необходимо создать их записи с нуля. На данный момент можно использовать LineElement, MarkerElement или PolyElement. Ниже приведены атрибуты для этих элементов (части [] можно не указывать при непосредственном конструировании этих элементов, но они должны быть полностью прописаны для атрибутов, которые содержат условное обозначение).
# LineElement
[line]points, [line]color, linestyle, linewidth

# MarkerElement
[marker]points, marker, markersize, [marker]color,
[marker]strokewidth, [marker]strokecolor

# PolyElement
[poly]points, [poly]color, [poly]strokewidth, [poly]strokecolor
Атрибуты linepoints, markerpoints и polypoints определяют, где в прямоугольнике участка записи условных обозначений будут размещены объекты графика. Эти значения должны быть нормализованы к прямоугольнику 1 на 1, а окончательная форма зависит от значения patchsize условных обозначений. Например, чтобы получить более широкие маркеры линий и многоугольников, задайте patchsize значение (50, 30) в условных обозначениях.
using CairoMakie

f = Figure()

Axis(f[1, 1])

elem_1 = [LineElement(color = :red, linestyle = nothing),
          MarkerElement(color = :blue, marker = 'x', markersize = 15,
          strokecolor = :black)]

elem_2 = [PolyElement(color = :red, strokecolor = :blue, strokewidth = 1),
          LineElement(color = :black, linestyle = :dash)]

elem_3 = LineElement(color = :green, linestyle = nothing,
        points = Point2f[(0, 0), (0, 1), (1, 0), (1, 1)])

elem_4 = MarkerElement(color = :blue, marker = 'π', markersize = 15,
        points = Point2f[(0.2, 0.2), (0.5, 0.8), (0.8, 0.2)])

elem_5 = PolyElement(color = :green, strokecolor = :black, strokewidth = 2,
        points = Point2f[(0, 0), (1, 0), (0, 1)])

Legend(f[1, 2],
    [elem_1, elem_2, elem_3, elem_4, elem_5],
    ["Line & Marker", "Poly & Line", "Line", "Marker", "Poly"],
    patchsize = (35, 35), rowgap = 10)

f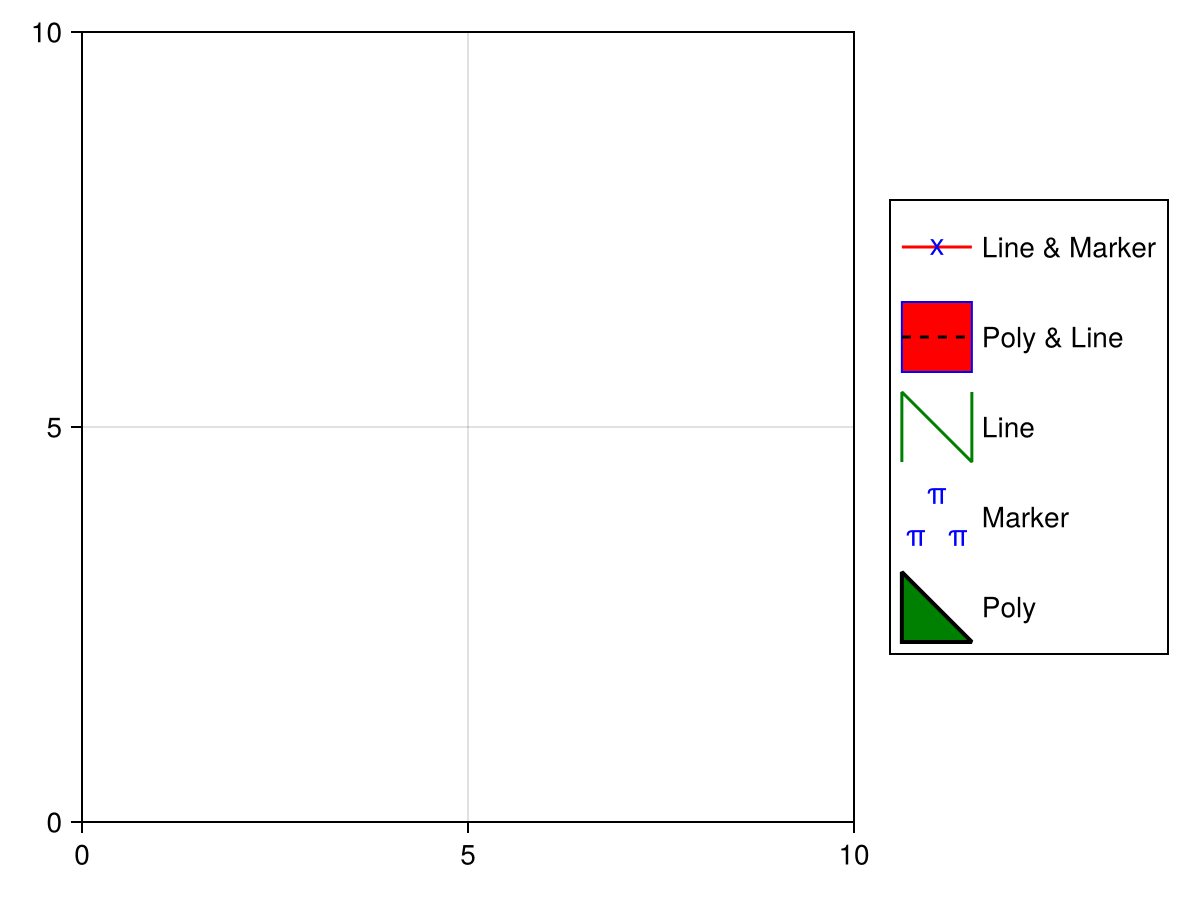
Переопределение атрибутов записи условных обозначений
По умолчанию условные обозначения наследуют визуальные атрибуты графиков, которым они принадлежат. Иногда необходимо переопределить некоторые из этих атрибутов, чтобы сделать условные обозначения более удобочитаемыми. Вы можете связать объект «ключ-значение» NamedTuple или Dict{Symbol} с label графика, чтобы переопределить автоматическую запись условных обозначений, например чтобы увеличить размер маркера Scatter:
using CairoMakie
f, ax, sc = scatter(
    cos.(range(0, 7pi, 100)),
    color = :black,
    markersize = 8,
    label = "cos" => (; markersize = 15)
)
scatter!(
    sin.(range(0, 7pi, 100)),
    color = :black,
    marker = :utriangle,
    markersize = 8,
    label = "sin" => (; markersize = 15)
)
Legend(f[1, 2], ax)
f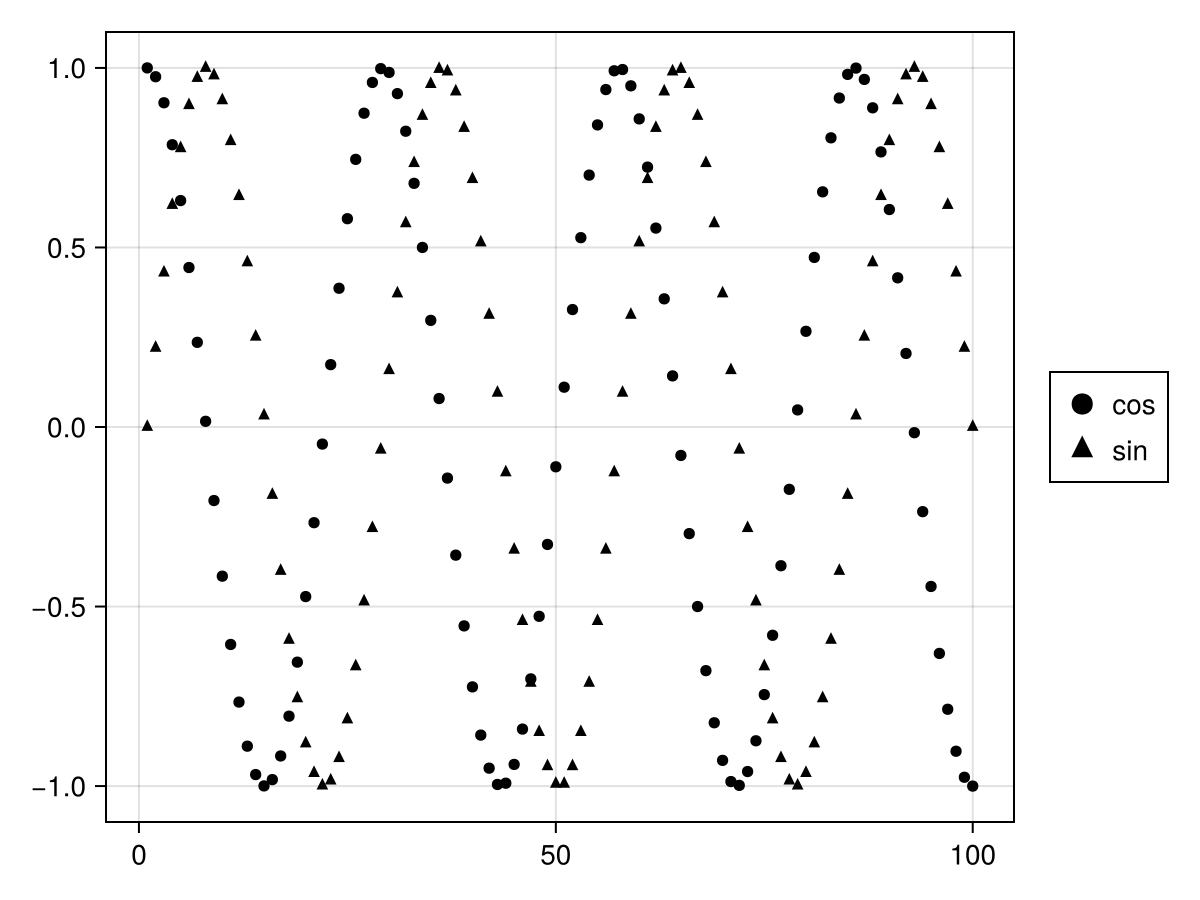
Вот атрибуты, которые можно переопределить (обратите внимание, что некоторые из них имеют вспомогательные псевдонимы, например color, который применяется ко всем элементам, а polycolor — только к PolyElement):
-
MarkerElement-
[marker]points,markersize,[marker]strokewidth,[marker]color,[marker]strokecolor,[marker]colorrange,[marker]colormap
-
-
LineElement-
[line]points,linewidth,[line]color,linestyle,[line]colorrange,[line]colormap
-
-
PolyElement-
[poly]points,[poly]strokewidth,[poly]color,[poly]strokecolor,[poly]colorrange,[poly]colormap
-
Еще одним распространенным случаем является создание условных обозначений для графика с категориальной цветовой картой. Передавая вектор меток в сочетании с переопределениями, можно создать несколько записей с нужными цветами:
using CairoMakie
f, ax, bp = barplot(
    1:5,
    [1, 3, 2, 5, 4],
    color = 1:5,
    colorrange = (1, 5),
    colormap = :Set1_5,
    label = [label => (; color = i)
        for (i, label) in enumerate(["red", "blue", "green", "purple", "orange"])]
)
Legend(f[1, 2], ax)
f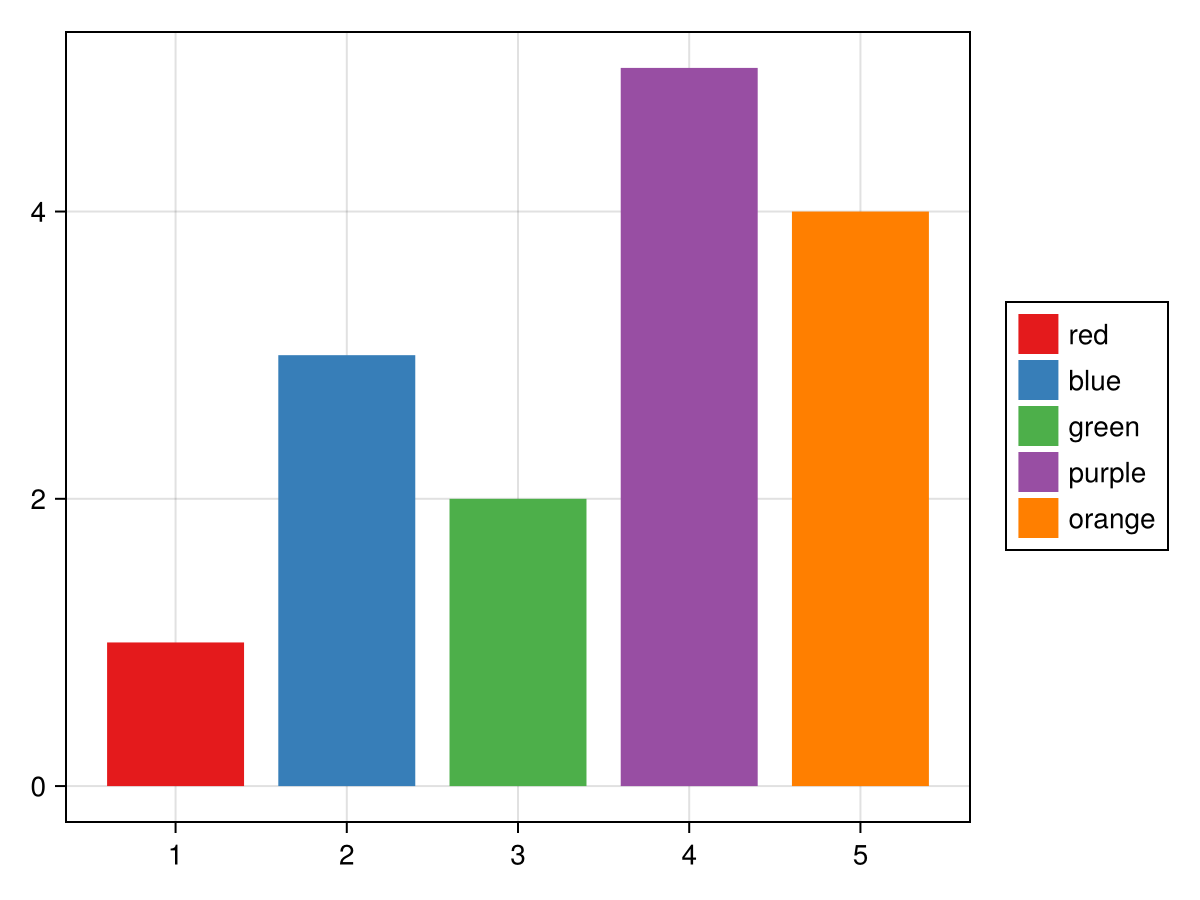
Можно также переопределять графики в самом конструкторе Legend. В этом случае вы связываете переопределения с графиками, записи условных обозначений которых нужно переопределить:
using CairoMakie
f = Figure()
ax = Axis(f[1, 1])
li = lines!(ax, 1:5, linestyle = :dot)
sc = scatter!(ax, 1:5, markersize = 10)
Legend(
    f[1, 2],
    [
        sc => (; markersize = 20),
        li => (; linewidth = 3),
        [li, sc] => (; color = :red),
        [li => (; linewidth = 3), sc => (; markersize = 20)],
    ],
    ["Scatter", "Line", "Both", "Both 2"],
    patchsize = (40, 20),
)
f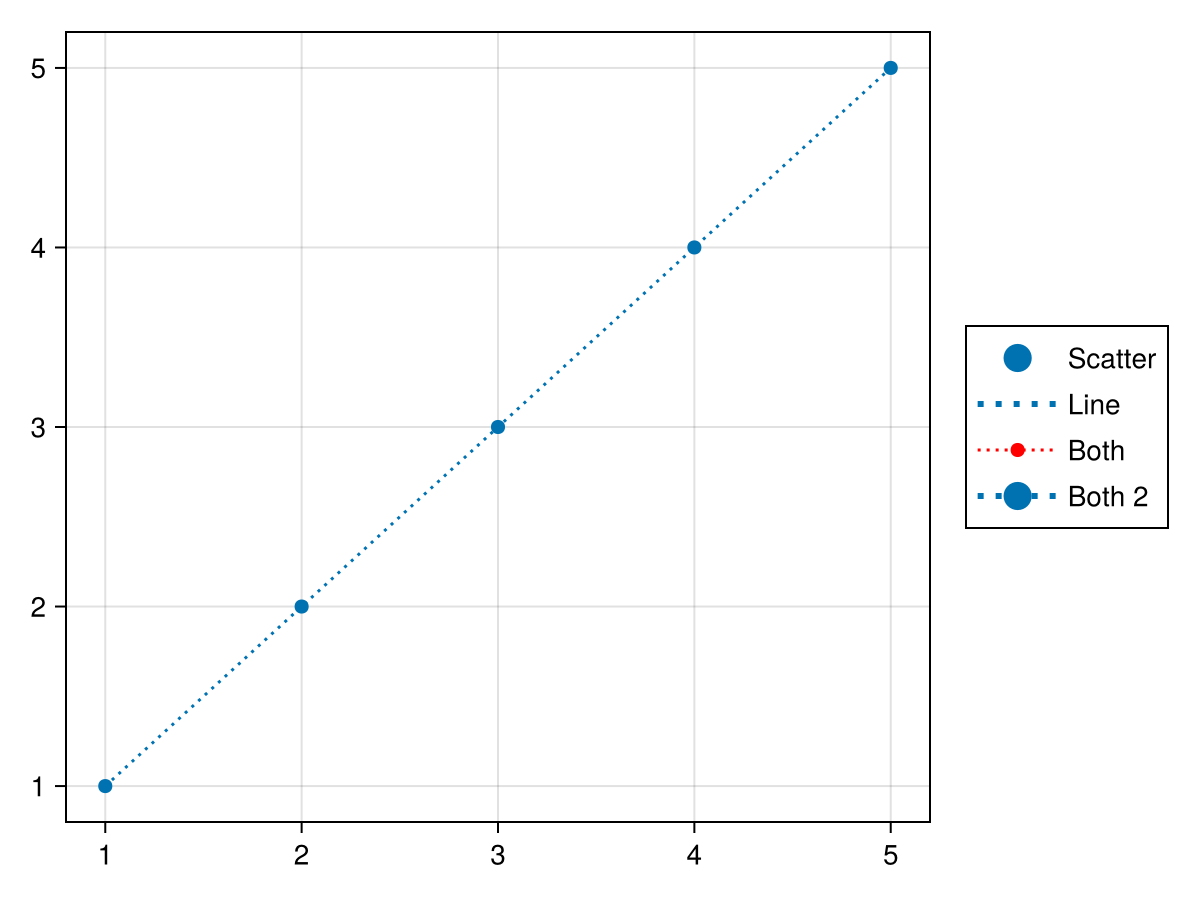
Условные обозначения из нескольких групп
Иногда условные обозначения состоят из нескольких групп, например в графике, где варьируются размер и цвет маркера, и эти свойства должны быть визуализированы по отдельности, но при этом находиться в одном блоке условных обозначений. Содержимое каждой группы представлено в виде массива элементов и массива меток, каждый из которых располагается в одном коллективном массиве. Вы можете изменить положение заголовков, относящихся к каждой группе, с помощью атрибута titleposition, либо :left, либо :top.
using CairoMakie

f = Figure()

markersizes = [5, 10, 15, 20]
colors = [:red, :green, :blue, :orange]

group_size = [MarkerElement(marker = :circle, color = :black,
    strokecolor = :transparent,
    markersize = ms) for ms in markersizes]

group_color = [PolyElement(color = color, strokecolor = :transparent)
    for color in colors]

legends = [Legend(f,
    [group_size, group_color],
    [string.(markersizes), string.(colors)],
    ["Size", "Color"], tellheight = true) for _ in 1:4]

f[1, 1:2] = legends[1:2]
f[2, :] = legends[3]
f[3, :] = legends[4]

for l in legends[3:4]
    l.orientation = :horizontal
    l.tellheight = true
    l.tellwidth = false
end

legends[2].titleposition = :left
legends[4].titleposition = :left

legends[1].nbanks = 2
legends[4].nbanks = 2

Label(f[1, 1, Left()], "titleposition = :top\norientation = :vertical\nnbanks = 2", font = :italic, padding = (0, 10, 0, 0))
Label(f[1, 2, Right()], "titleposition = :left\norientation = :vertical\nnbanks = 1", font = :italic, padding = (10, 0, 0, 0))
Label(f[2, 1:2, Top()], "titleposition = :top, orientation = :horizontal\nnbanks = 1", font = :italic)
Label(f[3, 1:2, Top()], "titleposition = :left, orientation = :horizontal\nnbanks = 2", font = :italic)

f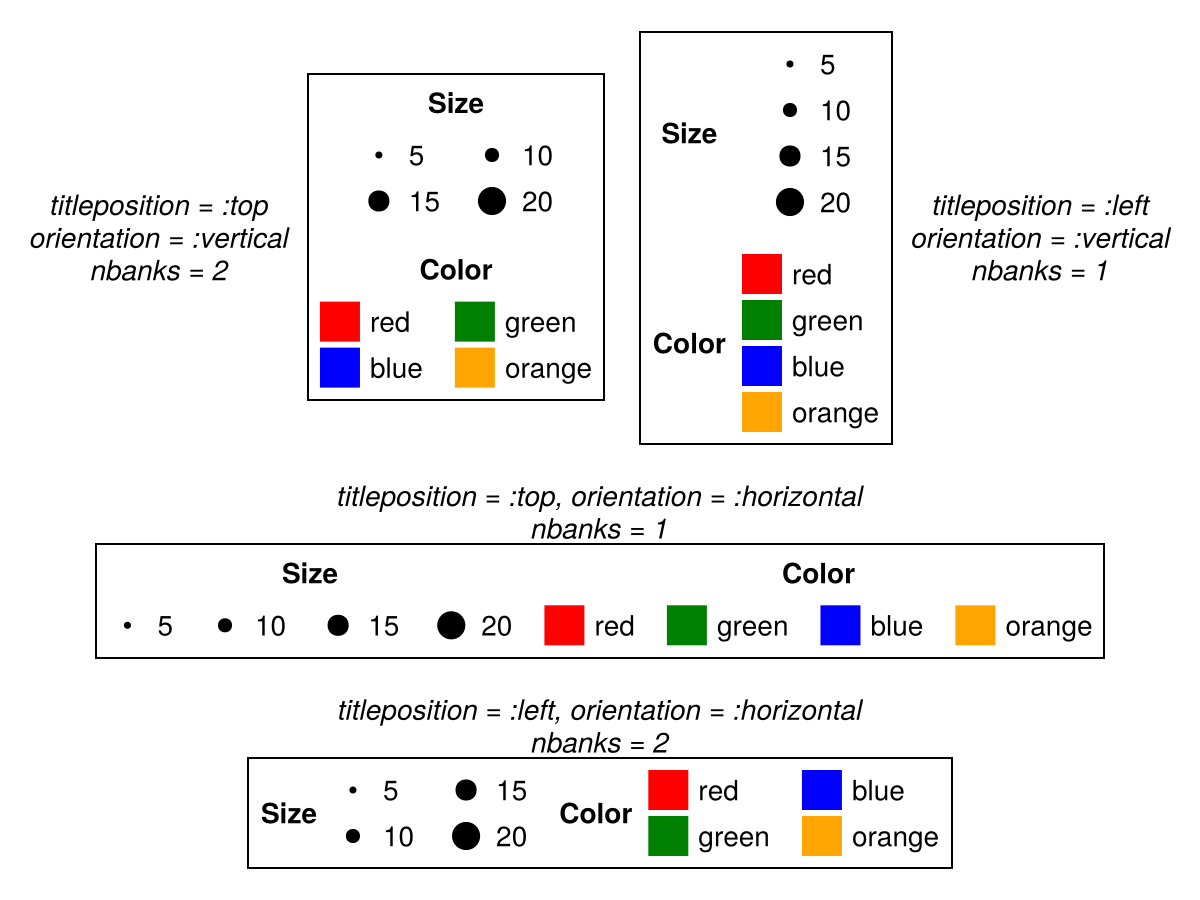
Атрибуты
alignmode
Значение по умолчанию: Inside()
Режим выравнивания условных обозначений в родительской сетке.
bgcolor
Значение по умолчанию: nothing
Цвет фона легенды. НЕ РЕКОМЕНДУЕТСЯ - использовать backgroundcolor вместо.
colgap
Значение по умолчанию: 16
using CairoMakie
fig = Figure()
ax = Axis(fig[1, 1])
lines!(ax, 1:10, linestyle = :dash, label = "Line")
poly!(ax, [(5, 0), (10, 0), (7.5, 5)], label = "Poly")
scatter!(ax, 4:13, label = "Scatter")
Legend(fig[1, 2], ax, "Default", nbanks = 2)
Legend(fig[1, 3], ax, "colgap = 40", nbanks = 2, colgap = 40)
fig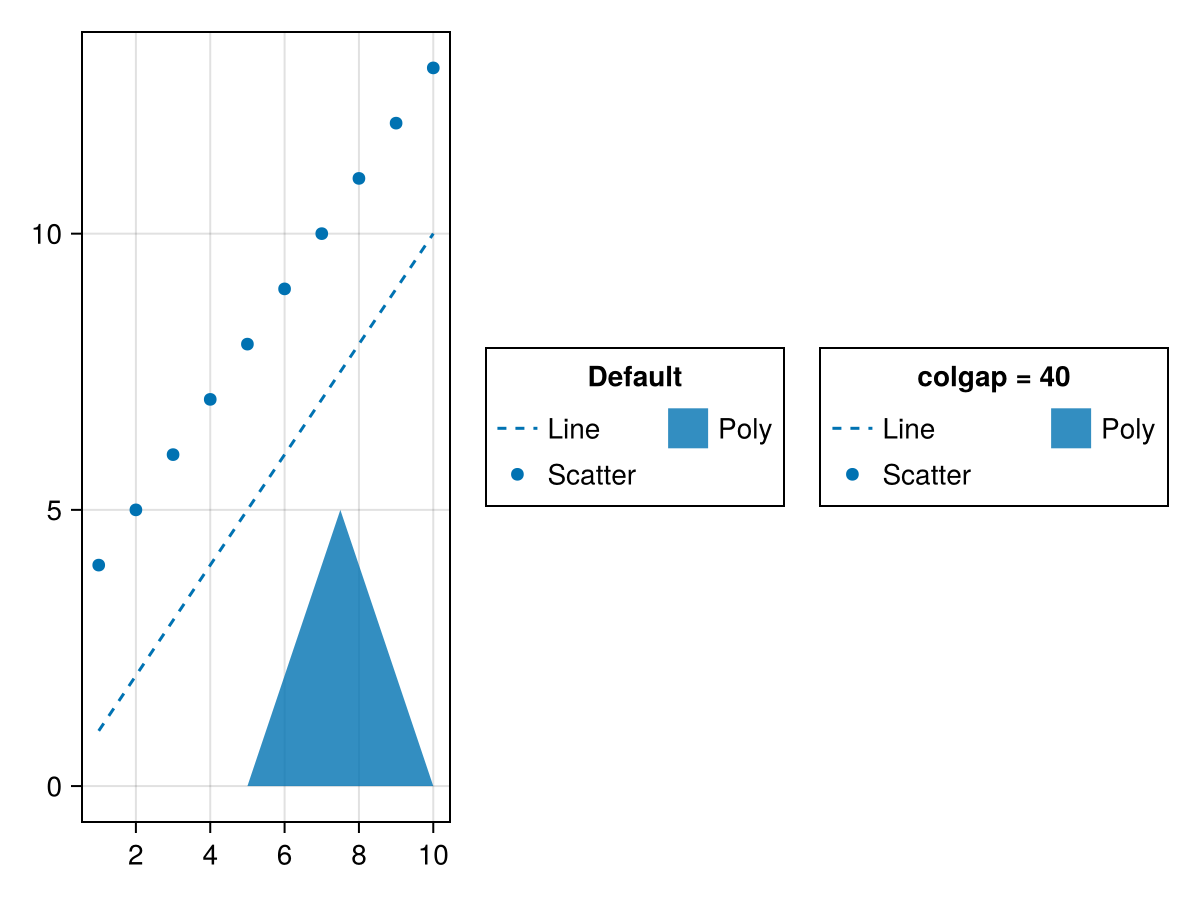
gridshalign
Значение по умолчанию: :center
Горизонтальное выравнивание групп элементов в их родительской сетке.
gridsvalign
Значение по умолчанию: :center
Вертикальное выравнивание групп элементов в их родительской сетке.
groupgap
Значение по умолчанию: 16
using CairoMakie
fig = Figure()
ax = Axis(fig[1, 1])
lin = lines!(ax, 1:10, linestyle = :dash)
pol = poly!(ax, [(5, 0), (10, 0), (7.5, 5)])
sca = scatter!(ax, 4:13)
Legend(fig[1, 2],
    [[lin], [pol], [sca]],
    [["Line"], ["Poly"], ["Scatter"]],
    ["Default", "Group 2", "Group 3"];

)
Legend(fig[1, 3],
    [[lin], [pol], [sca]],
    [["Line"], ["Poly"], ["Scatter"]],
    ["groupgap = 30", "Group 2", "Group 3"];
    groupgap = 30,
)
fig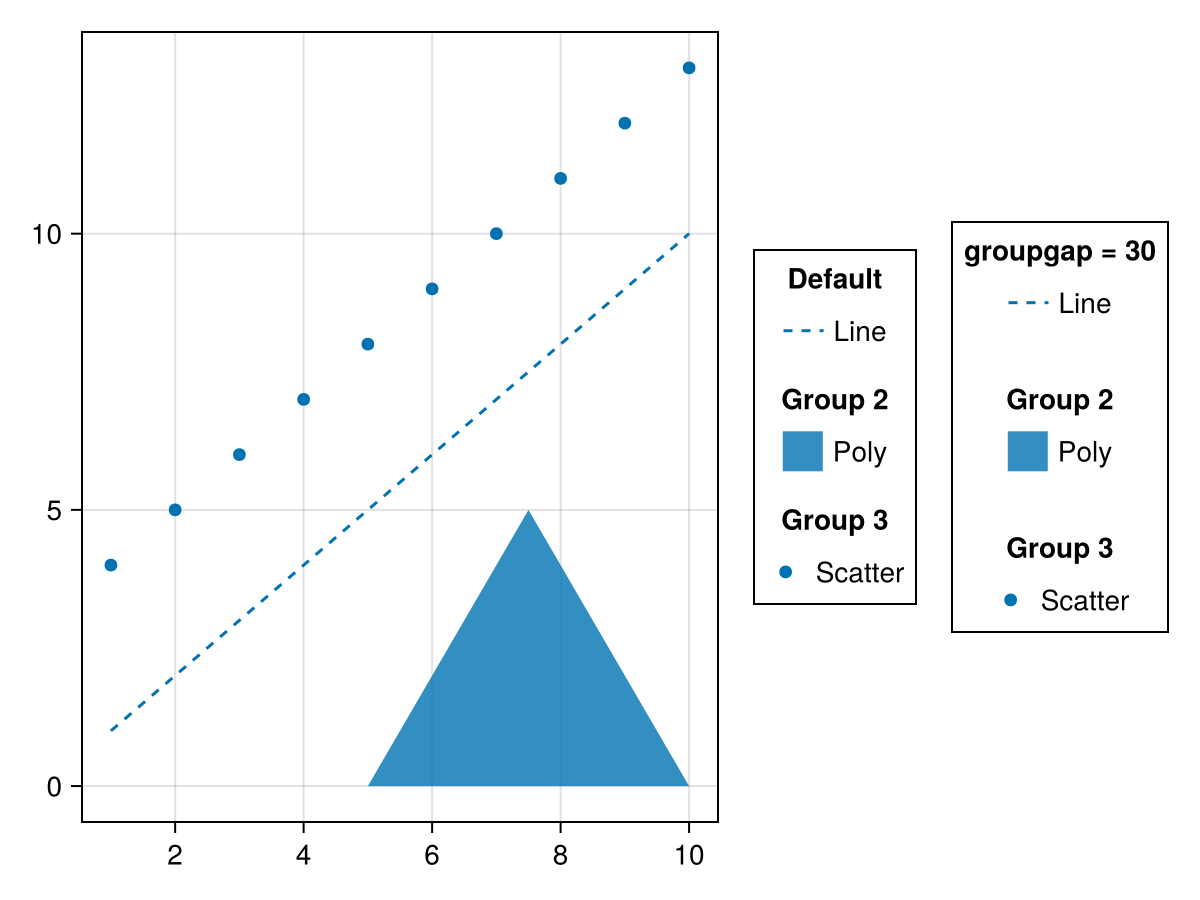
halign
Значение по умолчанию: :center
Горизонтальное выравнивание условных обозначений в предлагаемой ограничивающей рамке.
heatmapcolorrange
Значение по умолчанию: automatic
Цветовой диапазон по умолчанию для элементов тепловой карты. Если он не задан, он будет получен из значений тепловой карты.
heatmaplimits
Значение по умолчанию: (0 .. 1, 0 .. 1)
Пределы (или векторы) по умолчанию (x, y), используемые для элементов тепловой карты, в нормализованных координатах относительно каждого участка метки.
heatmapvalues
Значение по умолчанию: [0 0.3; 0.6 1]
Значения по умолчанию, используемые для элементов тепловой карты.
imagecolorrange
Значение по умолчанию: automatic
Цветовой диапазон по умолчанию для ImageElements. Если этот параметр не задан, то он будет получен из значений imagevalues.
imagelimits
Значение по умолчанию: (0 .. 1, 0 .. 1)
Значения по умолчанию (x, y), используемые для элементов изображения в нормализованных координатах относительно каждого участка надписи.
imagevalues
Значение по умолчанию: [0 0.3; 0.6 1]
Значения по умолчанию (или цвета), используемые для элементов изображения.
labeljustification
Значение по умолчанию: automatic
Выравнивание текста надписи. По умолчанию используется значение automatic, при котором выравнивание будет равно labelhalign.
linecolor
Значение по умолчанию: theme(scene, :linecolor)
Цвет линии по умолчанию, используемый для LineElements
linecolormap
Значение по умолчанию: theme(scene, :colormap)
Цветовая карта по умолчанию для линейных элементов
linecolorrange
Значение по умолчанию: automatic
Цветовой диапазон по умолчанию для линейных элементов
linepoints
Значение по умолчанию: [Point2f(0, 0.5), Point2f(1, 0.5)]
Точки по умолчанию, используемые для линейных элементов в нормализованных координатах относительно каждого участка надписи.
linewidth
Значение по умолчанию: theme(scene, :linewidth)
Ширина линии по умолчанию, используемая для LineElements.
margin
Значение по умолчанию: (0.0f0, 0.0f0, 0.0f0, 0.0f0)
Дополнительное пространство между легендой и предполагаемым ограничивающим полем.
markercolor
Значение по умолчанию: theme(scene, :markercolor)
Цвет маркера по умолчанию для MarkerElements
markercolormap
Значение по умолчанию: theme(scene, :colormap)
Цветовая карта маркеров по умолчанию для MarkerElements
markercolorrange
Значение по умолчанию: automatic
Диапазон цветов маркера по умолчанию для MarkerElements
markerpoints
Значение по умолчанию: [Point2f(0.5, 0.5)]
Точки маркера по умолчанию, используемые для MarkerElements, в нормализованных координатах относительно каждого участка метки.
markersize
Значение по умолчанию: theme(scene, :markersize)
Размер маркера по умолчанию, используемый для MarkerElements.
markerstrokecolor
Значение по умолчанию: theme(scene, :markerstrokecolor)
Цвет обводки маркера по умолчанию, используемый для MarkerElements.
markerstrokewidth
Значение по умолчанию: theme(scene, :markerstrokewidth)
Ширина обводки маркера по умолчанию, используемая для MarkerElements.
mesh
Значение по умолчанию: Rect3f(Point3f(-0.7), Vec3f(1.4))
Сетка по умолчанию используется для MeshElements. Для 3D-элементов камера располагается в точке (1, 1, 1), смотрит в направлении (0, 0, 0), а z - вверх.
meshcolor
Значение по умолчанию: (wong_colors())[1]
Цвет сетки по умолчанию, используемый для элементов сетки.
meshcolormap
Значение по умолчанию: theme(scene, :colormap)
Цветовая карта по умолчанию для элементов сетки
meshscattercolor
Значение по умолчанию: theme(scene, :markercolor)
Цвет маркера по умолчанию для MeshScatterElements
meshscattercolormap
Значение по умолчанию: theme(scene, :colormap)
Цветовая карта маркеров по умолчанию для MeshScatterElements
meshscattercolorrange
Значение по умолчанию: automatic
Диапазон цветов маркера по умолчанию для MeshScatterElements
meshscattermarker
Значение по умолчанию: Sphere(Point3f(0), 1.0f0)
Маркер по умолчанию для MeshScatterElements
meshscatterpoints
Значение по умолчанию: [Point3f(0)]
Точки-маркеры по умолчанию используются для элементов сетки. Для 3D-элементов камера располагается в точке (1, 1, 1), смотрит в направлении (0, 0, 0), а z - вверх.
meshscatterrotation
Значение по умолчанию: Quaternionf(0, 0, 0, 1)
Поворот маркера по умолчанию, используемый для MeshScatterElements.
meshscattersize
Значение по умолчанию: 0.8
Размер маркера по умолчанию, используемый для MeshScatterElements.
nbanks
Значение по умолчанию: 1
Количество банков, в которых сгруппированы записи условных обозначений. Столбцы, если условные обозначения ориентированы вертикально, в противном случае строки.
using CairoMakie
fig = Figure()
ax = Axis(fig[1, 1])
lines!(ax, 1:10, linestyle = :dash, label = "Line")
poly!(ax, [(5, 0), (10, 0), (7.5, 5)], label = "Poly")
scatter!(ax, 4:13, label = "Scatter")
grid = GridLayout(fig[1, 2], tellheight = false)
Legend(grid[1, 1], ax, "nbanks = 1", nbanks = 1, tellheight = true)
Legend(grid[1, 2], ax, "nbanks = 2", nbanks = 2, tellheight = true)
Legend(grid[2, :], ax, "nbanks = 3", nbanks = 3, tellheight = true)
fig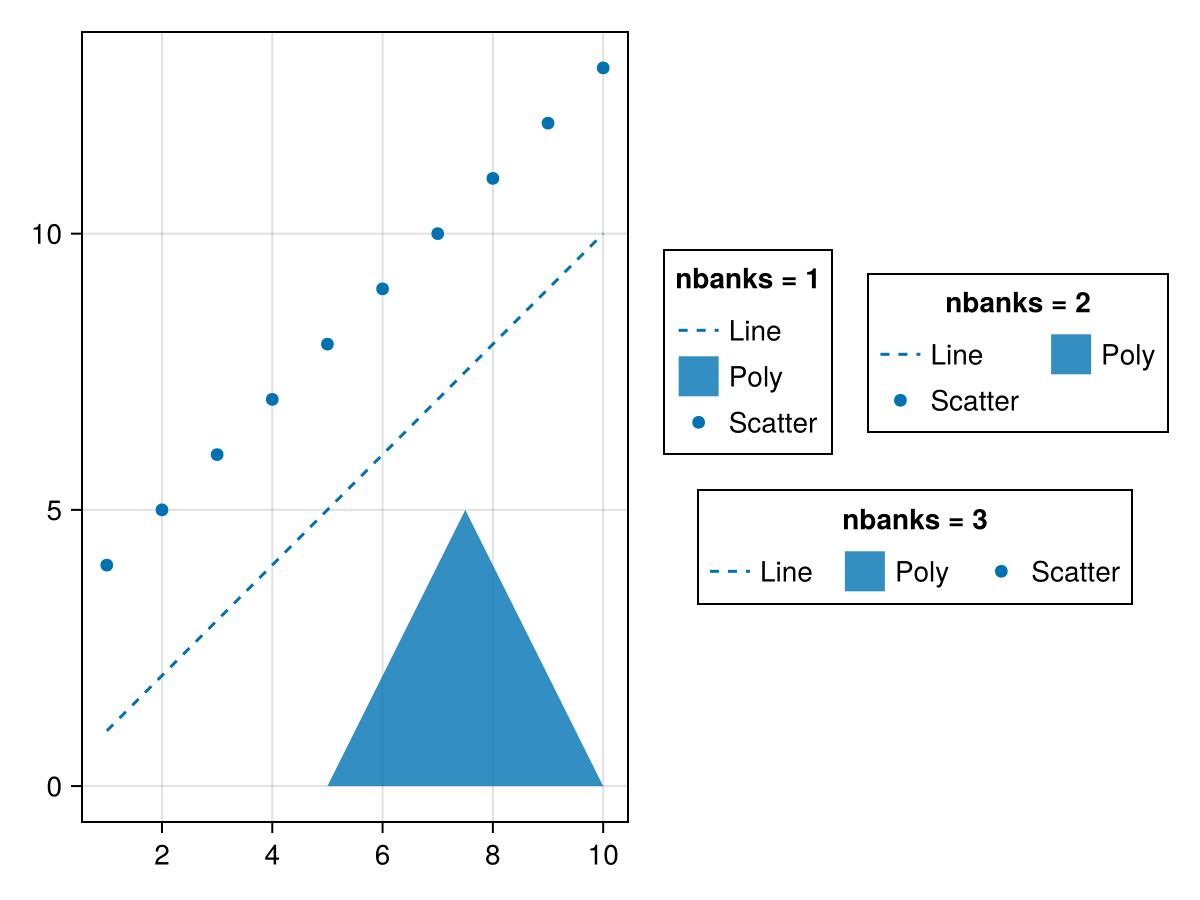
using CairoMakie
fig = Figure()
ax = Axis(fig[1, 1])
lines!(ax, 1:10, linestyle = :dash, label = "Line")
poly!(ax, [(5, 0), (10, 0), (7.5, 5)], label = "Poly")
scatter!(ax, 4:13, label = "Scatter")
grid = GridLayout(fig[2, 1], tellwidth = false)
Legend(grid[1, 1], ax, "nbanks = 1", nbanks = 1,
    orientation = :horizontal, tellwidth = true)
Legend(grid[2, 1], ax, "nbanks = 2", nbanks = 2,
    orientation = :horizontal, tellwidth = true)
Legend(grid[:, 2], ax, "nbanks = 3", nbanks = 3,
    orientation = :horizontal, tellwidth = true)
fig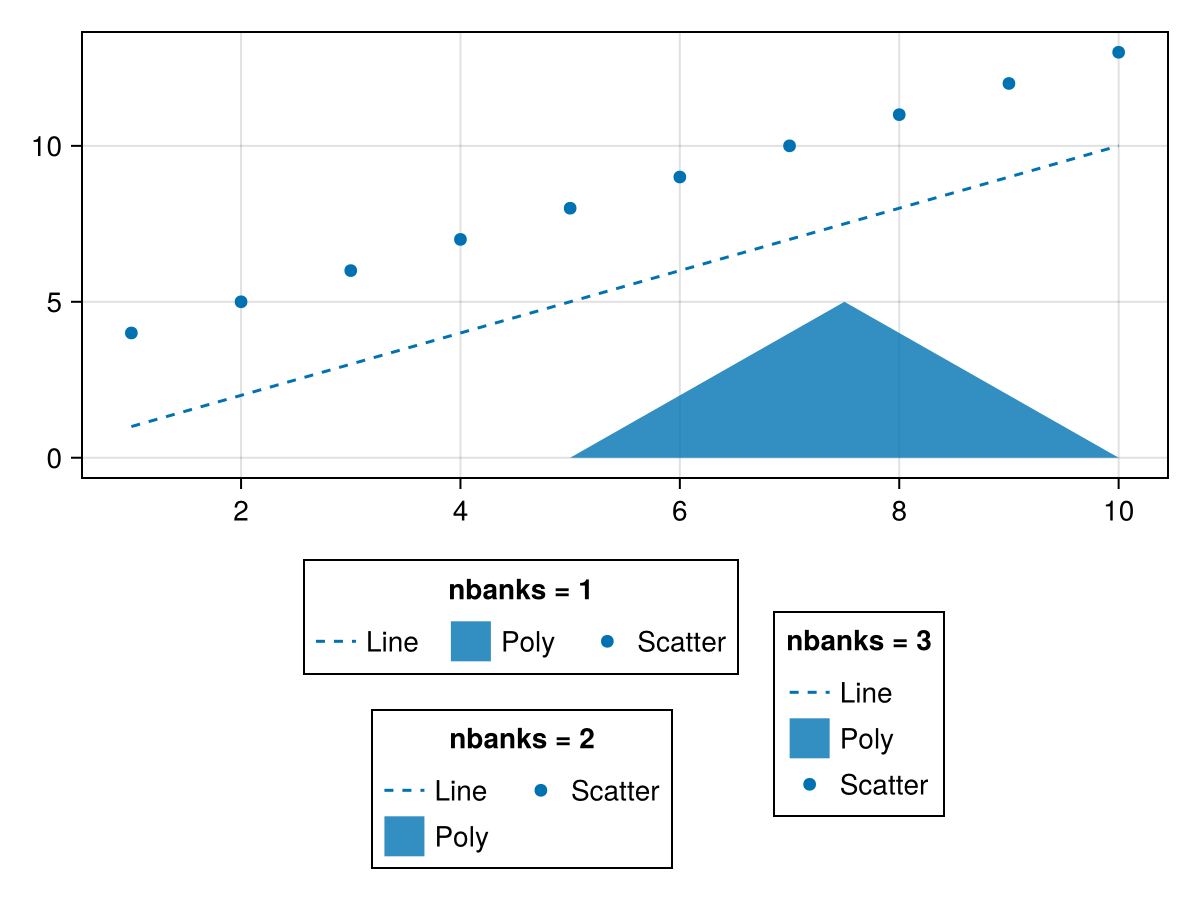
orientation
Значение по умолчанию: :vertical
using CairoMakie
fig = Figure()
ax = Axis(fig[1, 1])
lines!(ax, 1:10, linestyle = :dash, label = "Line")
poly!(ax, [(5, 0), (10, 0), (7.5, 5)], label = "Poly")
scatter!(ax, 4:13, label = "Scatter")
Legend(fig[2, 1], ax, "orientation
= :horizontal", orientation = :horizontal)
Legend(fig[1, 2], ax, "orientation
= :vertical", orientation = :vertical)
fig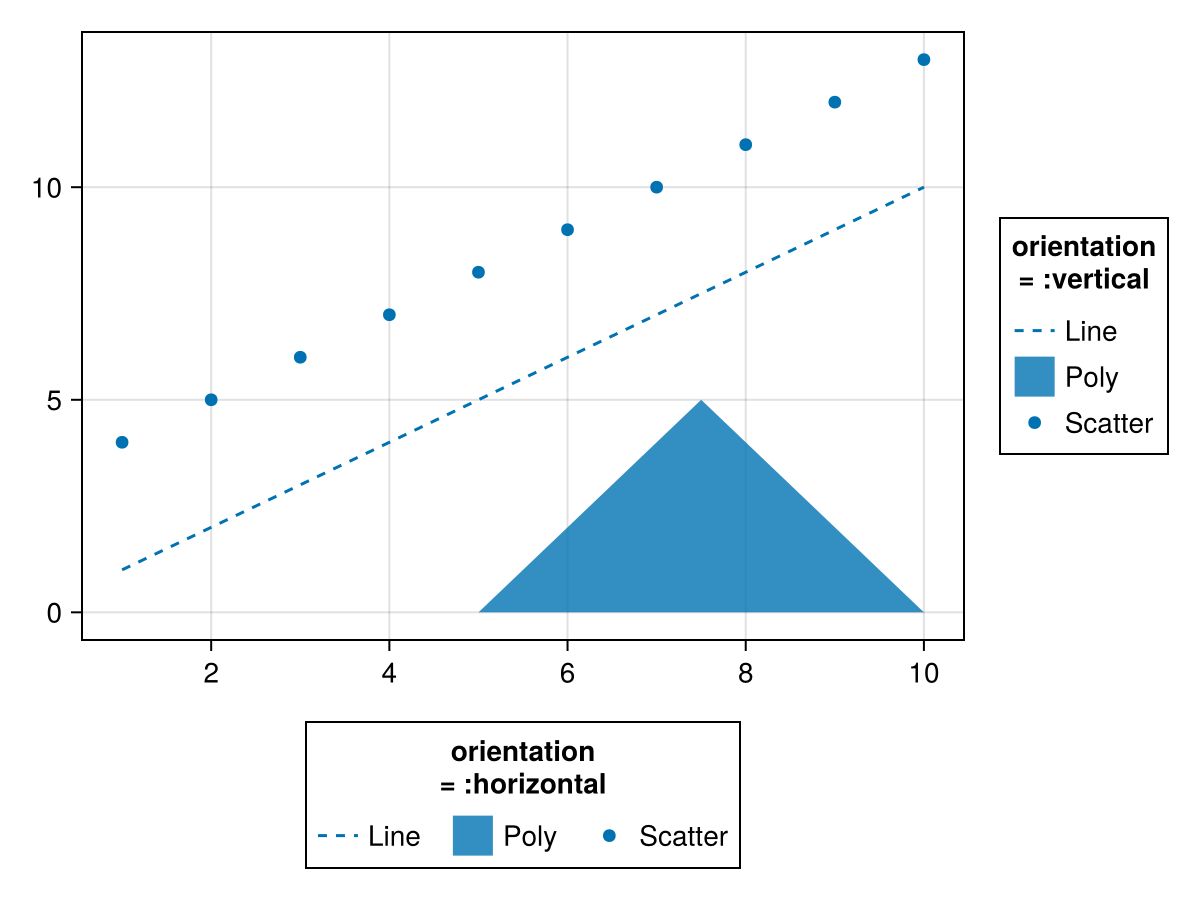
padding
Значение по умолчанию: (6.0f0, 6.0f0, 6.0f0, 6.0f0)
Дополнительное пространство между содержимым условных обозначений и границей.
patchlabelgap
Значение по умолчанию: 5
using CairoMakie
fig = Figure()
ax = Axis(fig[1, 1])
lines!(ax, 1:10, linestyle = :dash, label = "Line")
poly!(ax, [(5, 0), (10, 0), (7.5, 5)], label = "Poly")
scatter!(ax, 4:13, label = "Scatter")
Legend(fig[1, 2], ax, "Default")
Legend(fig[1, 3], ax, "patchlabelgap
= 20", patchlabelgap = 20)
fig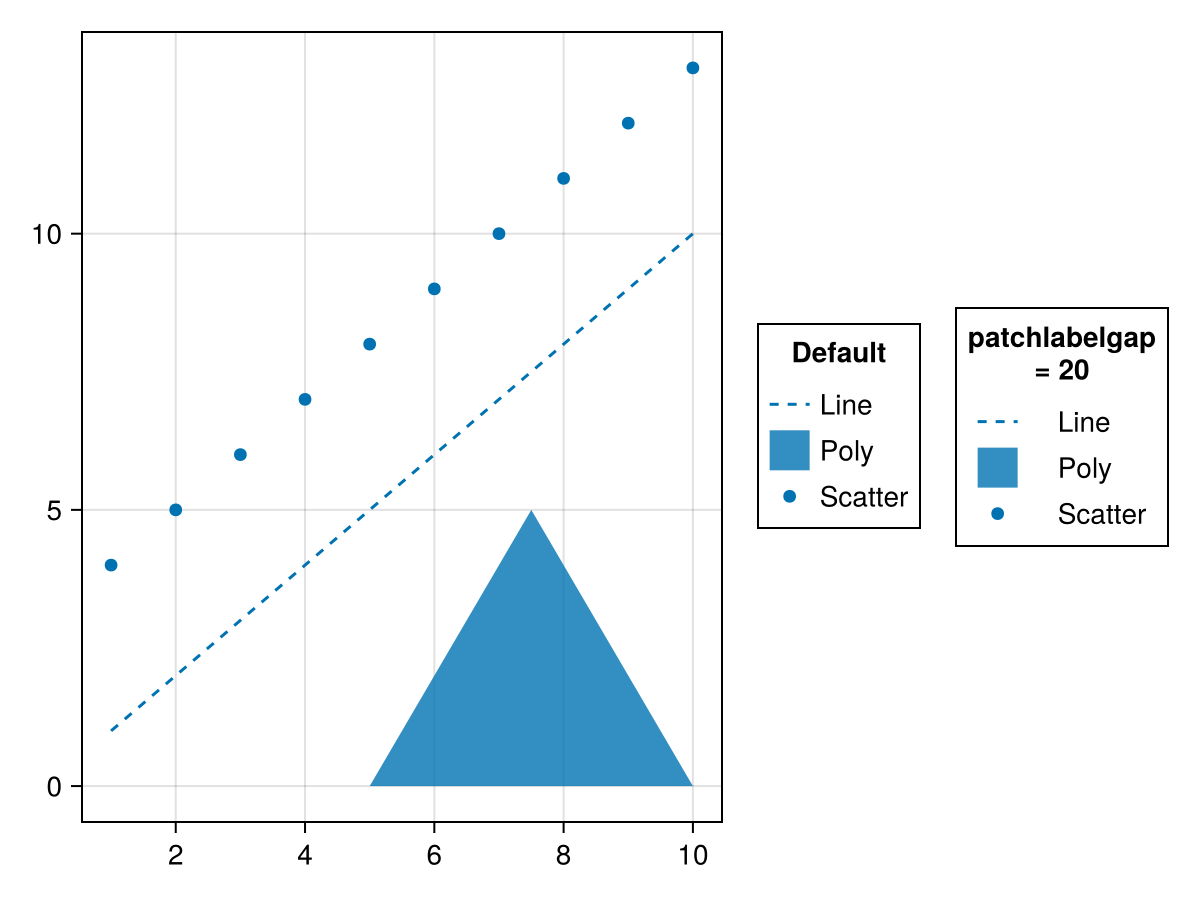
patchsize
Значение по умолчанию: (20.0f0, 20.0f0)
Размер прямоугольников, содержащих условные обозначения. Это может помочь увеличить ширину, если линейные узоры не видны четко при размере по умолчанию.
using CairoMakie
fig = Figure()
ax = Axis(fig[1, 1])
lines!(ax, 1:10, linestyle = :dash, label = "Line")
poly!(ax, [(5, 0), (10, 0), (7.5, 5)], label = "Poly")
scatter!(ax, 4:13, label = "Scatter")
Legend(fig[1, 2], ax, "Default")
Legend(fig[1, 3], ax, "(40, 20)", patchsize = (40, 20))
fig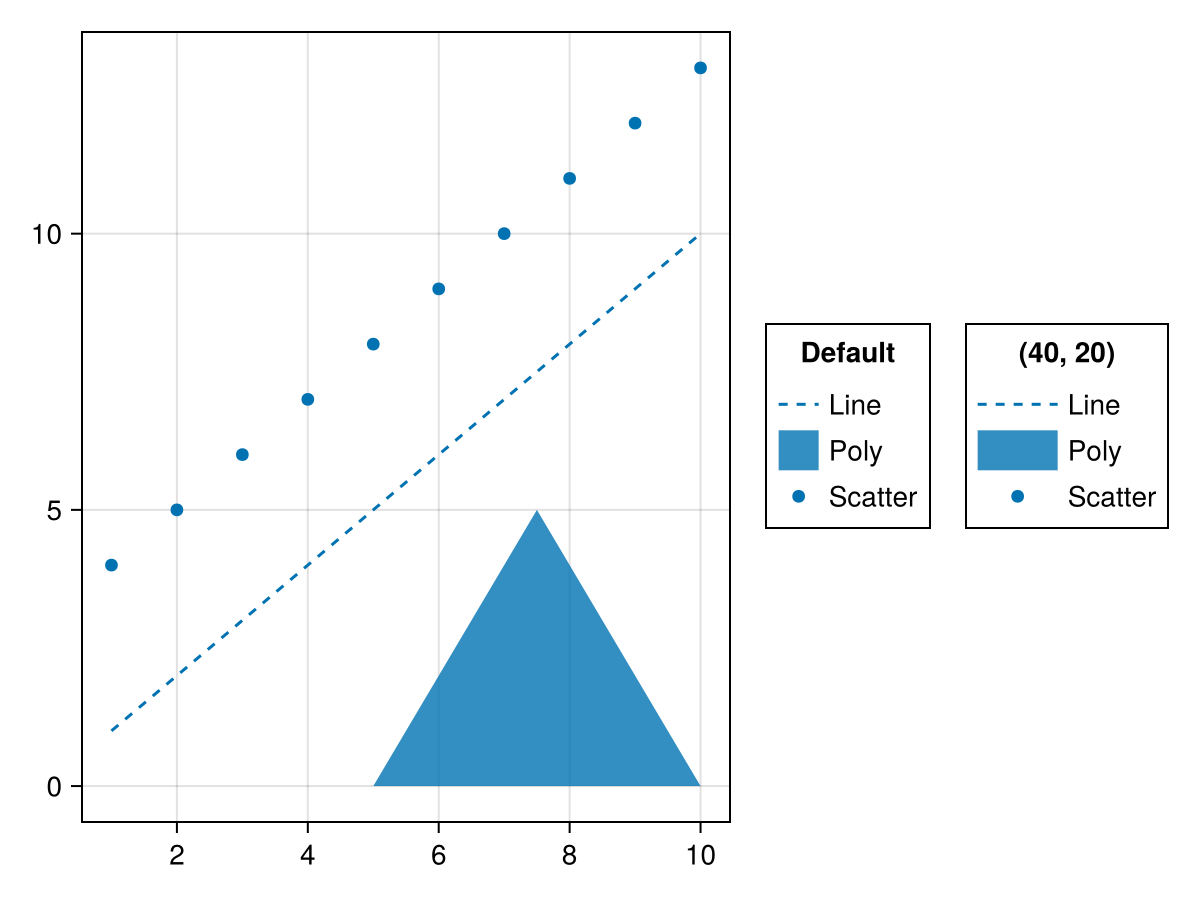
patchstrokecolor
Значение по умолчанию: :transparent
Цвет границы участков, содержащих условные обозначения.
patchstrokewidth
Значение по умолчанию: 1.0
Ширина линии границы участков, содержащих условные обозначения-маркеры.
polycolor
Значение по умолчанию: theme(scene, :patchcolor)
Многоцветный цвет по умолчанию, используемый для многоэлементов.
polycolormap
Значение по умолчанию: theme(scene, :colormap)
Цветовая карта по умолчанию для полиэлементов
polypoints
Значение по умолчанию: [Point2f(0, 0), Point2f(1, 0), Point2f(1, 1), Point2f(0, 1)]
Точки по умолчанию, используемые для полиэлементов в нормализованных координатах относительно каждого участка метки.
polystrokecolor
Значение по умолчанию: theme(scene, :patchstrokecolor)
Цвет многоцветной обводки по умолчанию, используемый для многоэлементов.
polystrokewidth
Значение по умолчанию: theme(scene, :patchstrokewidth)
Ширина обводки по умолчанию, используемая для многоэлементов.
rowgap
Значение по умолчанию: 3
using CairoMakie
fig = Figure()
ax = Axis(fig[1, 1])
lines!(ax, 1:10, linestyle = :dash, label = "Line")
poly!(ax, [(5, 0), (10, 0), (7.5, 5)], label = "Poly")
scatter!(ax, 4:13, label = "Scatter")
Legend(fig[1, 2], ax, "Default")
Legend(fig[1, 3], ax, "rowgap = 10", rowgap = 10)
fig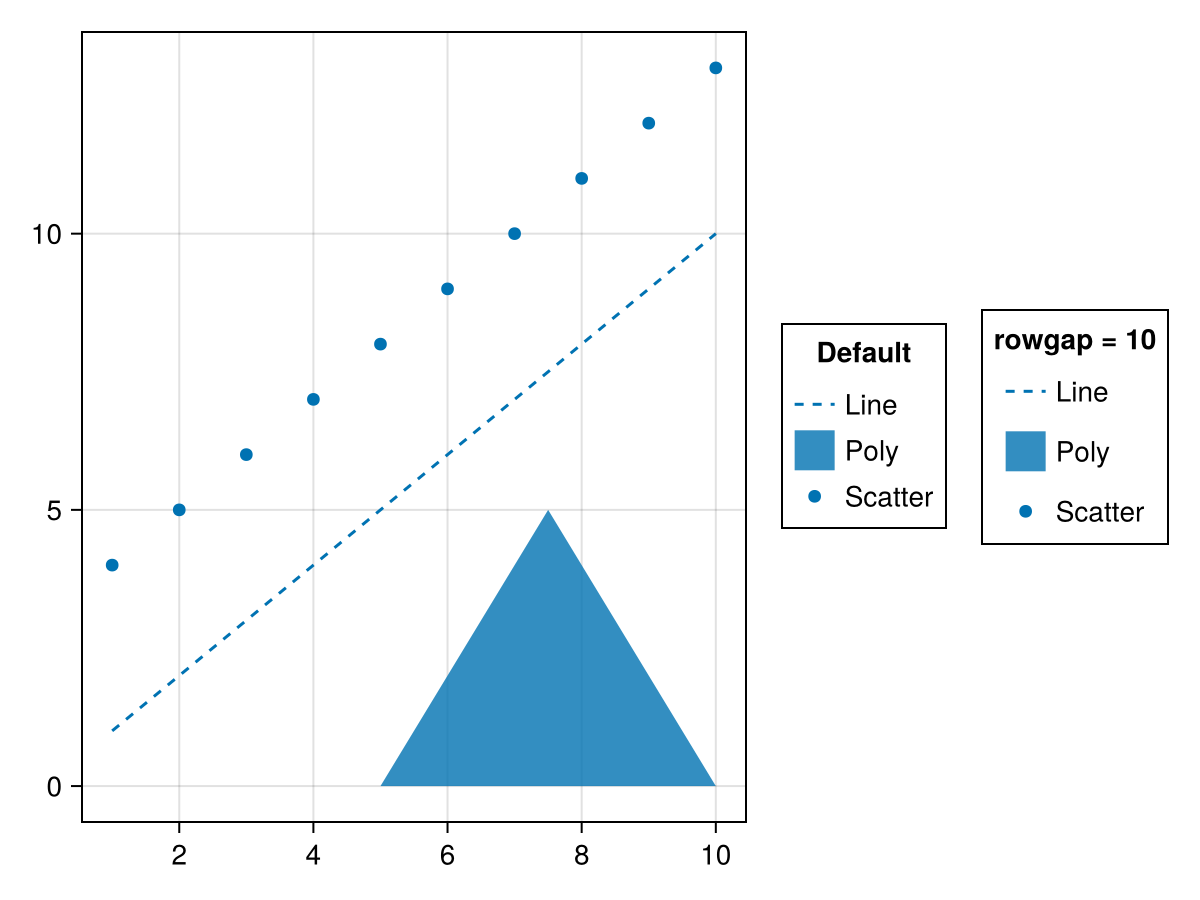
surfacecolormap
Значение по умолчанию: theme(scene, :colormap)
Цветовая карта по умолчанию для элементов сетки на основе поверхности
surfacecolorrange
Значение по умолчанию: automatic
Цветовой диапазон по умолчанию для элементов сетки, основанных на поверхности. Если значение не задано, оно будет получено из значений surfacevalues.
surfacedata
Значение по умолчанию: (-0.7 .. 0.7, -0.7 .. 0.7, [-0.007 * x ^ 3 * (1 - 0.05 * y ^ 2) for x = -5:5, y = -5:5])
Данные по умолчанию (x, y, z), используемые для элементов сетки на основе поверхности. Для 3D-элементов камера располагается в точке (1, 1, 1), направленной в сторону (0, 0, 0), при этом z находится вверху.
surfacevalues
Значение по умолчанию: automatic
Значения/цвета по умолчанию, используемые для элементов сетки на основе поверхности. Они должны соответствовать размеру zs. Если значение не задано, будут использоваться значения z .
tellheight
Значение по умолчанию: automatic
Определяет, может ли родительский макет подстраиваться под высоту этого элемента
tellwidth
Значение по умолчанию: automatic
Определяет, может ли родительский макет подстраиваться под ширину этого элемента
titlegap
Значение по умолчанию: 8
Разрыв между названием каждой группы и соответствующей ей группой.
titlehalign
Значение по умолчанию: :center
Выравнивание заголовков групп условных обозначений по горизонтали.
titleposition
Значение по умолчанию: :top
using CairoMakie
fig = Figure()
ax = Axis(fig[1, 1])
lines!(ax, 1:10, linestyle = :dash, label = "Line")
poly!(ax, [(5, 0), (10, 0), (7.5, 5)], label = "Poly")
scatter!(ax, 4:13, label = "Scatter")
Legend(fig[1, 2], ax, "titleposition
= :top", titleposition = :top)
Legend(fig[1, 3], ax, "titleposition
= :left", titleposition = :left)
fig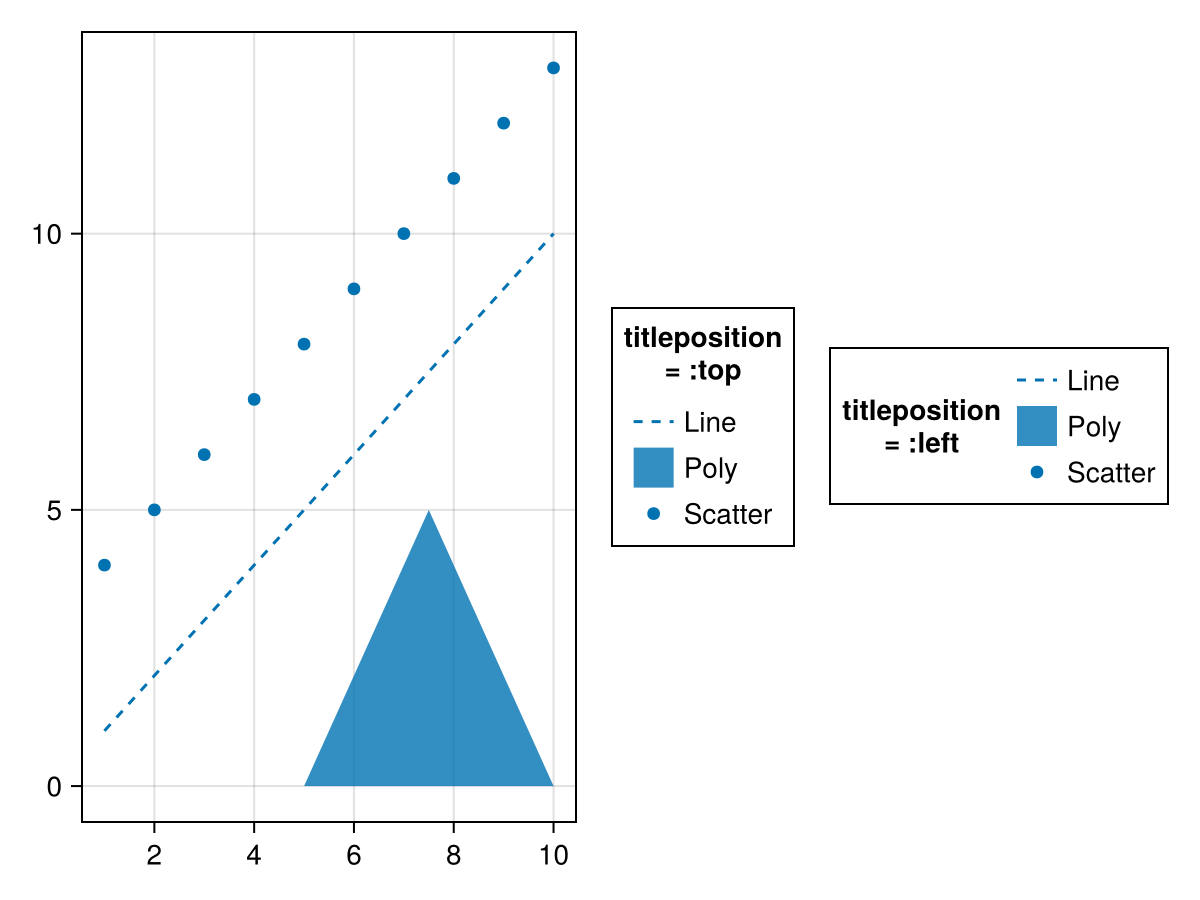
titlesize
Значение по умолчанию: @inherit :fontsize 16.0f0
Размер шрифта заголовков групп условных обозначений.
titlevalign
Значение по умолчанию: :center
Выравнивание заголовков групп условных обозначений по вертикали.