detrend
Removes the polynomial trend.
| Library |
|
Syntax
Function call
-
D = detrend(A)— removes the straightest line from the data inAand returns the remaining data.-
If
A— vector, thendetrendsubtracts the trend from the elementsA. -
If
A— the matrix, thendetrendIt is applied to each column separately, subtracting each trend from the corresponding column.A. -
If
A— a multidimensional array, thendetrendIt is applied to each column across all dimensions, subtracting each trend from the corresponding column.A.
-
-
D = detrend(_, Name=Value)— also uses argumentsName=Valuein addition to any input arguments provided in the previous syntaxes.
Arguments
Input arguments
# A — input data
+
vector | the matrix | multidimensional array | table
Details
Input data specified as a vector, matrix, multidimensional array, or table.
-
If
A— vector, thendetrendsubtracts the trend from the elementsA. -
If
A— the matrix, thendetrendIt is applied to each column separately, subtracting each trend from the corresponding column.A. -
If
A— a multidimensional array, thendetrendIt is applied to each column across all dimensions, subtracting each trend from the corresponding column.A.
| Data types |
|
# n is the degree of the polynomial
+
scalar | "constant" | "linear"
Details
The degree of a polynomial given as a non-negative integer scalar, or as "constant" (equivalent to 0) or "linear" (equivalent to 1).
# bp — reference points
+
vector
Details
The anchor points define data segments defined as a vector, which can contain:
-
The values of the counts indicating the location of the reference points. The values are either contained in the default vector
[1 2 3 …], or are specified by the "name-value" argumentSamplePoints. -
Logical values, where the logical
1(true) indicates a reference point in the corresponding input data element. IfbpIf it contains boolean values, then they must have the same length as the reference points.
Pivot points are useful when you need to calculate individual trends for different data segments.
| Data types |
|
# nanflag — condition for missing value
+
"includemissing" (default) | "includenan" | "omitmissing" | "omitnan"
Details
The condition for missing a value, set as:
-
"includemissing"or"includenan"takes into account the valuesNaNinAwhen calculating the trend. If any element is in the working dimension —NaN, then the corresponding elements inD—NaN. Values"includemissing"and"includenan"they behave the same way. -
"omitmissing"or"omitnan"ignore valuesNaNinAwhen calculating the trend. If all the elements are in the working dimension —NaN, then the corresponding elements inD—NaN. Values"omitmissing"and"omitnan"they behave the same way.
Name-value input arguments
Specify optional argument pairs in the format Name=Value, where Name — the name of the argument, and Value — the appropriate value. Type arguments Name=Value they should be placed after the other arguments, but the order of the pairs does not matter.
# Continuous — limitation of continuity
+
"true" | "false"
Details
A continuity constraint set to one of the following values:
-
"true"— the selected trend should be continuous everywhere. -
"false"— the selected trend may contain gaps.
# SamplePoints — reference points
+
scalar | vector
Details
A vector containing the coordinates of the data (reference points) along the axis , which must be sorted and contain unique elements. The distance between the reference points does not have to be the same. Vector [1 2 3 …] used by default.
| Data types |
|
Output arguments
# D — output data
+
vector | the matrix | multidimensional array | table
Details
The output data returned as a vector, matrix, multidimensional array, or table.
| Data types |
|
Examples
Continuous linear trend
Details
Create a data vector and remove the continuous linear trend. Let’s plot the initial data, the data with the excluded trend, and the linear trend.
import EngeeDSP.Functions: detrend

t = 0:20
A = 3 * sin.(t) .+ t

D = detrend(A)

plot(t, A, label="Input Data", linewidth=2)
plot!(t, D, label="Detrended Data", linewidth=2)
plot!(t, A - D, linestyle=:dash, color=:black, label="Trend", linewidth=2)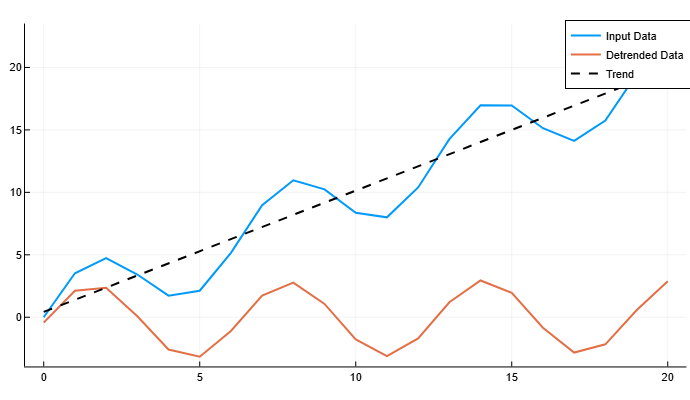
Recommendations
Function detrend subtracts the average value or the line of best fit (least squares) from the data. If your data is tabular, contains several columns of data, and is a table or graph, then detrend processes each column of data separately.
Removing a trend from the data allows you to focus the analysis on fluctuations in the data relative to this trend. A linear trend usually indicates a systematic increase or decrease in data. A systematic shift may be caused, for example, by sensor drift. Although trends can be significant, some types of analysis provide deeper insights after trends are removed.
The purpose of removing trend effects from the data often depends on the purpose of the analysis.