Getting started with Digital Signal Processing (DSP) in Engee
Working with functions
Signal loading and visualization
Function using makes the listed modules available to the user, similar to the function import in other languages:
| It is not necessary to enclose multiple outputs in parentheses, as in MATLAB. |
using DSP, WAV
plotly()
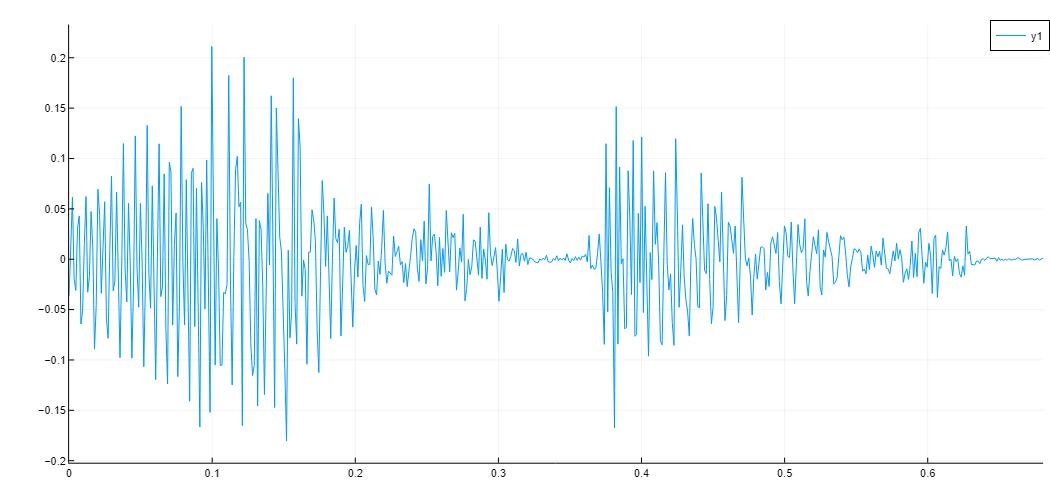
s, fs = wavread("/user/test.wav")
plot(0:1/fs:(size(s,1)-1)/fs, s)Output
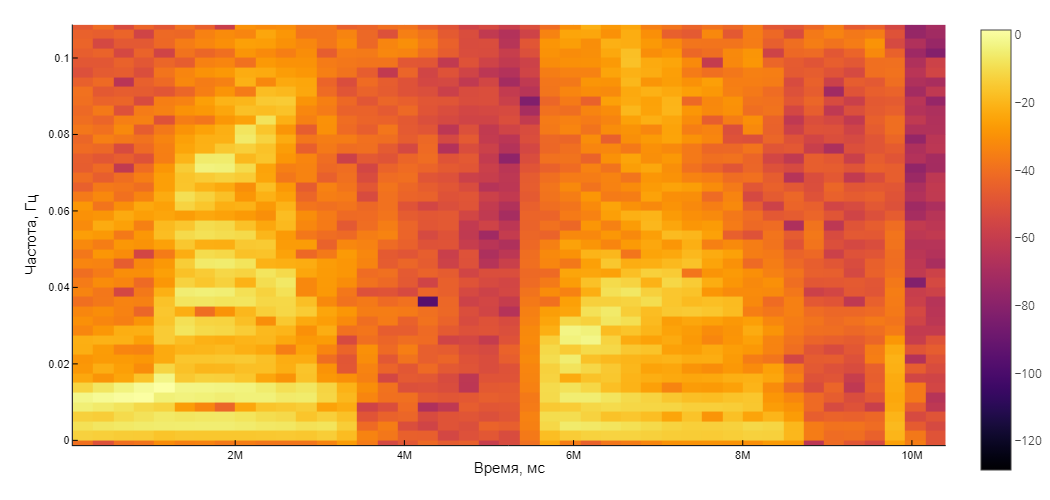
The function below accepts a spectrogram with standard parameters for speech (Hanning windows 25 ms, overlap 10 ms), builds and returns a spectrogram:
S = spectrogram(s[:,1], convert(Int, 25e-3*fs), convert(Int, 10e-3*fs); window=hanning)
Plots.heatmap(S.time.*1000, S.freq, pow2db.(S.power), xguide = "Time, ms", yguide = "Frequency, Hz")
Output

Signal processing
Now let’s pass the signal through the filter to simulate the bandwidth of the phone, and build its spectrogram again.:
responsetype = Bandpass(300, 3400; fs=fs)
prototype = Butterworth(8)
telephone_filter = digitalfilter(responsetype, prototype)
Let’s look at the characteristics of the filter:
| Variables can have Unicode names. This is typed as \omega + tab. |
ω = 0:0.01:pi
H = freqz(telephone_filter, ω)
Filtering our signal:
sf = filt(telephone_filter, s)

Sf = spectrogram(s[:,1], convert(Int, 25e-3*fs), convert(Int, 10e-3*fs); window=hanning)
Plots.heatmap(Sf.time.*1000, Sf.freq, pow2db.(Sf.power), xguide = "Time, ms", yguide = "Frequency, Hz")
Output
Reproducing the results
using Base64

function audioplayer(filepath)
  markup = """<audio controls="controls" {autoplay}>
        <source src="$filepath" />
        Your browser does not support the audio element.
        </audio>"""

  display(MIME("text/html") ,markup)
 end

 function audioplayer(s, fs)
  buf = IOBuffer()
  wavwrite(s, buf; Fs=fs)
  data = base64encode(unsafe_string(pointer(buf.data), buf.size))
  markup = """<audio controls="controls" {autoplay}>
        <source src="data:audio/wav;base64,$data" type="audio/wav" />
        Your browser does not support the audio element.
        </audio>"""
  display(MIME("text/html") ,markup)
end

audioplayer(s, fs)
audioplayer(sf, fs)
Output
Signal oversampling
In this example, we will consider resampling an audio signal from a frequency. 48 kHz on the frequency 44.1 kHz using the development of a low-pass filter followed by signal oversampling.
Let’s find the coefficients of interpolation and decimation.
using Plots
using DSP

Fdat = 48e3;
Fcd = 44.1e3;
LM = Rational{Int32}(Fcd/Fdat);
L = LM.num;
M = LM.den;
(L,M)
Output
(147, 160)
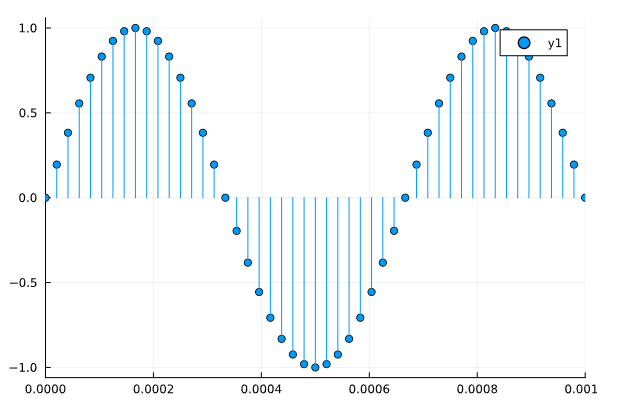
Visualize the original audio signal:
t = 0:1/Fdat:0.25-1/Fdat;
x = sin.(2*pi*1.5e3*t);
gr()
plot(t, x, line=:stem, marker=:circle)
xlims!((0,0.001))
Output
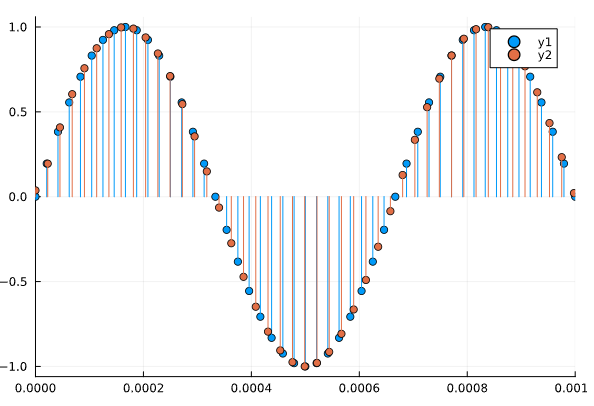
We will resample and superimpose the received signal on the original one.
f = (Fdat/2)*min(1/L,1/M)
win = DSP.Windows.kaiser(3579,3);
fir = DSP.Filters.digitalfilter(DSP.Filters.Lowpass(f/48e3),FIRWindow(win)).

xup = DSP.Filters.resample(x,Int64(L),fir);
y = L.*xup[1:M:end].

t_res = (0:(length(y)-1))/Fcd;
plot!(t_res, y, line=:stem, marker=:circle)
Output