rocsnr
Receiver performance curves for signal-to-noise ratio (SNR).
| Library |
|
Syntax
Function call
The rocsnr function can be called in the following ways:
-
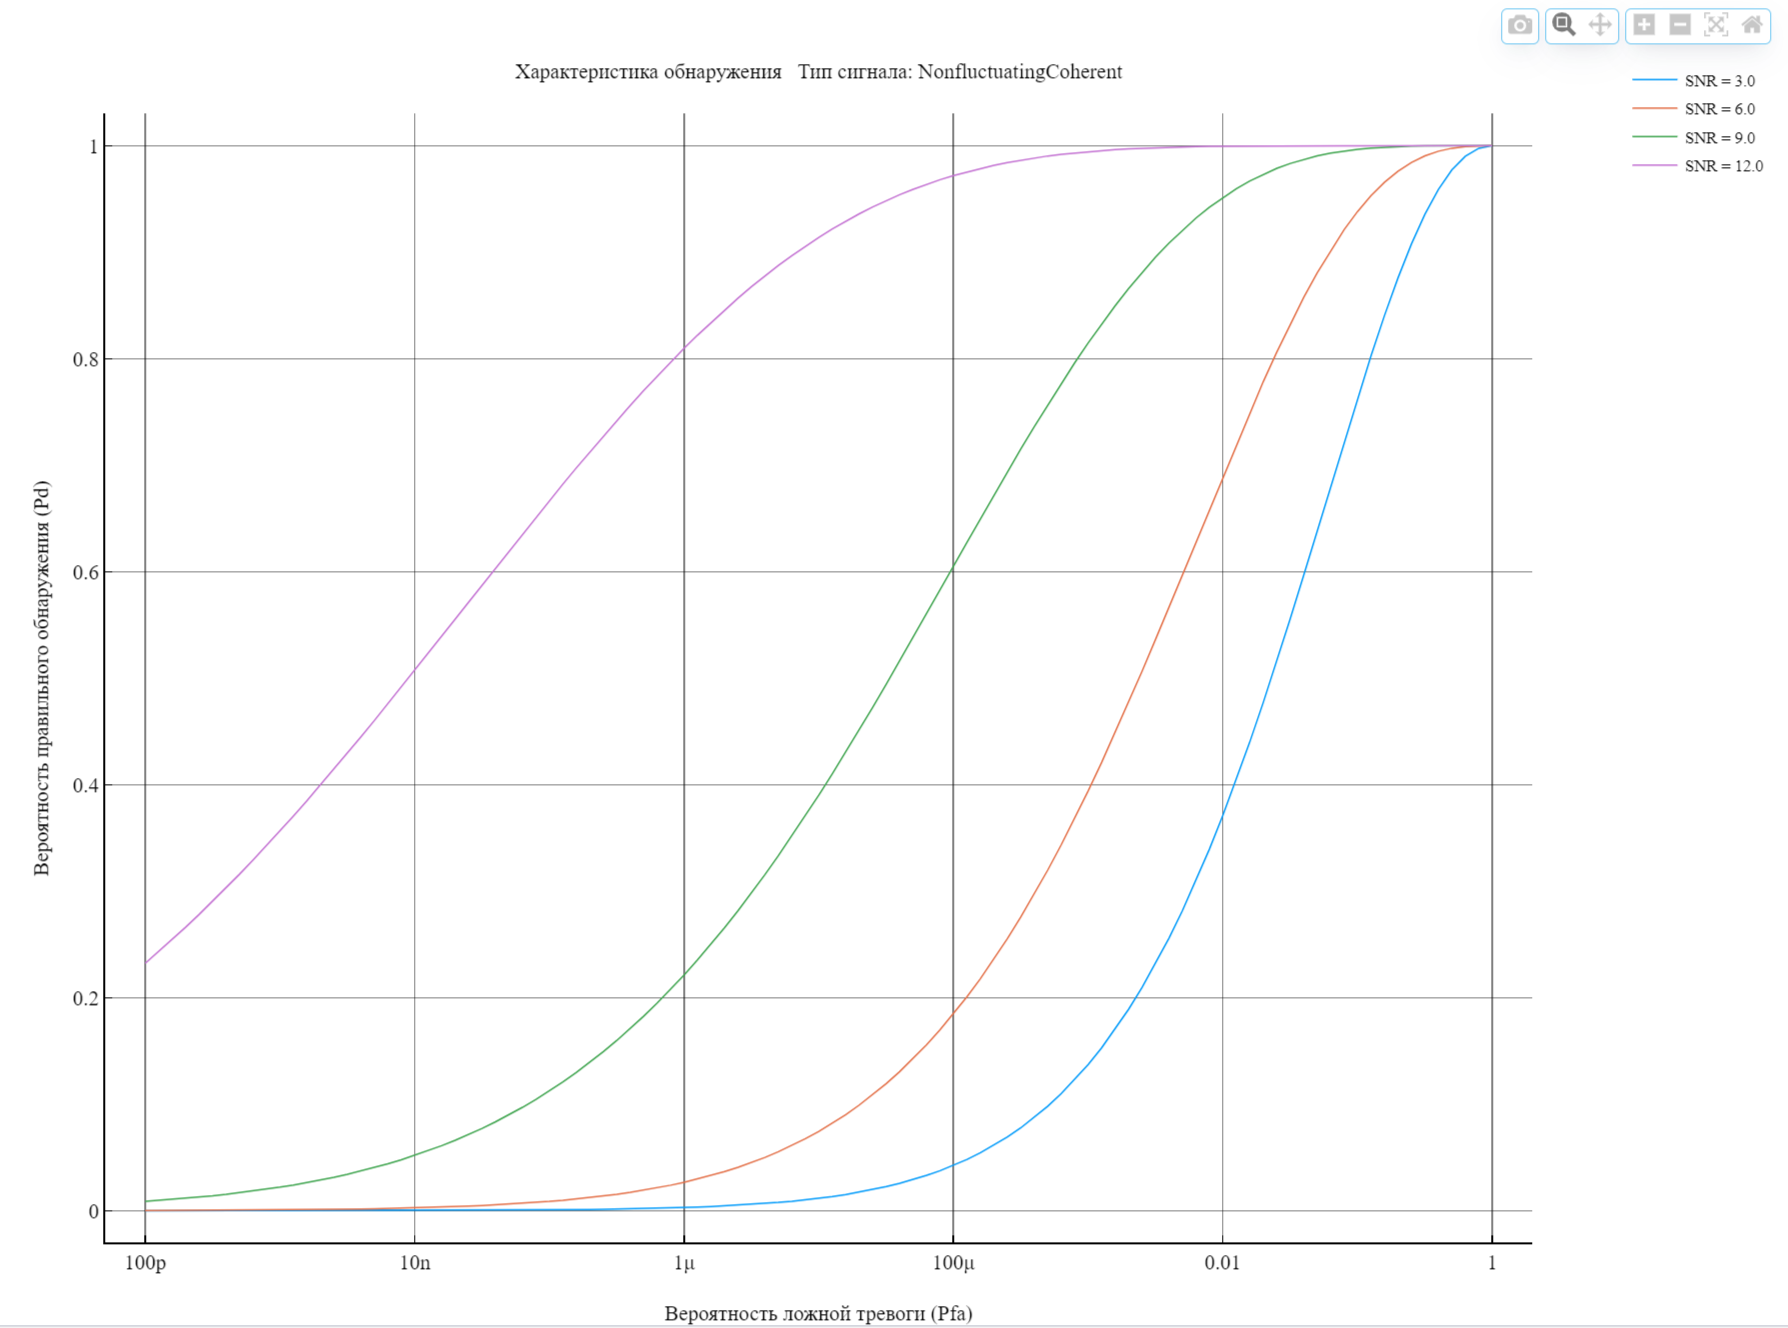
Pd,Pfa = rocsnr(1e-6, "Pd&SNR")returns single pulse detection probabilities, argument Pd, and false alarm probabilities, argument Pfa, for the signal-to-noise ratio (SNR) in the argument vector SNRdB with by default property values. By default, detection probabilities are calculated for each SNR for 101 false alarm probabilities ranging from 1e-10 to 1. The false alarm probabilities are logarithmically uniformly distributed. The ROC curve is plotted assuming a coherent receiver with an incoherent target.
Arguments
Entry
SNRdB -
signal-to-noise ratio
`vector'
Details
The signal-to-noise ratio in dB, specified as a vector of rows or columns.
Example: [3 6 9 9 12].
Data types: Float64
Arguments with value assignment Name=Value
Specify optional argument pairs in the form Name1=Value1,…,NameN=ValueN, where Name is the name of the argument and Value is the corresponding value. The arguments Name=Value must be placed after the other arguments, but the order of the pairs does not matter.
Example: MinPfa=1e-8,NumPoints=64,NumPulses=10.
MaxPfa — maximum false alarm probability to be included in the ROC calculation
1 (by default)| positive scalar
Details
The maximum false alarm probability to include in the ROC calculation, specified as a positive scalar.
Data types: Float64
MinPfa -
minimum false alarm probability to be included in the ROC calculation
1e-10 (by default)| positive scalar
Details
The minimum false alarm probability to include in the ROC calculation, specified as a positive scalar.
Data types: Float64
NumPulses -
number of pulses for integration
1 (by default) | `positive integer `
Details
The number of pulses to integrate for ROC curve calculation, set as a positive integer.
A value of 1 means no pulse integration.
Data types: Float64
NumPoints -
number of signal-to-noise ratio (SNR) values used in the calculation of ROC curves
101 (by default) | `positive integer'.
Details
The number of signal-to-noise ratio (SNR) values used in ROC curve calculation, specified as a positive integer.
The actual values are equidistant between the minimum and maximum noise levels.
Data types: Float64
SignalType — type of received signal
NonfluctuatingCoherent (By default) | NonfluctuatingNoncoherent | Real | Swerling1 | Swerling2 | Swerling3 | Swerling4
Details
This argument specifies the type of received signal or, equivalently, the probability density functions (PDF) used to calculate the ROC.
It is specified as one of the values:
-
Real. -
NonfluctuatingCoherent. -
NonfluctuatingNoncoherent -
`Swerling1
-
`Swerling2
-
`Swerling
-
`Swerling4
Values are not case sensitive.
The `NonfluctuatingCoherent' signal type assumes that the noise in the received signal is a complex Gaussian random variable. This variable has independent zero mean real and imaginary parts, each with variance under the null hypothesis. In the case of a single pulse in a coherent receiver with complex white Gaussian noise, the probability of detection, , for a given false alarm probability, , is equal to:
where and are the additive error function and its inverse function, and is the dimensionless signal-to-noise ratio (SNR).
Data types: char, string
Output
Pd -
detection probability
vector
Details
Detection probabilities corresponding to false alarm probabilities are returned as a vector. For each signal-to-noise ratio (SNR) in the arguments SNRdB, Pd contains one column of detection probabilities.
Pfa — probability of false positives
`column vector
Details
Probabilities of false positives returned as a vector of columns.
Probabilities of false positives returned as a column vector.
By default, the false alarm probabilities are 101 logarithmically equal values ranging from 1e-10 to 1.
To change the range of probabilities, use the optional input argument MinPfa or MaxPfa. To change the number of probabilities, use the optional input argument NumPoints.