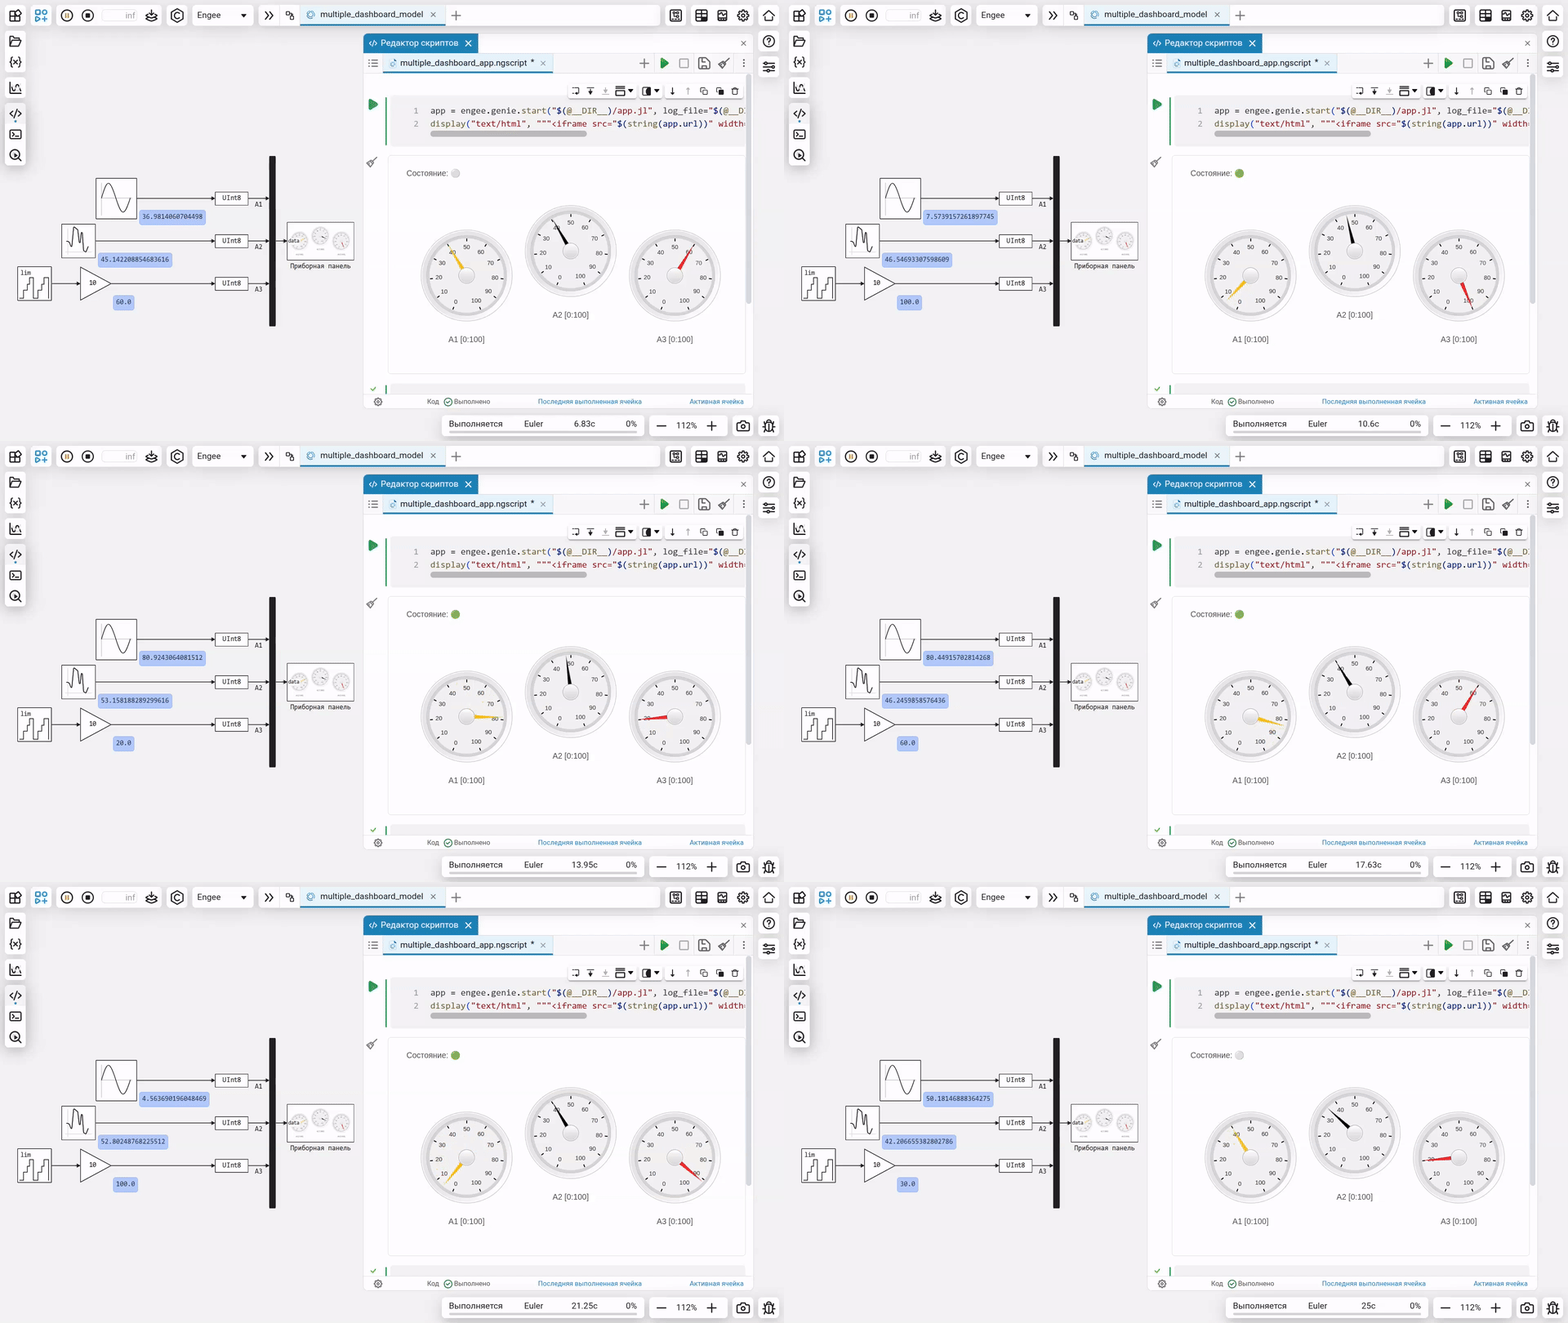
Panel with multiple devices
This project provides an example of organizing data transfer between an Engee model running in slow motion and a dashboard with multiple instruments.
Illustration of the work of the example
The collaboration of the model and the dashboard is shown in the video:

The dashboard can be opened in a separate window or embedded inside an interactive script, while all interactive elements will work and allow you to visualize the output data and work with the model in real time.
The model starts in the "Simulation speed control" mode.
The duration of the simulation is
infthus, the execution of the model can only be stopped by the user.
Run an example
To run the example, open and run the model multiple_dashboard_model.engee execute the following cell:
# Launch the server with the dashboard
app = engee.genie.start("$(@__DIR__)/app.jl", log_file="$(@__DIR__)/log.txt");
display("text/html", """<iframe src="$(string(app.url))" width="650" height="320" style="border: none;"></iframe>""";)

# Get a launch link in a separate window
# display("text/html", """<a href="$(string(app.url))" target="_blank" rel="noopener noreferrer">Open in a separate window</a>""")
To stop the server for debugging purposes:
# engee.genie.stop("$(@__DIR__)/app.jl");
In case of problems
Given that the UDP protocol is used for communication and services communicate via localhost, communication between the dashboard and the model should be very reliable and very fast.
If you find slowdowns and missing values, the first step is to close the model and reopen it.
Conclusion
The presented project allows you to derive several values from the model and track their cumulative dynamics on different indicators.