Creating a dashboard (Engee application)
We are examining the process of developing a dashboard that receives data from a real-time model and is implemented as a separate application.
Description of the example
The Engee platform provides many tools that allow you to create a variety of automation tools for controlling models: indicators, remotes… Among them:
-
Code Cell Masks to manage the model
-
Virtual Instruments (blocks for the graphical canvas)
-
[The ability to host custom applications] (https://engee.com/helpcenter/stable/en/feature/genie-engee.html (there is a course on this topic)
In this example, we will look at the process of creating graphical indicators for virtual dashboards. Another example on this topic illustrates how to control the execution of a model using software control commands (how to implement a button that starts the model for execution).
The virtual dashboard will run on the Engee platform as a separate server, which will take some time to start up (several tens of seconds).
Description of the model
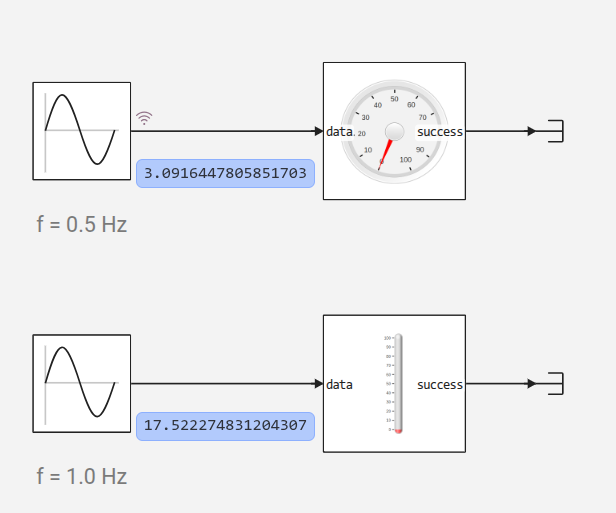
In this example, the indicators accept data in the range from 0 to 100. Values outside this range are clipped. As the default numeric format in Engee is Float64, the code in the value-sending blocks is designed to transmit 8-byte packets (64 bits). The model has ‘Instant indication’ enabled (Debugging panel in the model settings) to verify that the indicators are functioning correctly, as well as ‘Simulation speed control’ mode, which allows you to slow down the model’s time to ‘real-time’ execution.
Communication between the model and the devices takes place via the ‘ Engee Function ’ blocks, which accept input data and provide a signal confirming successful transmission. Upon request from the dashboard (the Clear To Send signal), the blocks located on the model send updated data for display.
Configuring a UDP connection
Data transfer between the model and the dashboard is carried out via the UDP protocol.
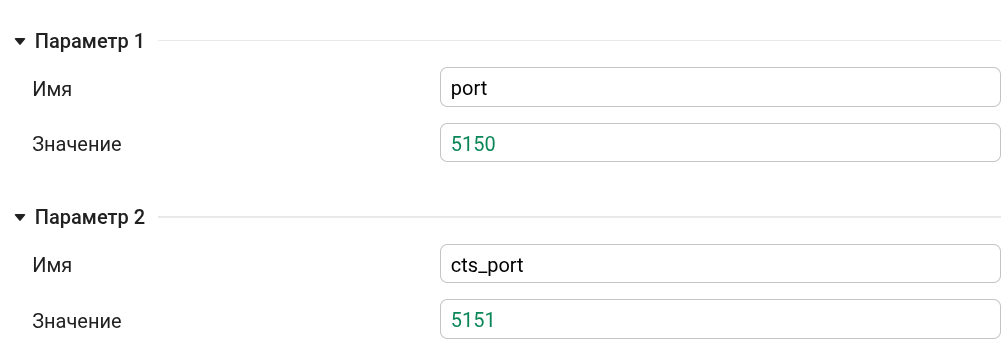
To avoid conflicts, each device requires the creation of two UDP connections. On the first connection (to the port specified by the parameter port), 8 bytes of data are sent. The second connection operates in the opposite direction: the ‘ Engee Function ’ block opens a connection on port cts_port (from ‘Clear To Send’) and waits for the ‘Clear To Send’ (CTS) message to be received, indicating that the dashboard is ready to receive data.
On the model side, these settings are indicated in the Parameters of each block and the indicator icon. You can view them by looking under the blocks’ mask.
Creating an indicator panel
There are two independent indicators on the dashboard.
The logic for updating information, the model of the graphical part of the application, and the ports for receiving data are specified in the application code. app.jl.
-
The left indicator waits for data on port 5050 and sends a CTS signal to port 5051,
-
The right indicator receives data on port 5052 after sending a CTS message to port 5053.
As for the graphical model of indicators, the description of each indicator’s components includes attributes associated with reactive variables. As soon as the reactive string variable receives an updated value, the associated component is updated automatically. For example, here is the line specifying the attributes of the arrow on the left-hand indicator:
path(d="m21.287 24.405-6.1832 13.013 4.5464-13.716z", style="fill:#f00;stop-color:#000000;transition: transform .2s linear", transform! = "circular_gauge_string")
Note the property
transform! = …``. The syntax!allows you to create reactive attributes in Julia, linking their update to the update of a variable from the data model.
As the devices are represented by SVG vector graphics elements, their size can be adjusted by modifying the values
widthandheightfor the containers in which they are located.
Launching the app
The application runs on a separate server on the Engee platform and is accessible at the address app.url. The page at this address can be opened directly in the output of the current cell or in a separate window.
app = engee.genie.start("$(@__DIR__)/app.jl", log_file="$(@__DIR__)/log.txt");
# display("text/html", """<iframe src="$(string(app.url))" width="600" height="450" style="border: none;"></iframe>""";)
Team display from the previous cell; if you remove the comment from this line, it allows you to open the dashboard within the script.
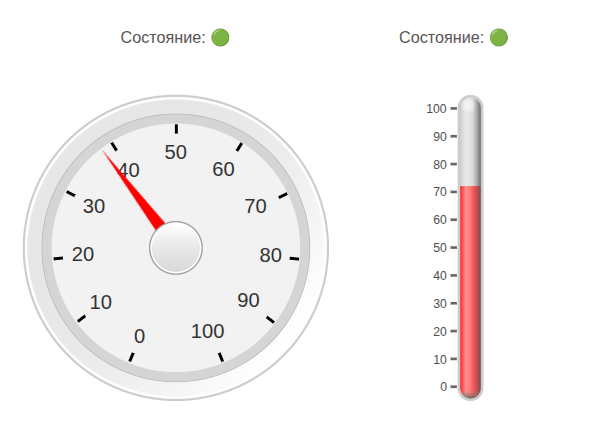
Once the server has finished running the application, this space will simply display the message “server is available”, so it is better to use static screenshots to include the interface in reports.
To obtain the link app.url and open it in a separate page, run the following cell. This link will also only work whilst the server running the application is active.
display("text/html", """<a href="$(string(app.url))" target="_blank" rel="noopener noreferrer">Open in a separate window</a>""")
To stop this server for debugging purposes or to restart it, remove the comment and run the following code:
# engee.genie.stop("$(@__DIR__)/app.jl");
Illustration of the dashboard’s operation
We have included a brief illustration of how this dashboard works:
Conclusion
We have reviewed a project that clearly illustrates the process of developing a custom dashboard that receives data from the Engee model in real time.