How to use Python in Engee
In this example, we will look at the principles of interacting with Python from the Engee environment, using the .ipynb file format, and conduct several exercises with graphs.
Getting started
Importing computing (NumPy) and graphics (matplotlib) libraries:
In [ ]:
import matplotlib.pyplot as plt # Charting Package
import numpy as np # A fundamental package for scientific computing
Plotting graphs
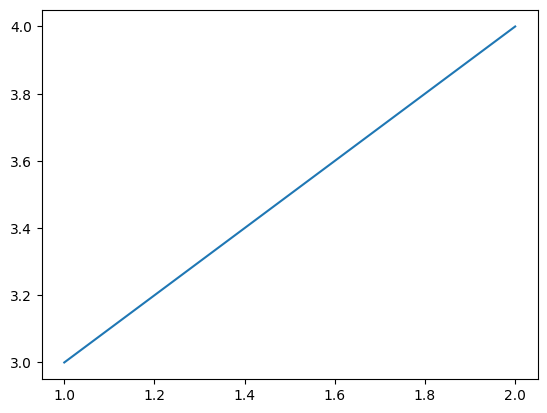
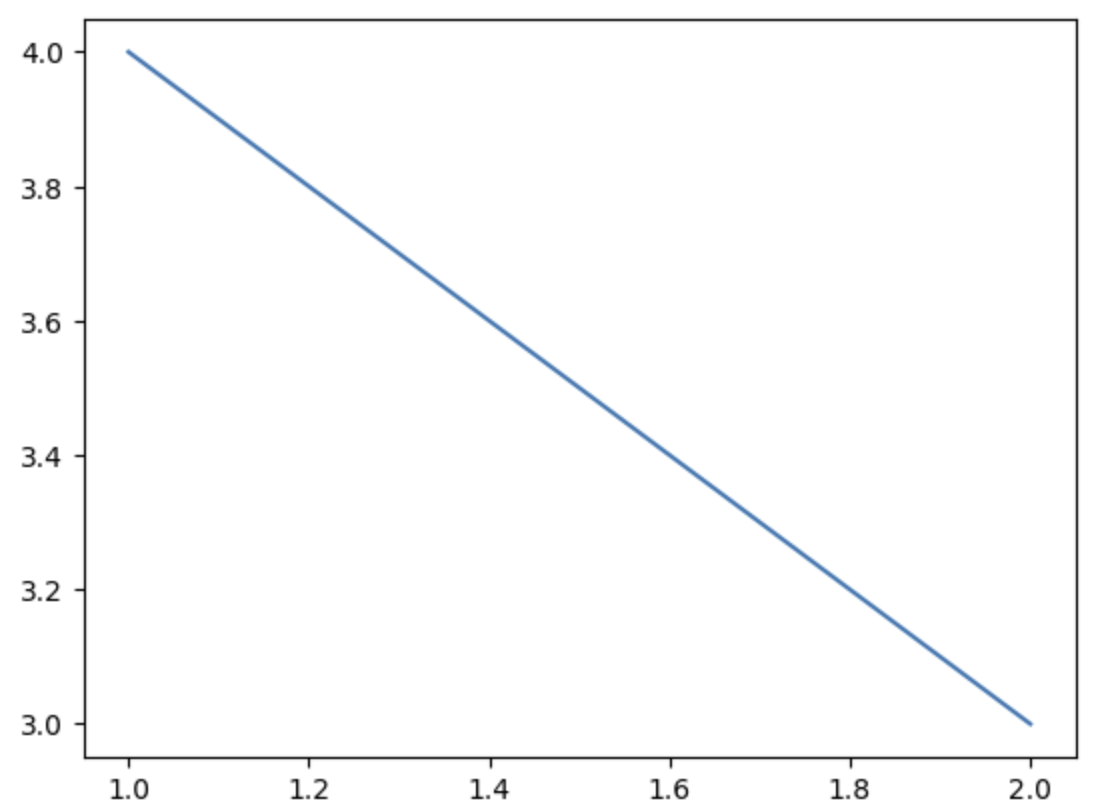
Plotting graphs by points:
In [ ]:
plt.plot([1, 2], [3, 4]) # Drawing an ascending graph
plt.show() # Displaying all previously described graphs
plt.plot([1, 2], [4, 3]) # Drawing a descending graph
plt.show()

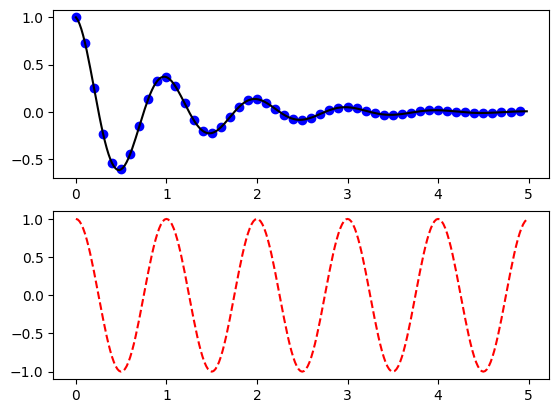
Building multiple graphs
Declaring a function for plotting graphs.
In [ ]:
def f(t):
    return np.exp(-t) * np.cos(2*np.pi*t) # Mathematical formula
Declaring arrays.
In [ ]:
t1 = np.arange(0.0, 5.0, 0.1)
t2 = np.arange(0.0, 5.0, 0.02)
Plotting graphs.
In [ ]:
plt.figure() # Declaring a shape (Space for drawing a graph)
plt.subplot(211) # Announcement of the first of the two chart windows
plt.plot(t1, f(t1), 'bo', t2, f(t2), 'k')
plt.subplot(212)
plt.plot(t2, np.cos(2*np.pi*t2), 'r--')
plt.show()
.png)
Plotting graphs with keywords
Declaring a dictionary list.
In [ ]:
data = {'a': np.arange(50), # Returns evenly distributed values within the specified range.
        'c': np.random.randint(0, 50, 50), # Returns a random integer within the specified limits.
        'd': np.random.randn(50)} # The return of a sample (or samples) from a "standard normal" distribution.
data['b'] = data['a'] + 10 * np.random.randn(50) # Calculation b
data['d'] = np.abs(data['d']) * 100 # d taken modulo and multiplied by 100
Point drawing of the graph and the signature of the axes.
In [ ]:
plt.scatter('a', 'b', c='c', s='d', data=data) # A dot diagram of y versus x with different marker size and/or color.
plt.xlabel('entry a') # Sign the X-axis
plt.ylabel('entry b') # Sign the Y-axis
plt.show()

.png)
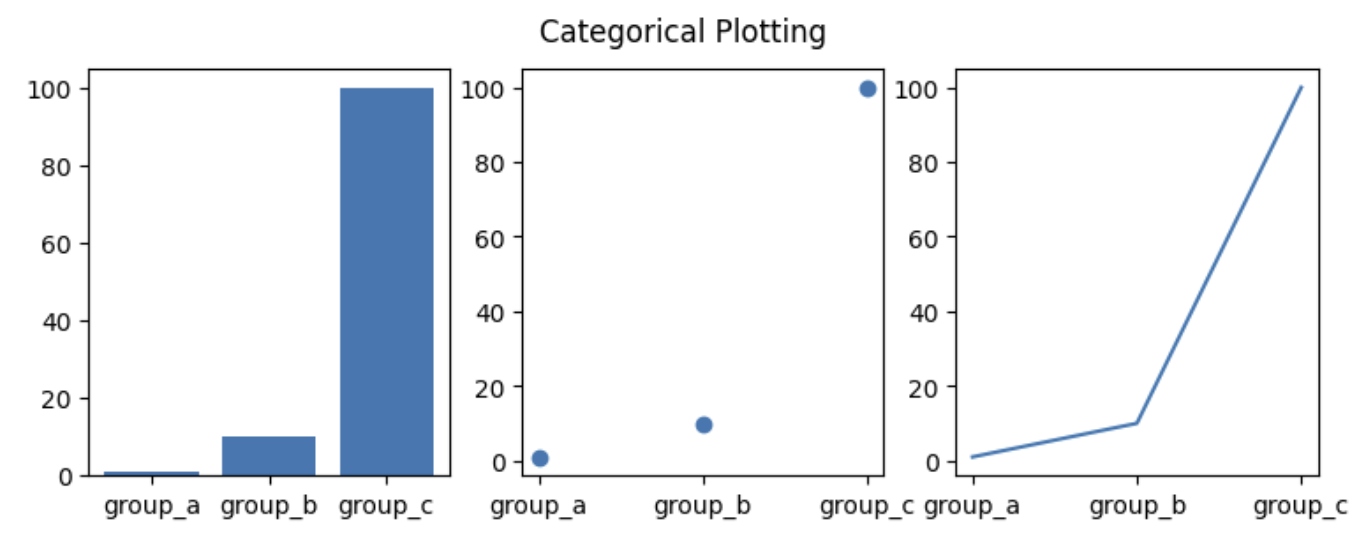
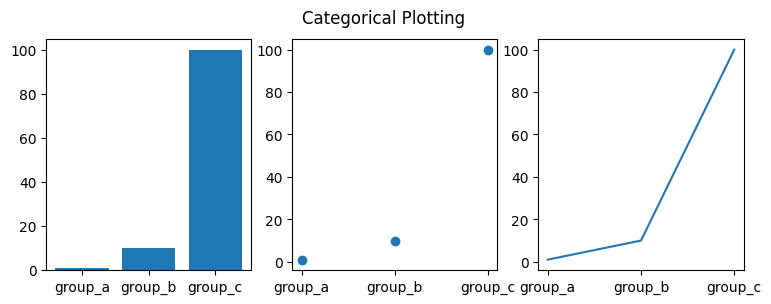
Plotting graphs for categorical data
Declaring arrays of data and an array of category names.
In [ ]:
names = ['group_a', 'group_b', 'group_c'] # Array of strings
values = [1, 10, 100] # An array of numbers
In [ ]:
plt.figure(figsize=(9, 3))
plt.subplot(131)
plt.bar(names, values)
plt.subplot(132)
plt.scatter(names, values)
plt.subplot(133)
plt.plot(names, values)
plt.suptitle('Categorical Plotting')  # Chart Title Announcements
plt.show()
.png)
Conclusion
In this example, we demonstrated the capabilities of Engee in writing and implementing algorithms in Python. In the modern world, this feature is relevant due to the volume of functionality implemented in Python and its popularity.