KPM RHYTHM: real-time monitoring
This example examines the execution of a model on a KPM RHYTHM with task time control (TET): the TET variable is displayed on a graph interactively, the same values are analyzed from a profiling file, and, in addition, RHYTHM reactions to overflows of the model calculation step are tested.
Introduction
After configuring the RHYTHM real-time machine and its working environment, you can proceed directly to the application of rapid prototyping and/or semi-natural modeling technologies. These and other approaches are based on real-time testing.
Real—time testing is the study of the functioning of a system (or its components) in real—world operating conditions - at a given sampling rate, with effects that occur when working with real equipment and interfaces, taking into account the synchronization of various tasks performed. Real-time testing is used in technologies for rapid prototyping of a control algorithm (or Rapid Prototyping), semi-natural modeling of a control object (also known as HIL, or Hardware-in-the-Loop), as well as in applications to data collection and signal processing.
As follows from this definition, real-time testing is ensured by observing the calculations with a specified sampling period - the step of calculating the model. Accordingly, during KPM RHYTHM modeling, it is necessary to evaluate and monitor the task execution time (TET, or Task Execution Time), as well as manage the execution of the RHYTHM model in case of non-compliance with real-time testing conditions.
To solve these problems, Engee has several features and tools that we will use later in the current example.
Model Overview
The model of this example is based on the model from the example KPM RHYTHM: Quick Start. The difference lies in the block РИТМ Время выполнения, which can be found in the library of blocks: РИТМ -> RITM Utilities -> RITM Task Execution Time -> RITM-TET.
Below is an example model with a block RITM-TET.
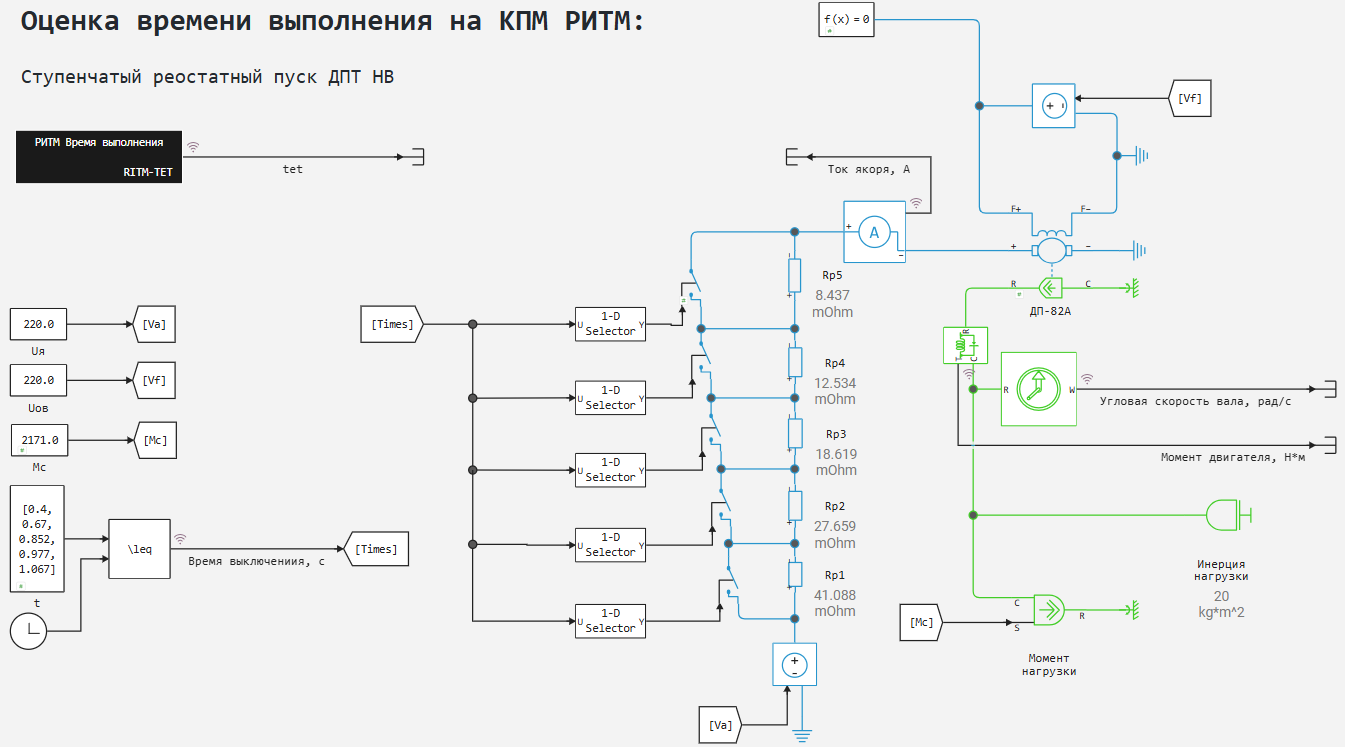
The signal tet at the block output RITM-TET let's write it down for analysis in the graph window Engee.
Modeling in Engee of this system was considered in the previous example, therefore, in the current example, modeling will be considered only on KPM RHYTHM in the [interactive execution] mode1.
Calculation of the execution time
After switching the calculation space from Engee to KPM RHYTHM, open model settings and enable the TET calculation:
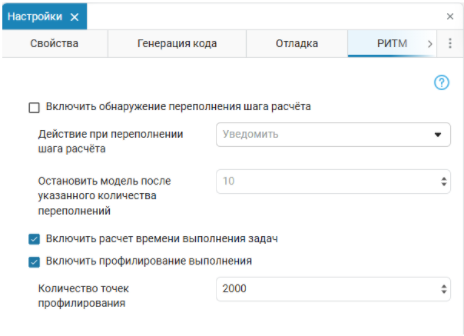
We will also enable profiling and set the number of profiling points. This will allow us to save the TET values to a text file in the KPM RHYTHM memory. Model Execution Time - , the calculation step - . To save all the TET values during the simulation process, you need to set 2000 profiling points.
Simulation results
After starting the execution of the model on the KPM, the RHYTHM is interactive at the block output. RITM-TET The following signal change can be observed:
The Engee graph builder has the necessary functionality for primary graph analysis. For a more detailed, accurate and visual analysis of the task execution time, we can go to the KPM RHYTHM command shell and read the model profiling file. ritm_dcm_get_tet_profile.txt. Let's save the model profiling file and analyze the execution time data using the julia code shown below.
Model execution time analysis
Let's connect a script with an auxiliary function for reading format files.txt to a vector variable:
# Connecting the script
include("$(@__DIR__)/txt_to_vector.jl");

# Getting a vector of values from a file
tet = TxtToVec("$(@__DIR__)/ritm_dcm_get_tet_profile.txt");

# The step of calculating the model
StepTime = 1e3; # The ISS
We will install libraries and import modules for data analysis and display.
Pkg.add(["StatsBase", "Printf"])
import StatsBase.mean, Printf.@printf
We will display messages with data on the analyzed sample, minimum, average and maximum values, as well as the percentage of the execution time of the model and the calculation step of the model.
@printf "Number of profiling points: %d\n\n" length(tet)

@printf "Minimum TET: %.3f microseconds" tet_min = (minimum(tet)/1000)
@printf "Average TET: %.3f microseconds" tet_mean = (mean(tet)/1000)
@printf "Maximum TET: %.3f microseconds\n\n" tet_max = (maximum(tet)/1000)

print("The TET range relative to the model calculation step, %: ")
@printf "%.1f - %.1f" tet_min/StepTime*100 tet_max/StepTime*100
As previously determined, we have obtained the specified number of profiling points.
For clarity, you can also present the data graphically.:
gr(legend=:right, title="Execution time of the \n model on KPM RHYTHM",
    xlabel="Model time, ms", ylabel="Lead time, mks")
plot(tet./1000;  label="TET")
plot!([0, 2000], [tet_min,  tet_min];  label="TET_MIN",   color=:green)
plot!([0, 2000], [tet_mean, tet_mean]; label="TET_MEAN",  color=:purple)
plot!([0, 2000], [tet_max,  tet_max];  label="TET_MAX",  color=:red)
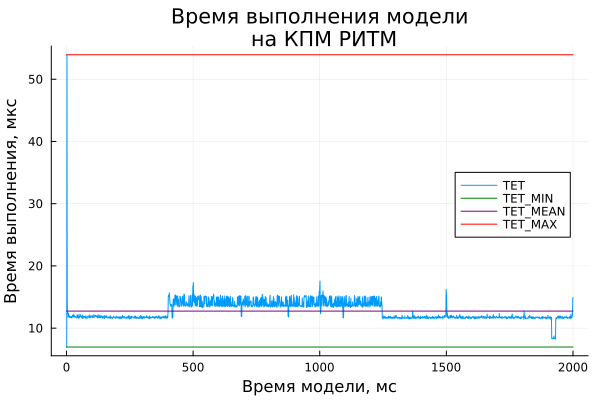
As a result of the analysis, we found that the execution time of the model does not exceed its calculation step. However, with a smaller step - for example, or, even more so The calculation of the model on the KPM RHYTHM will partially or completely not correspond to the principle of real-time testing.
In a real-time operating system (RTOS) RHYTHM.Real time and Engee have tools that allow monitoring and monitoring of model calculation in real time.
Overflow of the calculation step
To test the possibilities of real-time testing control, we will set the calculation step in the example model at the level of .
To control the overflow of the calculation step in the model settings in the RHYTHM section, enable the overflow detection of the calculation step. First, let's define the overflow action of the calculation step as "Notify". If the calculation step overflows, the graphical interface RITM.Monitor will display the corresponding messages in the Application Log window. - Overrun detected: rate #0, model time ...! However, this will not prevent KPM RHYTHM from executing the model up to the end simulation time.
.png)
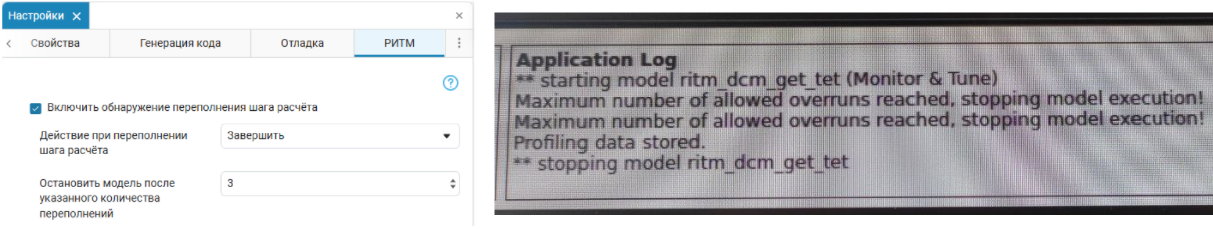
If the overflow action of the calculation step is set to "Finish" and the number of allowable overflows is specified, the execution of the RHYTHM model will be automatically stopped when the set number of overflows is reached. RITM.Monitor will display messages in the Application Log window for this case when the maximum number of allowed overflows has been reached. - Maximum number of allowed overruns reached, stopping model execution! and stopping the model.
.png)
Conclusion
In the example, we examined the available tools and capabilities for monitoring task execution time in RTOS RHYTHM.Real time, block library and settings Engee for RHYTHM. These functions allow you to better adjust the settings of the model and/or optimize the model itself for its execution in real time.