MATLAB / Simulink UHD API
MATLAB UHD API
To ensure the interaction of MATLAB with the RITM SDR USRP platform, an installed hardware support package Communications Toolbox Support Package for USRP Radio is required. This toolkit allows you to simulate signals, their subsequent transmission to an SDR device, as well as receiving and analyzing data using the usage of a developed set of processing tools available in MATLAB.

After installing the hardware support package, you can start developing the script. The algorithm of operation is identical to the examples from other sections: a harmonic signal is transmitted to the transmitter with subsequent reading and visualization of data in the time and frequency domains.
First of all, the initialization of the global parameters of the system is performed, such as the clocking frequency (Master Clock Rate), sampling rate, frame size and carrier frequency:
masterClockRate = 60e6;
sampleRate = 4e6;
samplesPerFrame = 1024*5;
centerFreq = 2.0e9;
Next, system objects are created to control the transmitting (TX) and receiving (RX) paths of the RITM SDR USRP. The device address, interpolation and decimation coefficients, gain levels and antenna ports are specified in the parameters:
tx = comm.SDRuTransmitter(...
'Platform', 'E320', ...
'IPAddress', '192.168.2.100', ...
'MasterClockRate', masterClockRate, ...
'InterpolationFactor', masterClockRate/sampleRate, ...
'CenterFrequency', centerFreq, ...
'Gain', 7);

rx = comm.SDRuReceiver(...
'Platform', 'E320', ...
'IPAddress', '192.168.2.100', ...
'MasterClockRate', masterClockRate, ...
'DecimationFactor', masterClockRate/sampleRate, ...
'SamplesPerFrame', samplesPerFrame, ...
'CenterFrequency', centerFreq, ...
'Gain', 60, ...
'OutputDataType', 'double', ...
'ReceiveAntennaPort','TX/RX');
The next step is to adjust the sinusoidal signal. Its operating frequency, sampling rate, output format (complex signal) and data type are determined:
sineFreq = 1e5;
sineGen = dsp.SineWave(1, sineFreq, ...
    'SampleRate',       sampleRate, ...
    'SamplesPerFrame',  samplesPerFrame, ...
    'ComplexOutput',    true, ...
    'OutputDataType',   'double');
txSignal = sineGen();
To visualize the received information, the objects of the oscilloscope (timescope) and the spectrum analyzer (spectrumAnalyzer) are initialized. For them, the display time interval, the method for estimating the power spectral density, and the axis boundaries are set:
tScope = timescope(...
    'SampleRate',       sampleRate, ...
    'TimeSpan',         5/sineFreq, ...
    'Name',             'Осциллограмма принятого сигнала', ...
    'YLimits',          [-0.5, 0.5]);
sAnalyzer = spectrumAnalyzer(...
    'SampleRate',       sampleRate, ...
    'Method',           'Welch', ...
    'Title',            'Спектр принятого сигнала', ...
    'YLimits',          [-120, 0]);
In the main cycle of the program, a continuous process of transmitting the generated signal, receiving data from the air and their operational output to graphical panels for subsequent analysis is implemented:
while 1
    tx(txSignal);
    [rxSignal, len] = rx();
    if len > 0
        tScope(rxSignal);
        sAnalyzer(rxSignal);
    end
end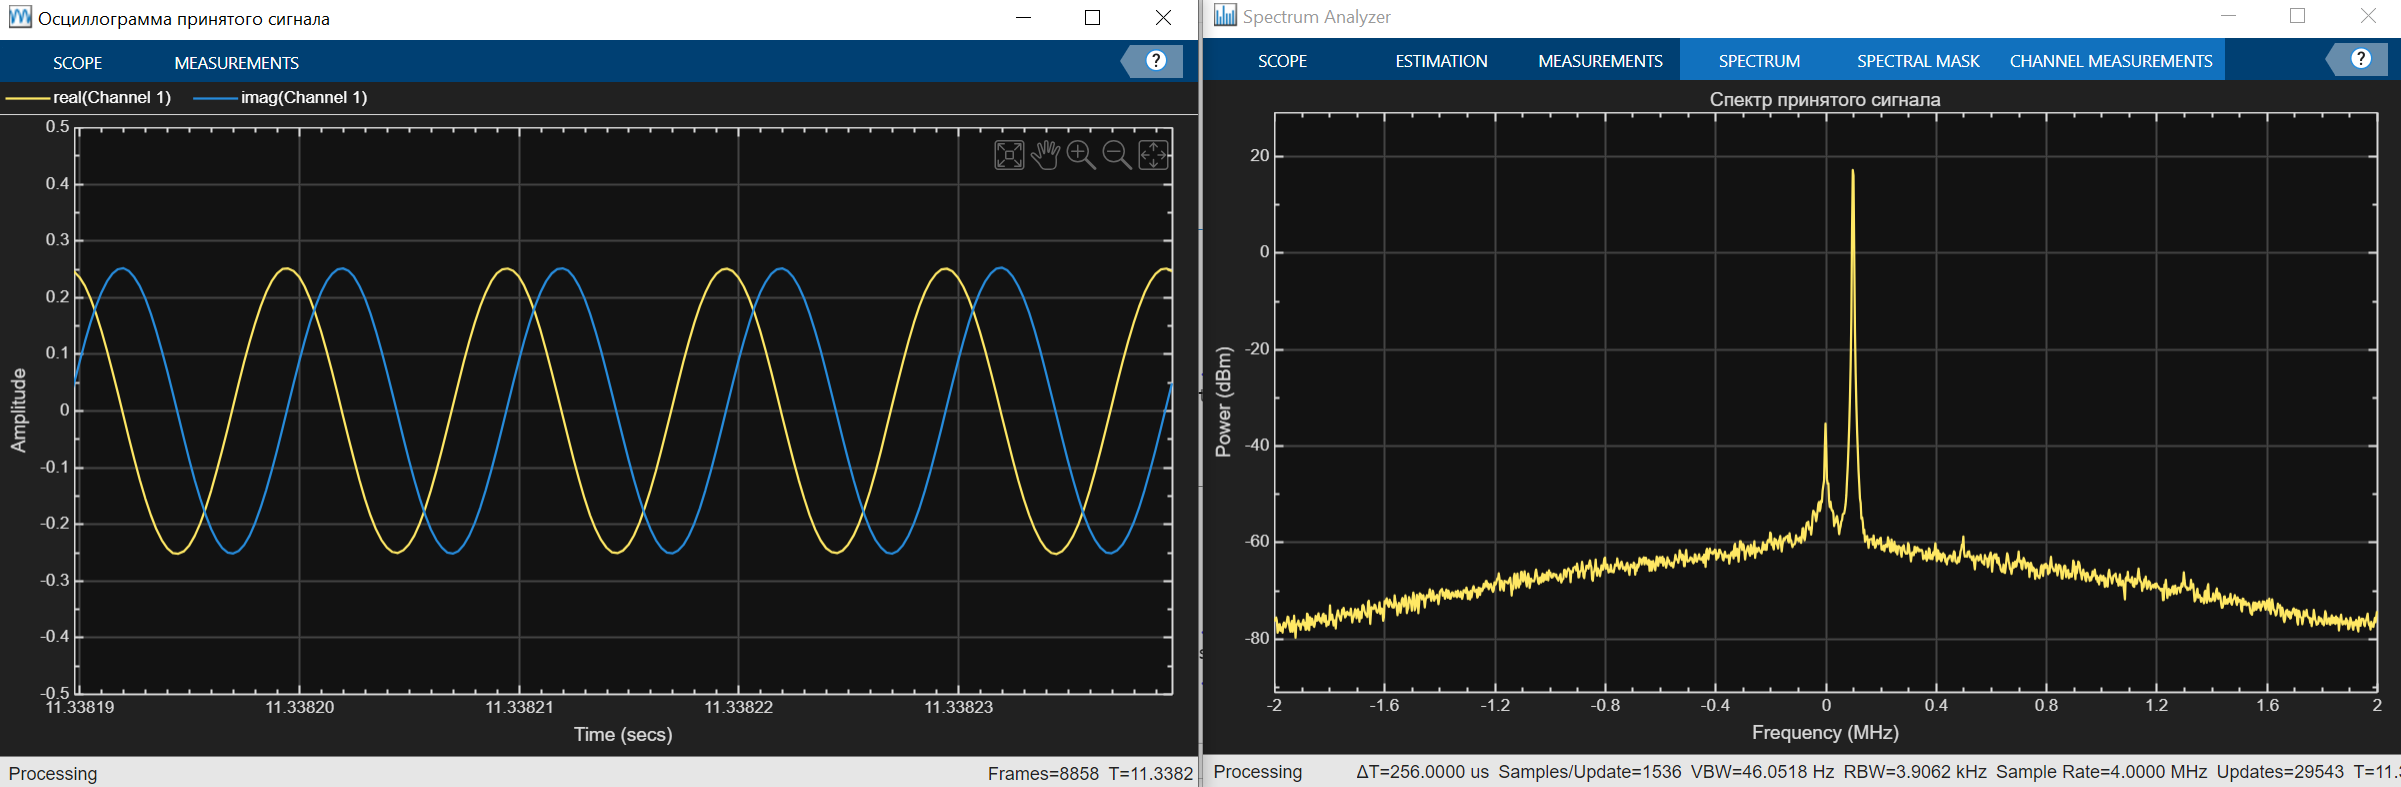
To complete the program, press the button Stop on the top toolbar of the Editor tab. To break the connection to the RITM SDR USRP platform correctly, execute the following code:
release(tx);
release(rx);
release(tScope);
release(sAnalyzer);
Usage of the function release For system objects, the UHD protocol is mandatory. Without calling this method, the correct release of resources and disconnection from the RITM SDR USRP are impossible.
|
Simulink UHD API
To ensure the interaction of Simulink with the RITM SDR USRP platform, an installed hardware support package Communications Toolbox Support Package for USRP Radio is required. After the installation is completed, it becomes possible to design models using the RITM SDR USRP platform usage.
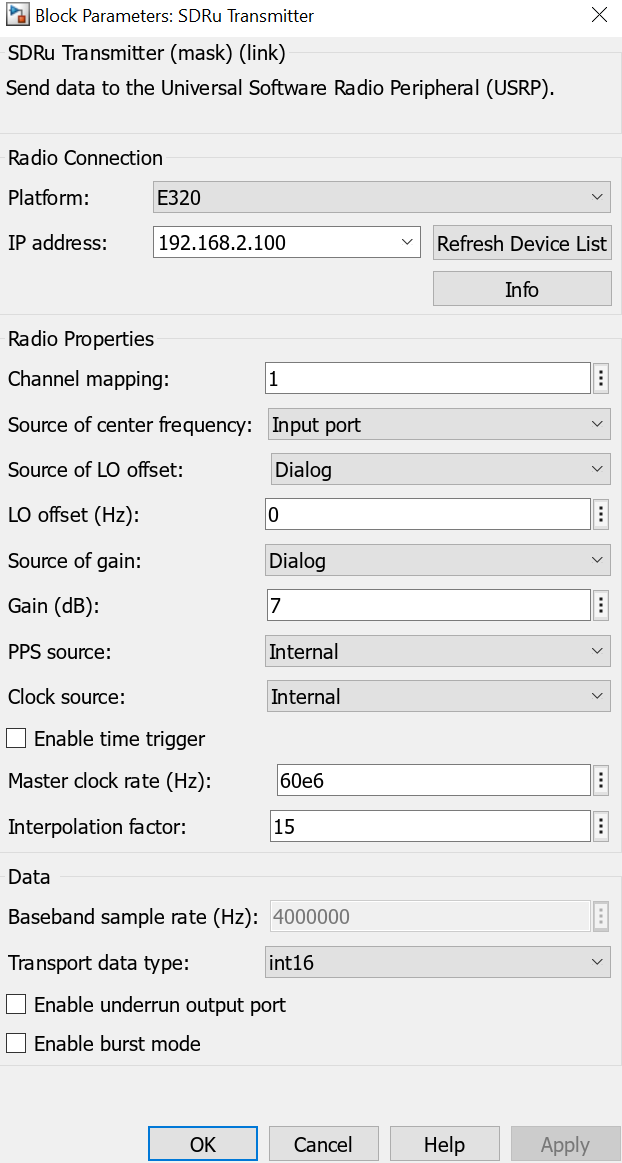
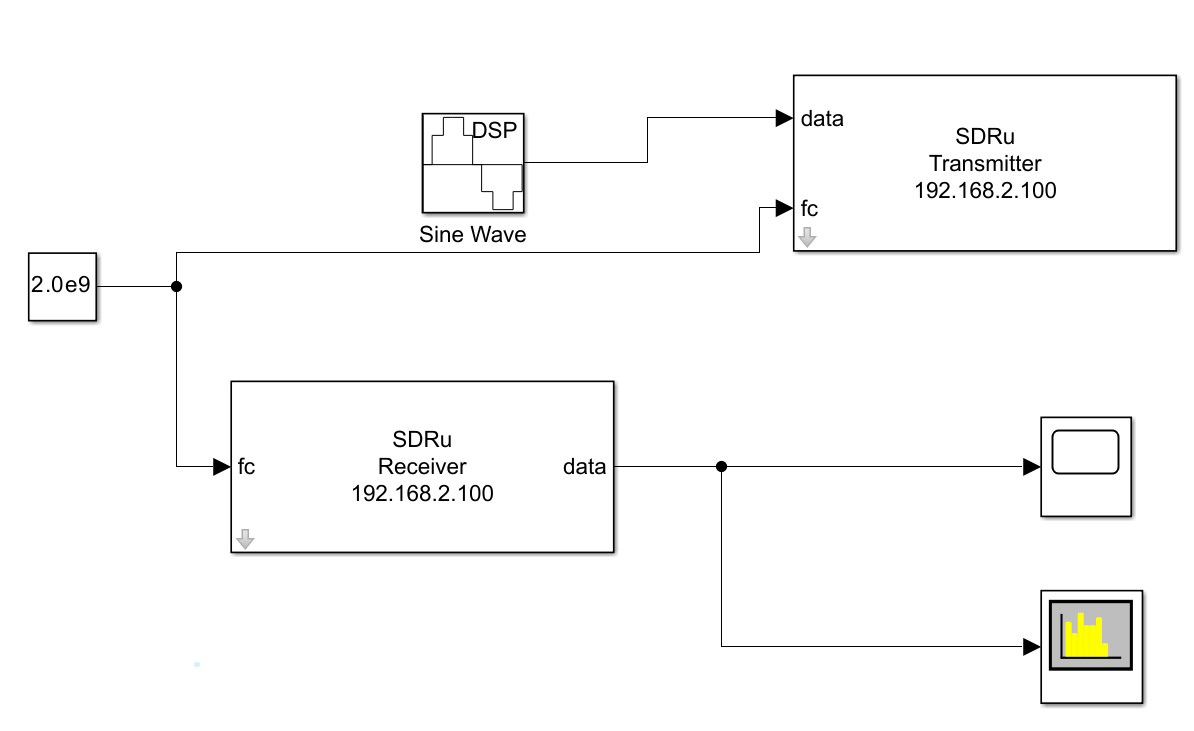
At the initial stage, it is necessary to initialize the harmonic oscillator Sine Wave, the parameters of the settings of this unit are shown in the image below. Also, the SDRu Transmitter unit should be included in the model (the corresponding parameters are listed below). The output port of the sine wave generator is connected to the input port of the SDRu Transmitter unit.
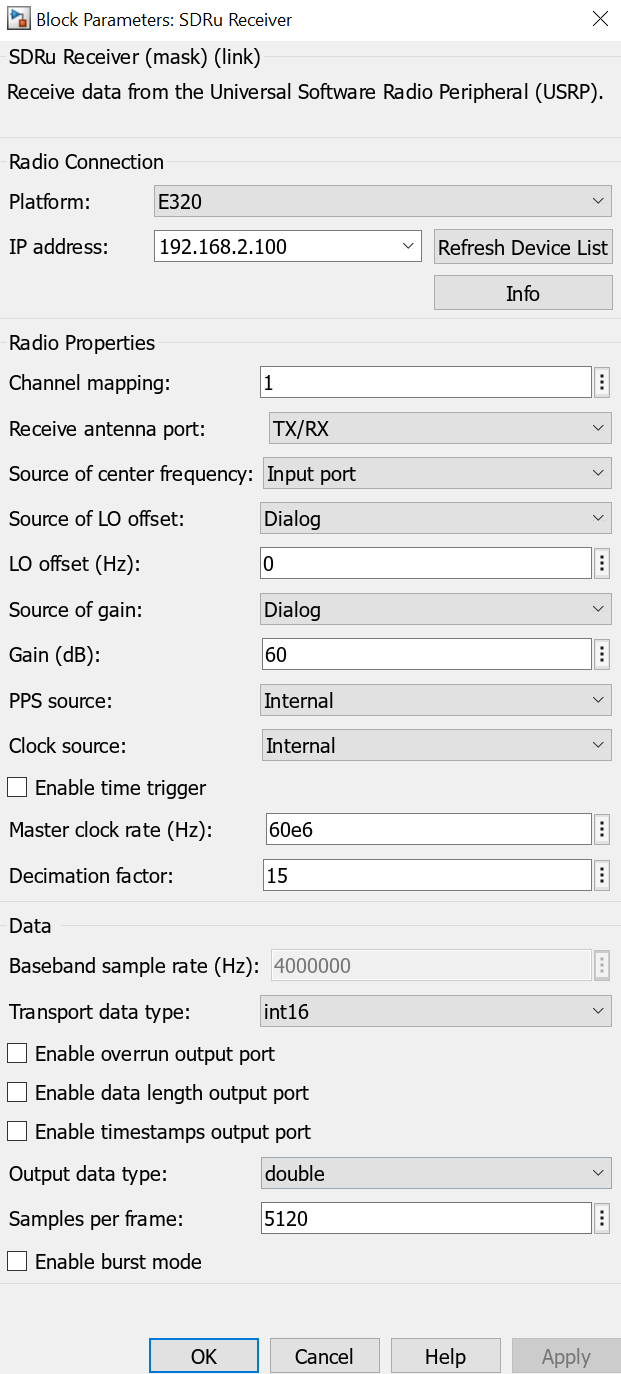
The next step is to configure the receiver unit SDRu Receiver (the parameters of the settings are given below). For subsequent visualization and data analysis, it is necessary to connect the output of this unit to the inputs of the Time Scope blocks, designed to study the time characteristics of the received signal, and Spectrum Analyzer, used to analyze its spectral composition.
As a result, the model should look as shown in the figure.
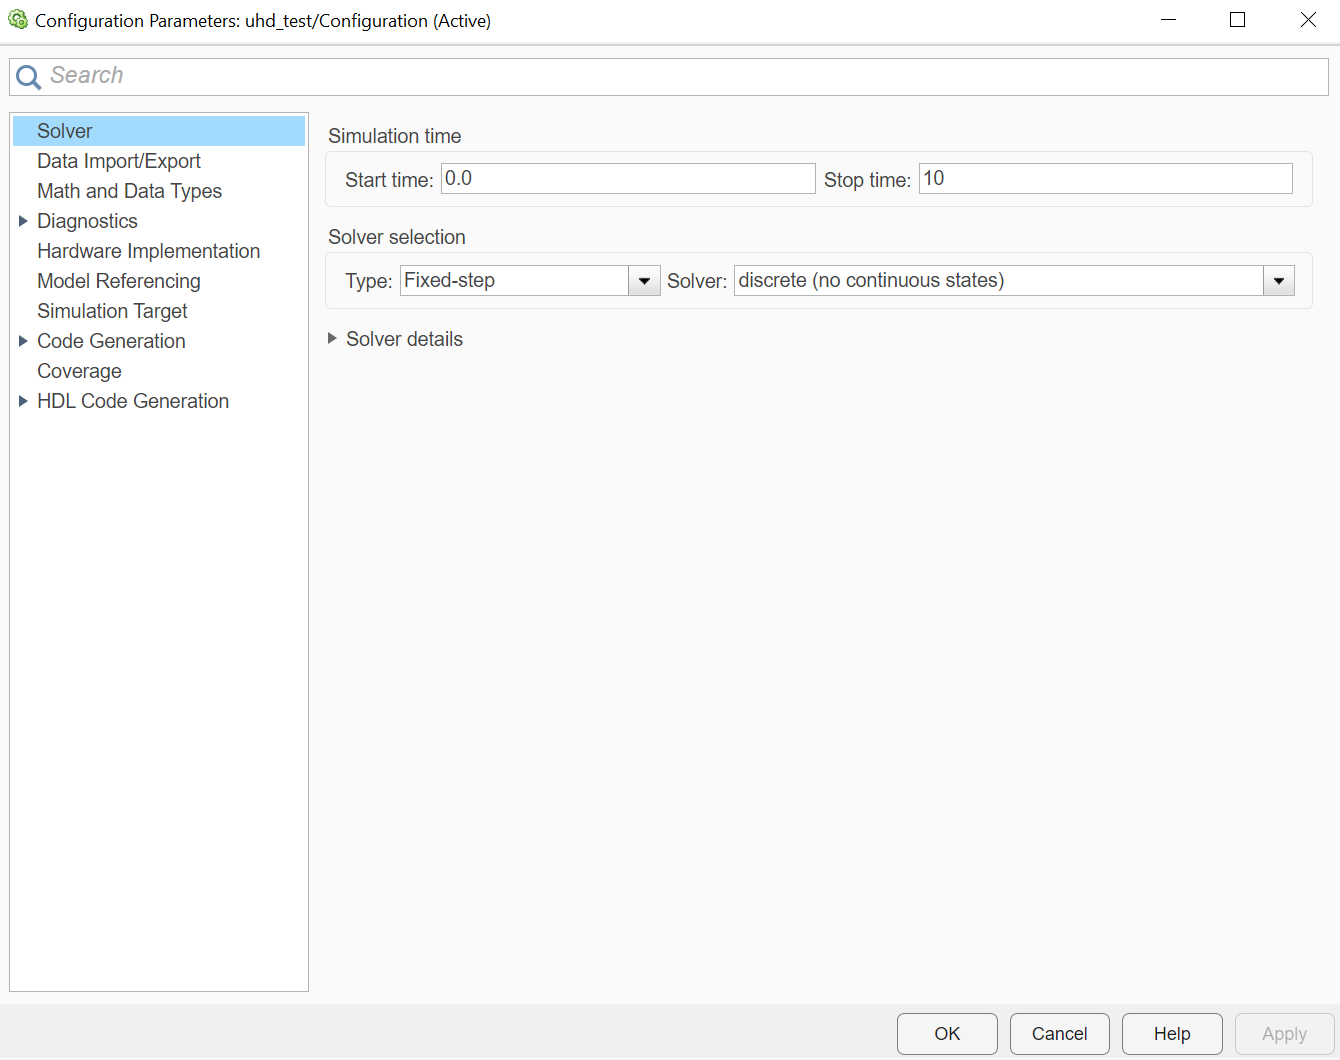
In addition, to ensure parallel transmission and reception of data in real time, it is necessary to configure the solver Solver. In the configuration parameters of the model, you should set the solver type Type as Fixed-step (with a fixed step), and as a direct solver Solver choose discrete (no continuous states).
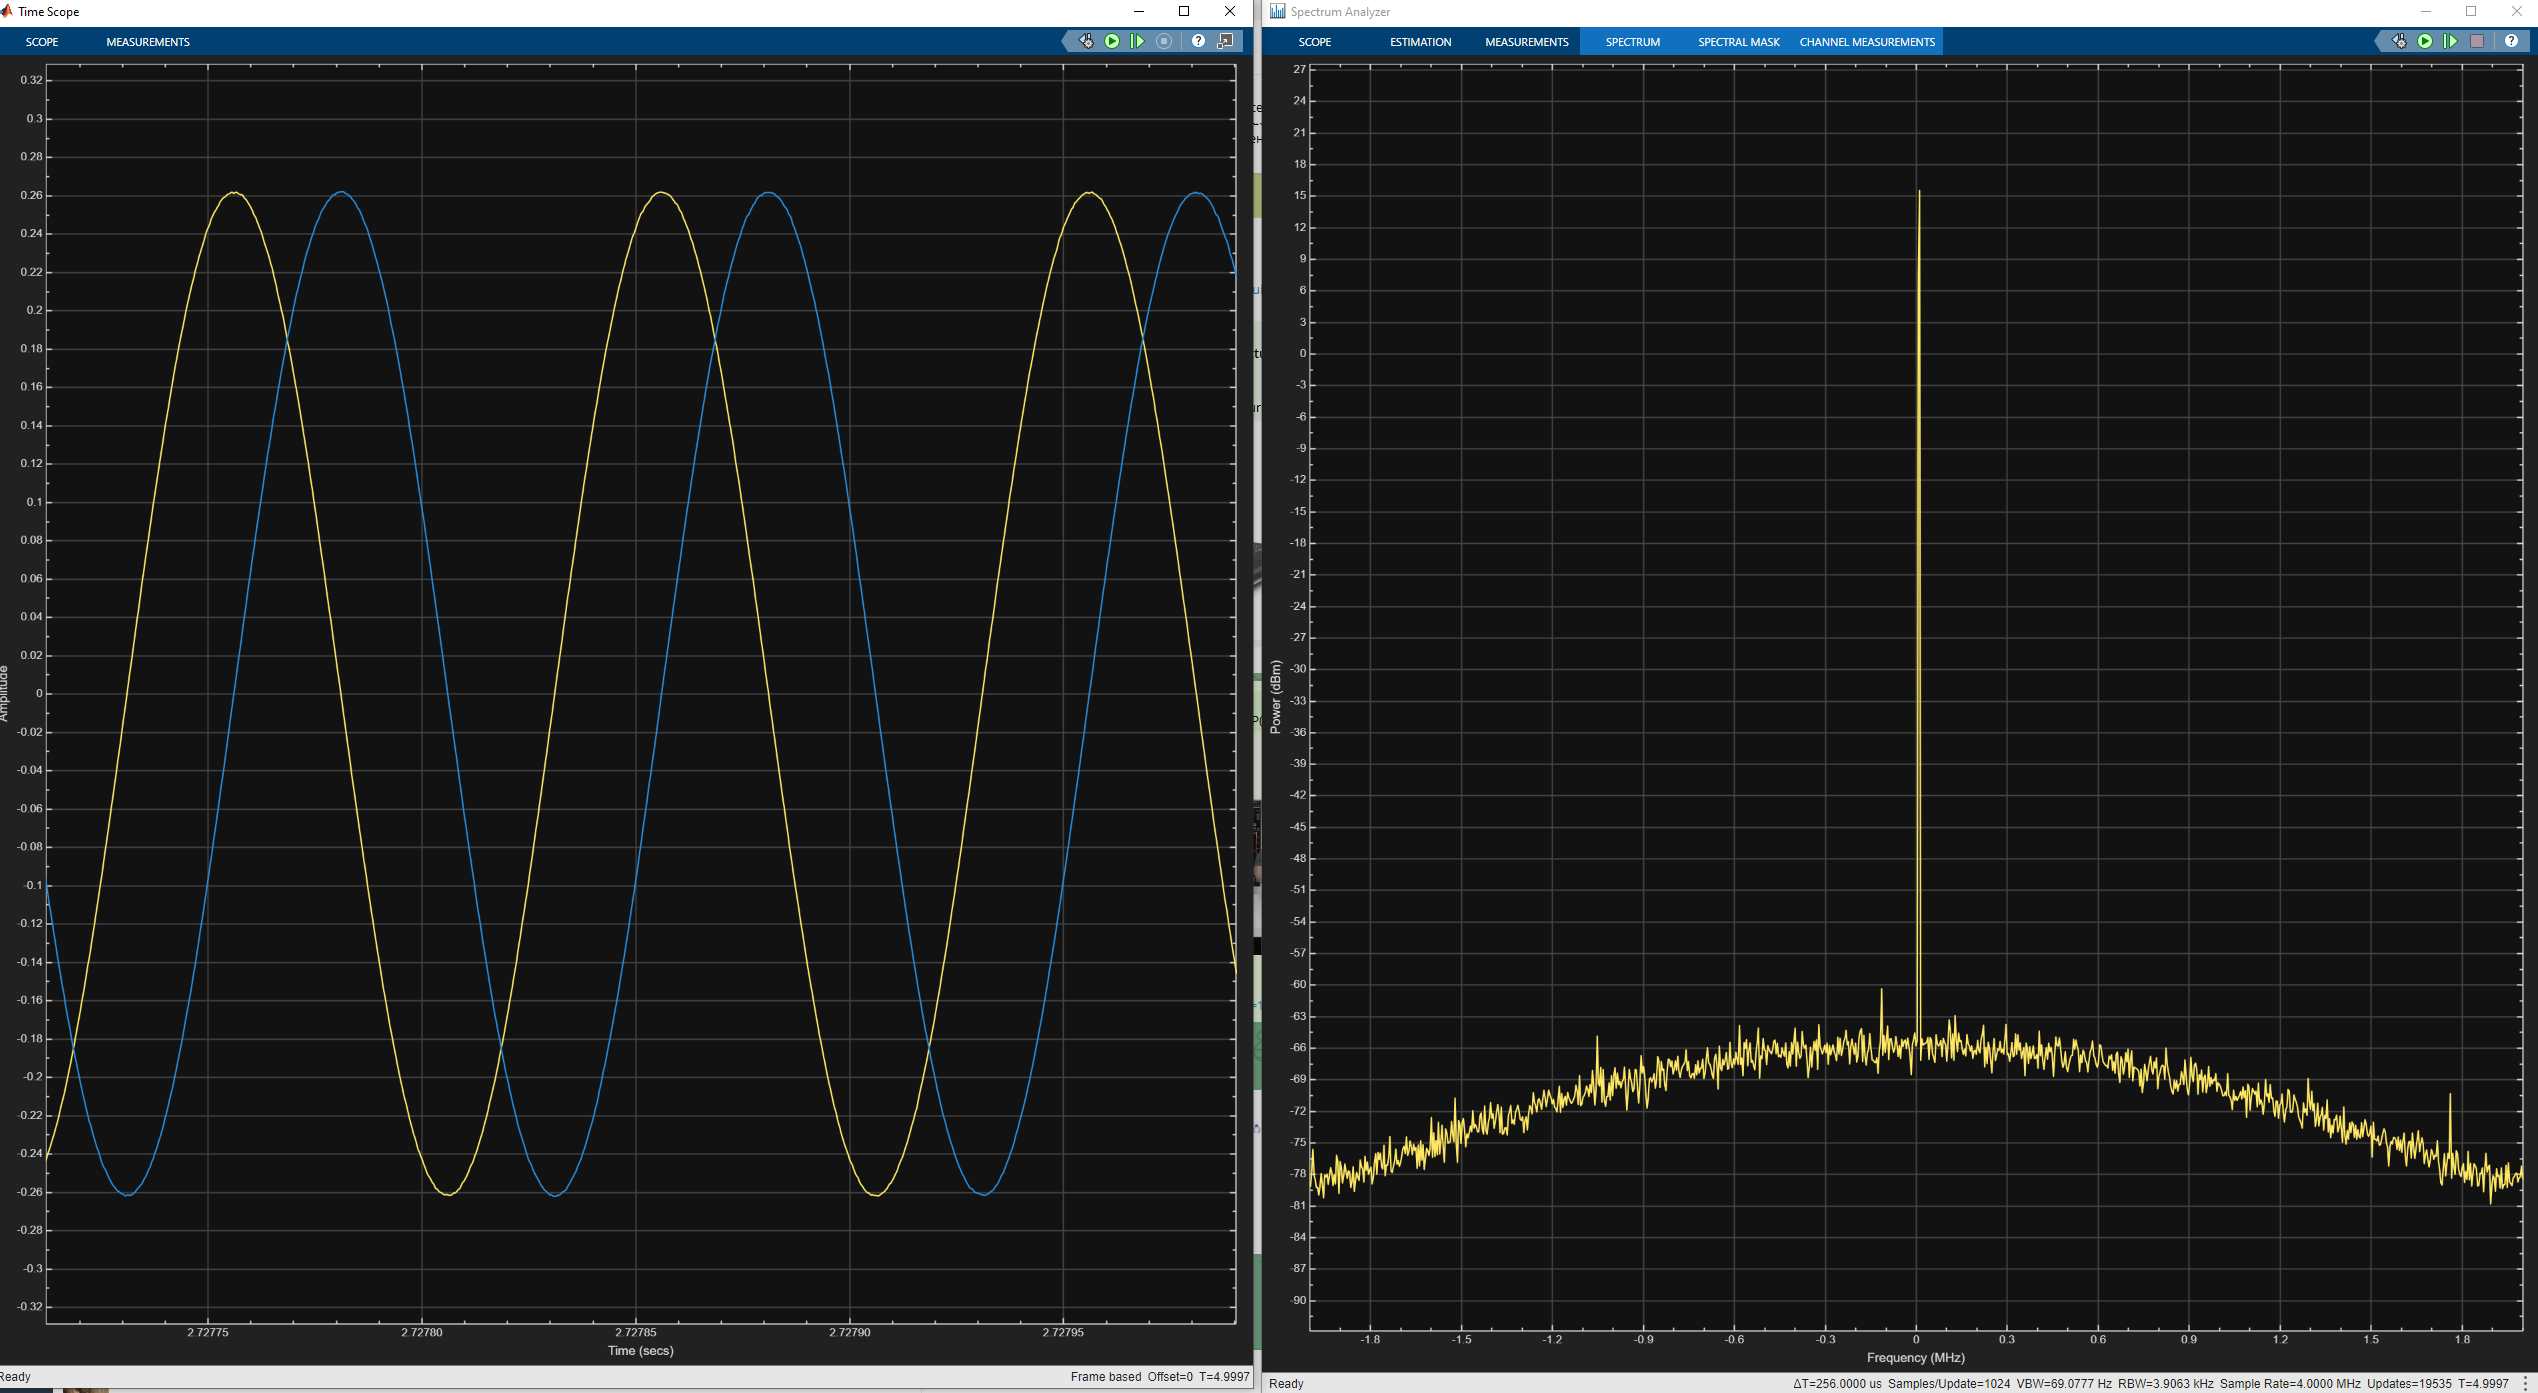
By running Run, you can get the following graphs shown in the figure.
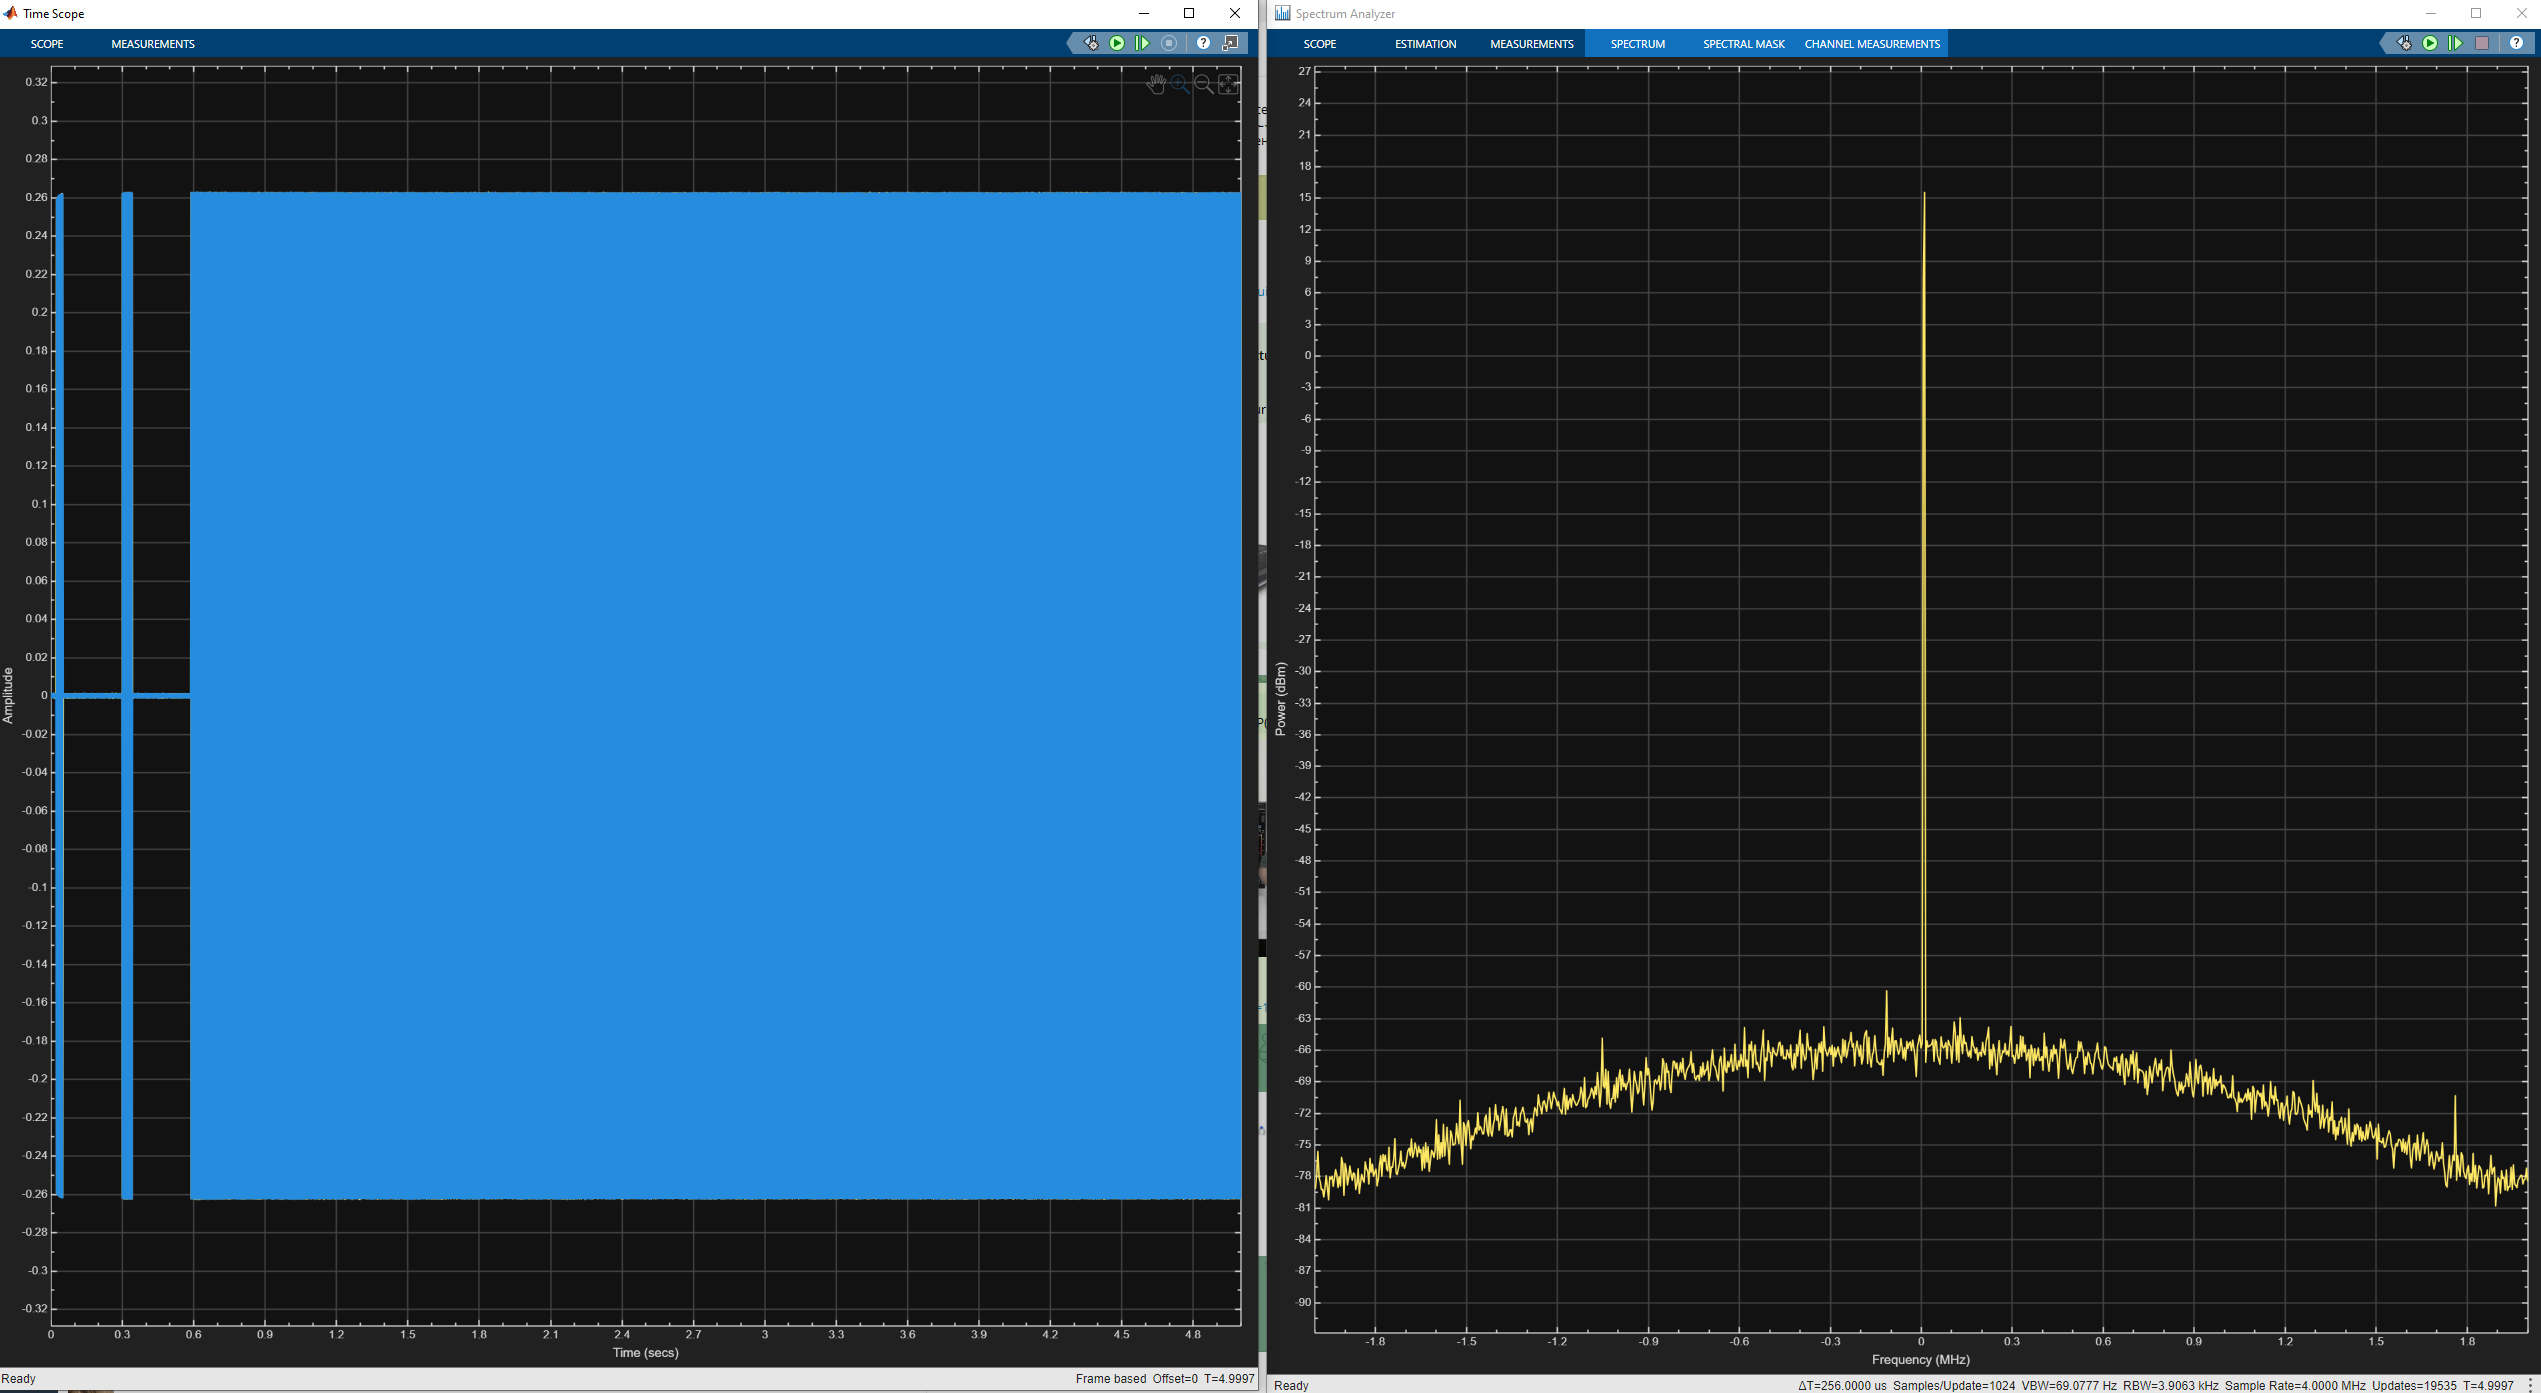
You may notice that data reception is set up at the beginning, and only then signal transmission begins. Also, if you zoom in, you can see a sinusoid of the correct shape.