Colorbar
|
The page is in the process of being translated. |
A Colorbar needs a colormap and a tuple of low/high limits. The colormap’s axis will then span from low to high along the visual representation of the colormap. You can set ticks in a similar way to Axis.
using CairoMakie

fig = Figure()

Axis(fig[1, 1])

# vertical colorbars
Colorbar(fig[1, 2], limits = (0, 10), colormap = :viridis,
    flipaxis = false)
Colorbar(fig[1, 3], limits = (0, 5),
    colormap = cgrad(:Spectral, 5, categorical = true), size = 25)
Colorbar(fig[1, 4], limits = (-1, 1), colormap = :heat,
    highclip = :cyan, lowclip = :red, label = "Temperature")

# horizontal colorbars
Colorbar(fig[2, 1], limits = (0, 10), colormap = :viridis,
    vertical = false)
Colorbar(fig[3, 1], limits = (0, 5), size = 25,
    colormap = cgrad(:Spectral, 5, categorical = true), vertical = false)
Colorbar(fig[4, 1], limits = (-1, 1), colormap = :heat,
    label = "Temperature", vertical = false, flipaxis = false,
    highclip = :cyan, lowclip = :red)

fig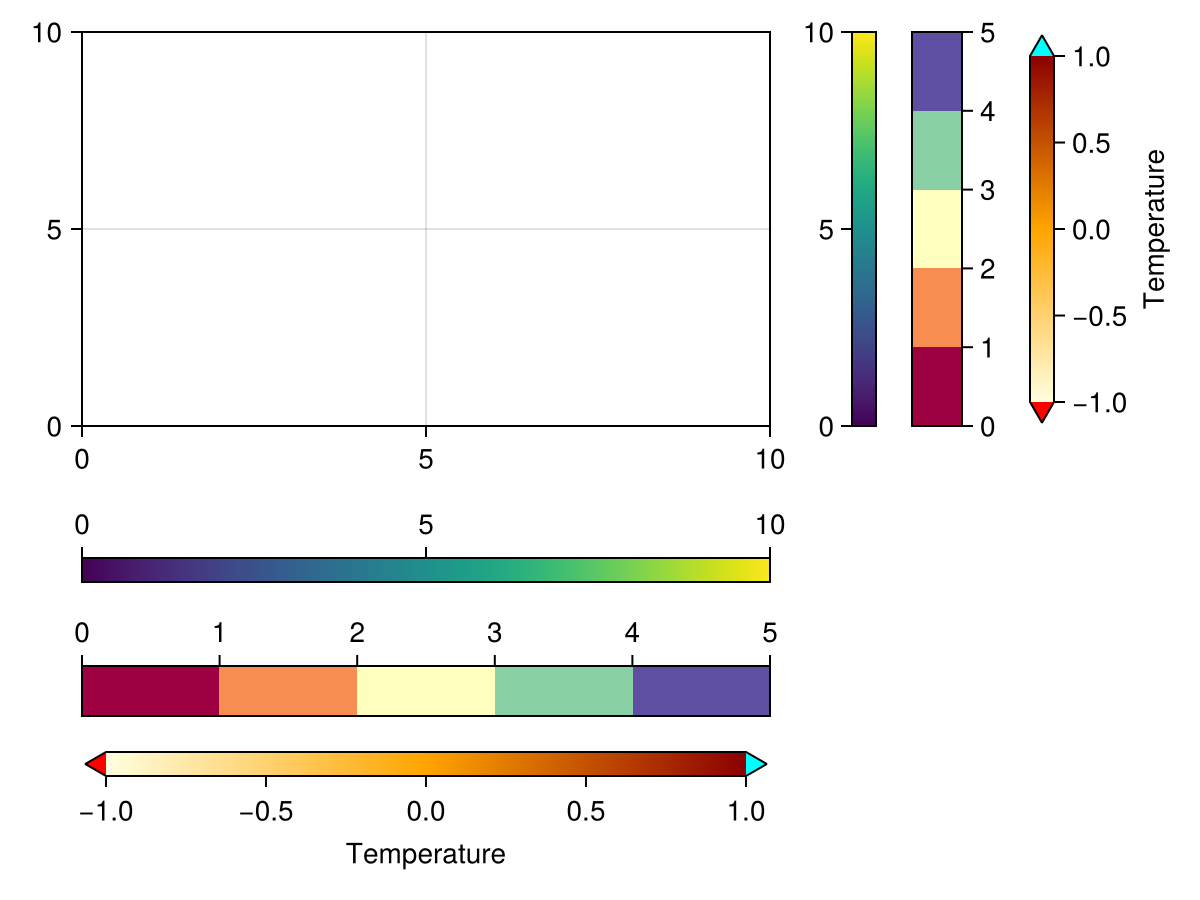
If you pass a plotobject, a heatmap or contourf, the Colorbar is set up automatically such that it tracks these objects' relevant attributes like colormap, colorrange, highclip and lowclip. If you want to adjust these attributes afterwards, change them in the plot object, otherwise the Colorbar and the plot object will go out of sync.
using CairoMakie

xs = LinRange(0, 20, 50)
ys = LinRange(0, 15, 50)
zs = [cos(x) * sin(y) for x in xs, y in ys]

fig = Figure()

ax, hm = heatmap(fig[1, 1][1, 1], xs, ys, zs)
Colorbar(fig[1, 1][1, 2], hm)

ax, hm = heatmap(fig[1, 2][1, 1], xs, ys, zs, colormap = :grays,
    colorrange = (-0.75, 0.75), highclip = :red, lowclip = :blue)
Colorbar(fig[1, 2][1, 2], hm)

ax, hm = contourf(fig[2, 1][1, 1], xs, ys, zs,
    levels = -1:0.25:1, colormap = :heat)
Colorbar(fig[2, 1][1, 2], hm, ticks = -1:0.25:1)

ax, hm = contourf(fig[2, 2][1, 1], xs, ys, zs,
    colormap = :Spectral, levels = [-1, -0.5, -0.25, 0, 0.25, 0.5, 1])
Colorbar(fig[2, 2][1, 2], hm, ticks = -1:0.25:1)

fig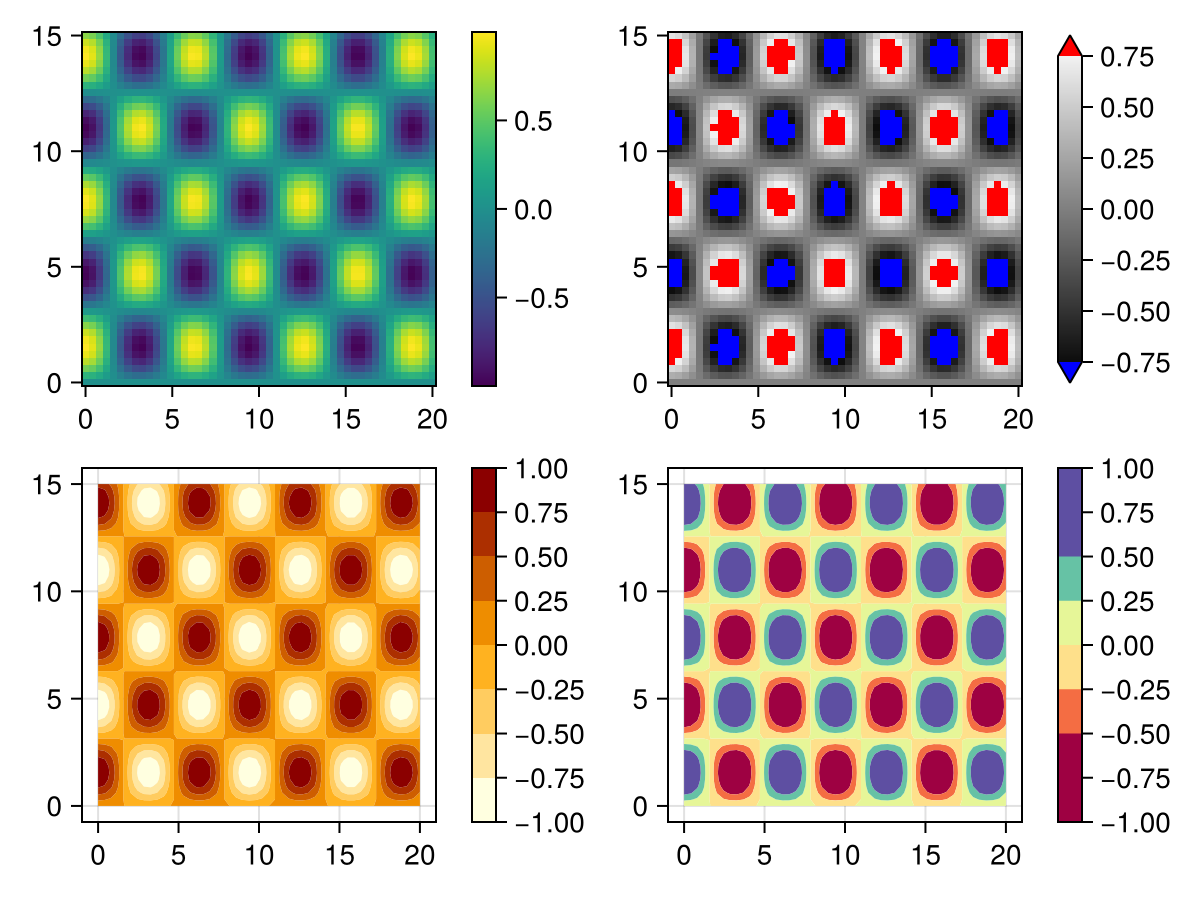
Experimental Categorical support
|
Warning This feature might change outside breaking releases, since the API is not yet finalized |
You can create a true categorical map with good default ticks, by wrapping a colormap into Makie.Categorical(cmap):
using CairoMakie
fig, ax, pl = barplot(1:3; color=1:3, colormap=Makie.Categorical(:viridis))
Colorbar(fig[1, 2], pl)
fig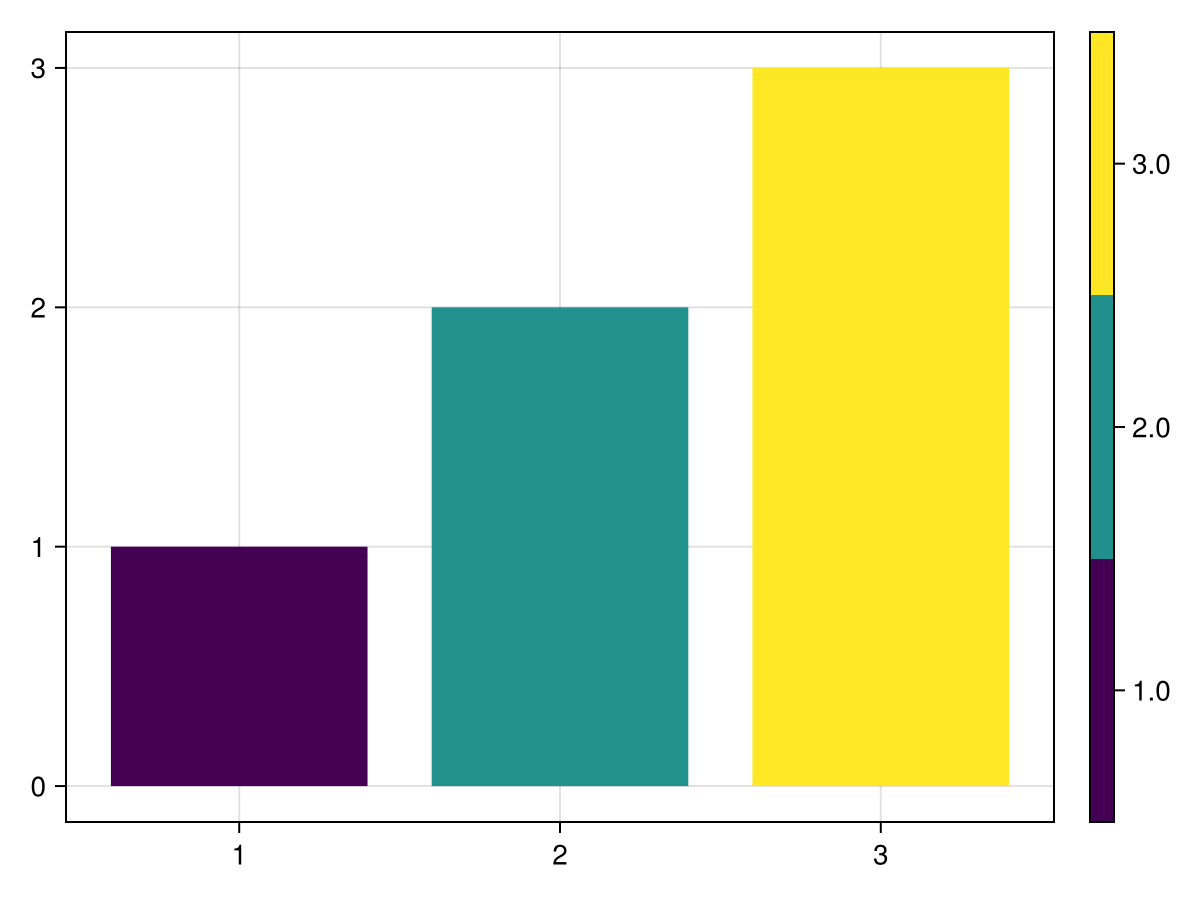
We can’t use cgrad(...; categorical=true) for this, since it has an ambiguous meaning for true categorical values.
Attributes
size
Defaults to 12
The width or height of the colorbar, depending on if it’s vertical or horizontal, unless overridden by width / height
tickalign
Defaults to 0.0
The alignment of the tick marks relative to the axis spine (0 = out, 1 = in).
ticklabelalign
Defaults to Makie.automatic
The horizontal and vertical alignment of the tick labels.