尺寸转换
|
该页面正在翻译中。 |
从Makie v0.21开始,增加了对单位、分类值和日期等类型的支持。 它们通过dim(enion)转换转换为可绘制的表示形式,这也会处理轴刻度。 在以下部分中,我们将解释它们的用法以及如何使用自己的类型扩展接口。
例子:
using CairoMakie
using CairoMakie, Makie.Dates, Makie.Unitful

f, ax, pl = scatter(rand(Second(1):Second(60):Second(20*60), 10))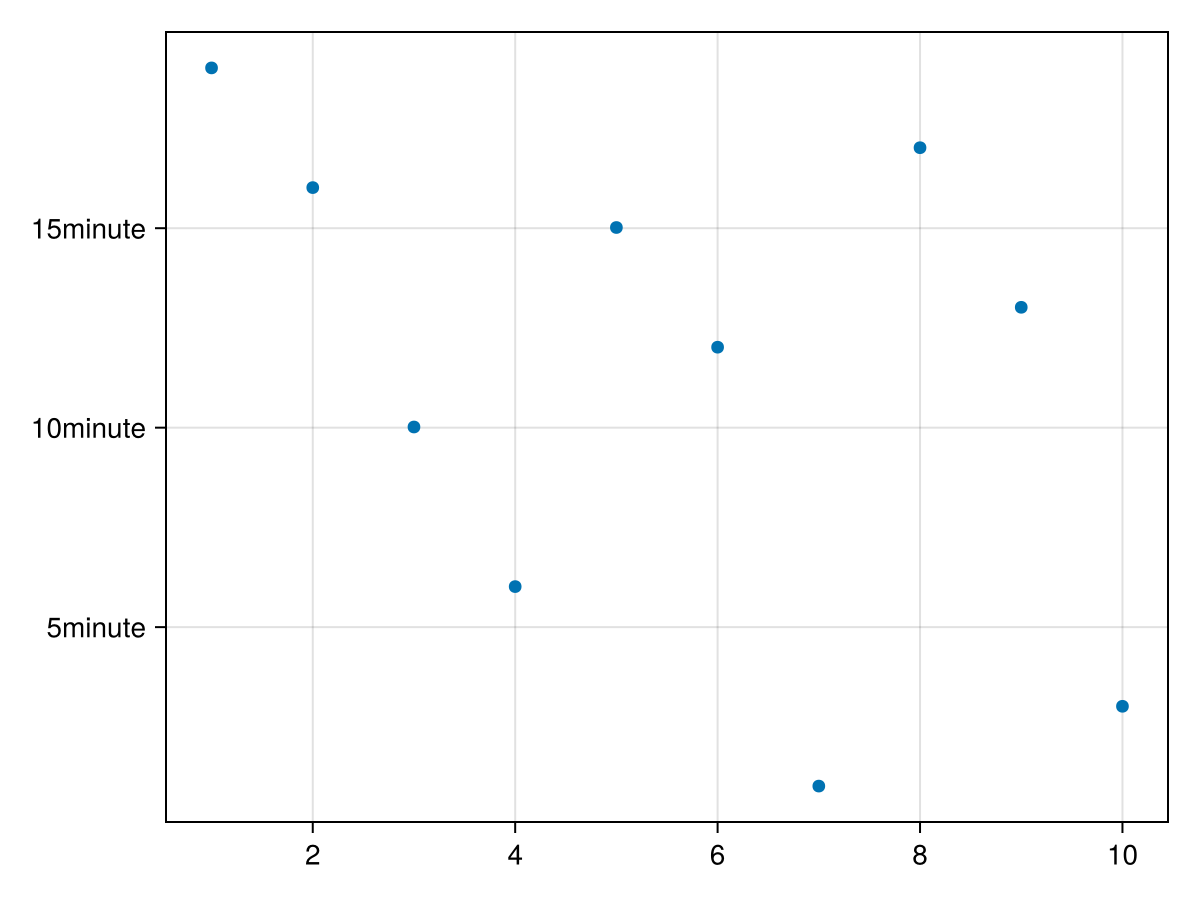
scatter!(ax, rand(Hour(1):Hour(1):Hour(20), 10))
# Unitful works as well
scatter!(ax, LinRange(0u"yr", 0.1u"yr", 5))
f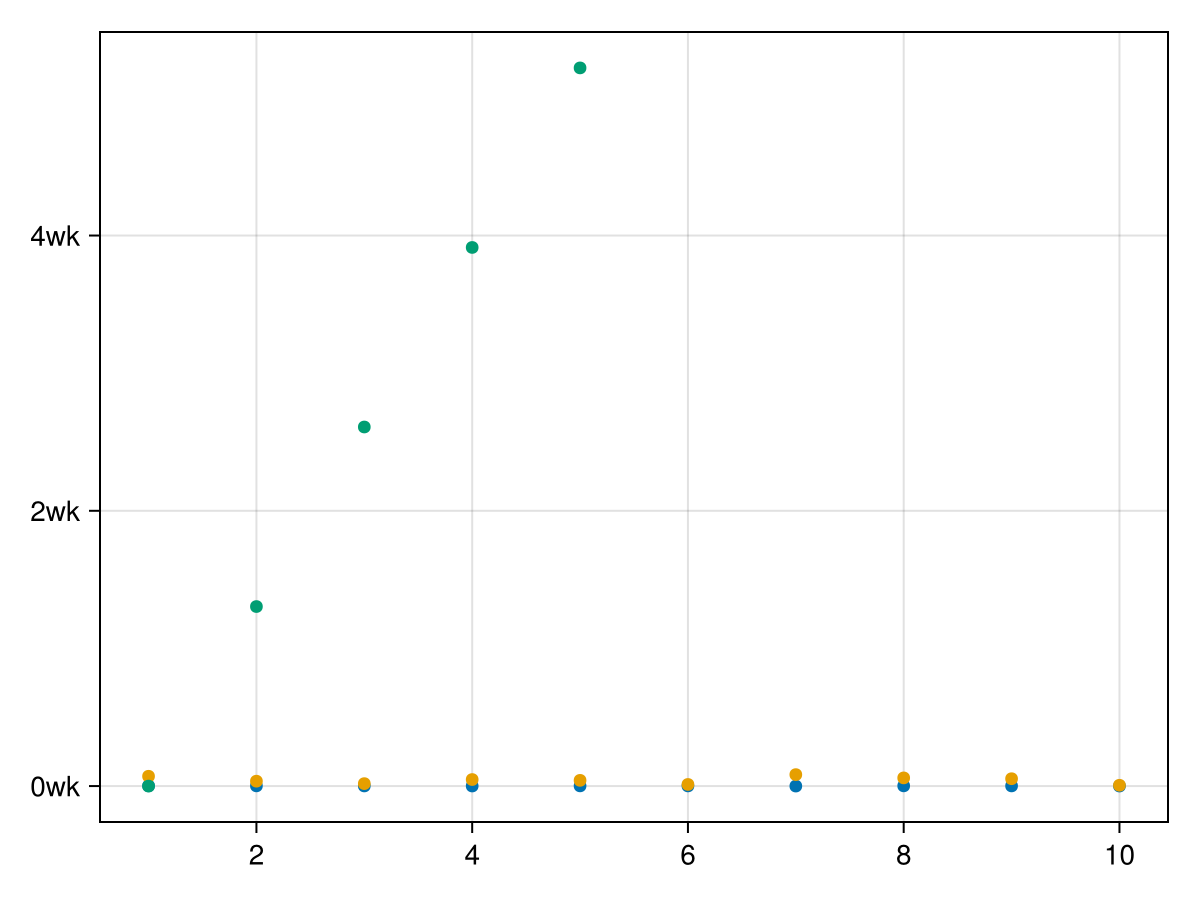
请注意,以刻度显示的单位将调整到给定的值范围。
回到数字错误,因为轴现在是单位的:
try
    scatter!(ax, 1:4)
catch e
    return e
end
同样,尝试将单位绘制成无单位轴尺寸误差,否则会改变先前绘制值的含义:
try
    scatter!(ax, LinRange(0u"yr", 0.1u"yr", 10), rand(Hour(1):Hour(1):Hour(20), 10))
catch e
    return e
end
您可以通过以下方式访问转换 斧头dim1_转换 和 斧头dim2_转换:
(ax.dim1_conversion[], ax.dim2_conversion[])并相应地设置它们:
f = Figure()
ax = Axis(f[1, 1]; dim1_conversion=Makie.CategoricalConversion())
限制
-
目前,dim转换仅适用于标准2D轴的x和y参数支持类型的矢量。 它的设置是推广到其他轴类型,但完全集成还没有完成。
-
关键词如
方向=:y例如,Barplot不会正确传播到轴,因为第一个参数当前始终是x,第二个始终是y。 -
类别值需要包含在
分类,分类,因为在默认为分类转换时很难找到一个不含糊的好类型。 你可以在文档中找到一个工作。 -
日期时间滴答简单地使用
情节。优化_datetime_ticks这也被用于地块。jl. 它还没有生成最佳可读的刻度,并且可以快速生成重叠并超出轴边界。 这将需要更多的润色来创建可读的刻度作为默认值。 -
要仅在适用时正确应用dim转换,需要使用新的未记录
@食谱宏并定义转换目标类型。 这意味着用户配方只有在没有转换的情况下将参数传递给任何基本绘图类型时才有效。
Makie中的当前转换
#
<无翻译>*麦琪分类转换*-Type</no-翻译>
CategoricalConversion(; sortby=identity)分类转换。 只会自动选择 分类(array_of_objects) 就现在。 这些类别可以使用任何可排序的值,所以人们总是可以这样做 轴(图;dim1_conversion=CategoricalConversion()),以将其用于其他类别。 一个可以使用 分类转换(sortby=func),以更改排序,或使不可排序的对象可排序。
例子
# Ticks get chosen automatically as categorical
scatter(1:4, Categorical(["a", "b", "c", "a"]))
# Explicitly set them for other types:
struct Named
value
end
Base.show(io::IO, s::SomeStruct) = println(io, "[$(s.value)]")
conversion = Makie.CategoricalConversion(sortby=x->x.value)
barplot(Named.([:a, :b, :c]), 1:3, axis=(dim1_conversion=conversion,))#
<无翻译>*麦琪单位转换/单位转换*-Type</无翻译>
UnitfulConversion(unit=automatic; units_in_label=false)允许将单位对象数组绘制到轴中。
论点
-
单位=自动:将单位设置为转换目标。 如果自动保留,则将为绘制到轴上的所有绘图+值选择最佳单位(例如,长时间的年,长距离的公里,短时间的纳秒)。 -
units_in_label=true:控件,图是显示在轴标签的label_prefix中,还是显示在刻度标签中
例子
using Unitful, CairoMakie

# UnitfulConversion will get chosen automatically:
scatter(1:4, [1u"ns", 2u"ns", 3u"ns", 4u"ns"])
固定单元始终使用xlabel中的仪表和显示单元:
uc = Makie.UnitfulConversion(u"m"; units_in_label=false)
scatter(1:4, [0.01u"km", 0.02u"km", 0.03u"km", 0.04u"km"]; axis=(dim2_conversion=uc, xlabel="x (km)"))
#
<无翻译>*麦琪日期时间转换*-Type</无翻译>
DateTimeConversion(type=Automatic; k_min=automatic, k_max=automatic, k_ideal=automatic)为日期、日期时间和时间创建转换和转换。 对于其他时间单位,应该使用 单位转换/单位转换,例如秒。
日期时间 情节。优化_datetime_ticks 用于获取转换,否则 轴心。(x/y)蜱 用于日期的整数表示。
论点
-
类型=自动:当自动离开时,轴的第一个绘图将决定类型。 否则,可以将其设置为时间,日期,或日期时间.
例子
date_time = DateTime("2021-10-27T11:11:55.914")
date_time_range = range(date_time, step=Week(5), length=10)
# Automatically chose xticks as DateTeimeTicks:
scatter(date_time_range, 1:10)

# explicitly chose DateTimeConversion and use it to plot unitful values into it and display in the `Time` format:
using Makie.Unitful
conversion = Makie.DateTimeConversion(Time)
scatter(1:4, (1:4) .* u"s", axis=(dim2_conversion=conversion,))
开发人员文档
struct MyDimConversion <: Makie.AbstractDimConversion end

# The type you target with the dim conversion
struct MyUnit
    value::Float64
end

# This is currently needed because `expand_dimensions` can only be narrowly defined for `Vector{<:Real}` in Makie.
# So, if you want to make `plot(some_y_values)` work for your own types, you need to define this method:
Makie.expand_dimensions(::PointBased, y::AbstractVector{<:MyUnit}) = (keys(y.values), y)

function Makie.needs_tick_update_observable(conversion::MyDimConversion)
    # return an observable that indicates when ticks need to update e.g. in case the unit changes or new categories get added.
    # For a simple unit conversion this is not needed, so we return nothing.
    return nothing
end

# Indicate that this type should be converted using MyDimConversion
# The Type gets extracted via `Makie.get_element_type(plot_argument_for_dim_n)`
# so e.g. `plot(1:10, ["a", "b", "c"])` would call `Makie.get_element_type(["a", "b", "c"])` and return `String` for axis dim 2.
Makie.create_dim_conversion(::Type{MyUnit}) = MyDimConversion()

# This function needs to be overloaded too, even though it's redundant to the above in a sense.
# We did not want to use `hasmethod(MakieCore.should_dim_convert, (MyDimTypes,))` because it can be slow and error prown.
Makie.MakieCore.should_dim_convert(::Type{MyUnit}) = true

# The non observable version of the actual conversion function
# This is needed to convert axis limits, and should be a pure version of the below `convert_dim_observable`
function Makie.convert_dim_value(::MyDimConversion, values)
    return [v.value for v in values]
end

功能Makie。convert_dim_observable(conversion::MyDimConversion,values_obs::Observable,deregister)
    #在这里做实际的转换
    #大多数复杂的dim转换都需要对observable进行操作(例如创建所有已使用类别的Dict),因此 `convert_dim_value` 光靠自己是不够的。
    结果=可观察(Float64[])
    f=on(values_obs;update=true)执行值
        结果[]=Makie。convert_dim_value(转换,值)
    结束

    #任何可观察的操作,如 `上` 或 `地图` 应推向 `注销登记`,如果情节被破坏,可以正确地清理状态。
    #为 `结果=map(func,values_obs)` 一个可以使用 `追加!(取消注册,结果。输入)`
    推!(注销,f)
    返回结果
结束

功能Makie。get_ticks(::MyDimConversion,user_set_ticks,user_dim_scale,user_formatter,limits_min,limits_max)
    #对于这个例子,不要对蜱做任何特别的事情,只需追加 `我的朋友` 到标签,其余的留给Makie通常的刻度查找方法。
    ticknumbers,ticklabels=Makie。get_ticks(user_set_ticks,user_dim_scale,user_formatter,limits_min,
                                        limits_max)
    返回ticknumbers,ticklabels。*"myunit"
结束

barplot([MyUnit(1),MyUnit(2),MyUnit(3)],1:3)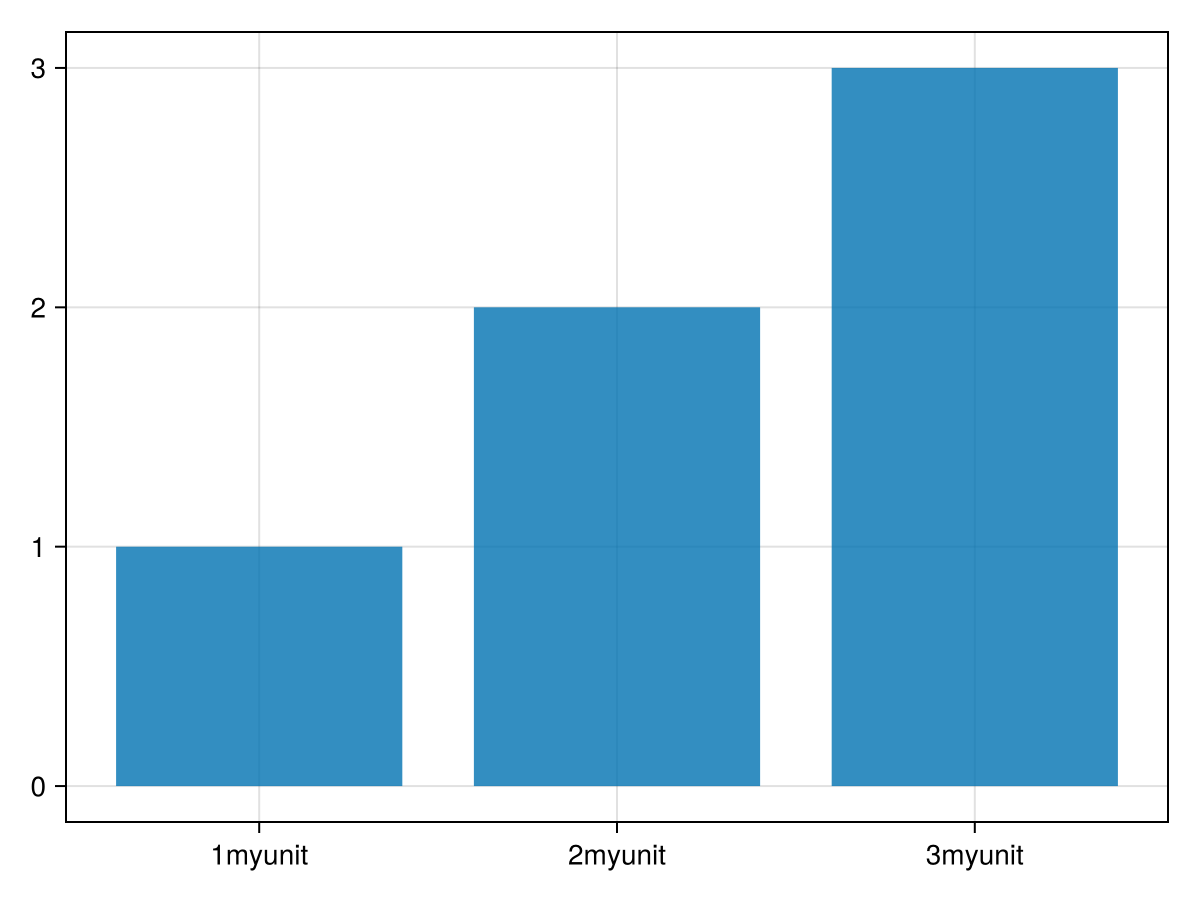
对于更复杂的示例,您应该查看: Makie/src/dim-转换.
转换在函数中应用 麦琪转换/转换 在 Makie/src/接口。jl.