[医]规格
|
该页面正在翻译中。 |
|
警告SpecApi仍在积极开发中,将来可能会很快引入重大更改。 对于动画来说,它也比使用普通的Makie API慢,因为它需要经常重新创建情节,并且需要遍历整个情节树以找到不同的值。 虽然性能总是比直接使用Observables更新属性慢,但它仍然没有太多优化,所以我们期望在未来改进它。 您还应该期待错误,因为API仍然是非常新的,同时提供了许多新的和复杂的功能。 如果您遇到意外行为,请不要犹豫打开问题。 Pr也非常受欢迎,代码实际上并不复杂,应该很容易深入(src/basic_recipes/specapi)。jl)。 |
什么是SpecApi?
从0.20版本开始,Makie支持通过规范或"规范"对象创建绘图和图形。 这些对象是熟悉的对象的声明性版本,如 轴心,轴心, 颜色栏, 散点,散点 或 热图. 声明性意味着这些对象不实现交互式、有状态绘图所需的任何复杂内部机制。 相反,它们只是描述,然后Makie为您转换为完整的对象。
为什么这是有用的?
Spec对象重量轻,易于组成更大的结构,而无需逐步构建这些结构。 这使得可以将从不同函数返回的子配置粘合在一起,而不是让这些函数可变地绘制到相同的现有父级 图. 您还可以将可观察的规范对象绘制到给定的 图 当您更改描述时,整个子配置会自动更新或重建自己,试图通过使用差异来尽可能保留现有结构。 这可以使构建仪表板或较小的交互式应用程序更容易,因为用户必须跟踪较少的状态。 另一方面,diffing引入了性能开销,通常不会像直接使用Makie的mutating API那样快。
您可以使用 麦琪[医]规格 对象。 主要有两种类型的规格, N.绘图,绘图s和 N.块,块s,对应于像这样的绘图对象 散点,散点 或 热图,而 座 对象像 轴心,轴心 或 颜色栏.
API应该类似于普通的API,只是声明性的。 复杂的规格是通过在彼此内部嵌套更简单的规格来构建的。 惯例是始终使用 S 创建规范对象时使用前缀,因此它们不能与标准API中的对应对象混淆。
import Makie.SpecApi as S

scatterspec = S.Scatter(1:4) # a PlotSpec describing a Scatter plot
axspec = S.Axis(plots=[scatterspec]) # a BlockSpec describing an Axis with a Scatter plot
layout_spec = S.GridLayout(axspec) # a Layout describing a Figure with an Axis with a Scatter plot

# Now we can instantiate the spec into a fully realized Figure.
# Note that the output type from `plot` is currently, a bit confusingly, a
# FigureAxisPlot type, which does not really fit because `pl` is not a normal plot
# and there can be zero or many axes in the figure.
# This will be changed in future iterations.
f, _, pl = plot(layout_spec)

# By updating the input observable of `pl`, our "plot" object, we can
# update all the content in the Figure with something new. In this case,
# we just change the plot type in the Axis from Scatter to Lines, and the
# axis title to "Lines".
pl[1] = S.GridLayout(S.Axis(; title="Lines", plots=[S.Lines(1:4)]))
你不仅可以 情节 描述整个布局的规格,但也描述了规格 座s或只是单个地块。
s = Makie.PlotSpec(:Scatter, 1:4; color=:red)
axis = Makie.BlockSpec(:Axis; title="Axis at layout position (1, 1)")
规格的建筑布局
using GLMakie
using DelimitedFiles
using Makie.FileIO
import Makie.SpecApi as S
using Random

Random.seed!(123)

volcano = readdlm(Makie.assetpath("volcano.csv"), ',', Float64)
brain = load(assetpath("brain.stl"))
r = LinRange(-1, 1, 100)
cube = [(x .^ 2 + y .^ 2 + z .^ 2) for x = r, y = r, z = r]

density_plots = map(x -> S.Density(x * randn(200) .+ 3x, color=:y), 1:5)
brain_mesh = S.Mesh(brain, colormap=:Spectral, color=[tri[1][2] for tri in brain for i in 1:3])
volcano_contour = S.Contourf(volcano; colormap=:inferno)
cube_contour = S.Contour(cube, alpha=0.5)

ax_densities = S.Axis(; plots=density_plots, yautolimitmargin = (0, 0.1))
ax_volcano = S.Axis(; plots=[volcano_contour])
ax_brain = S.Axis3(; plots=[brain_mesh], protrusions = (50, 20, 10, 0))
ax_cube = S.Axis3(; plots=[cube_contour], protrusions = (50, 20, 10, 0))

spec_column_vector = S.GridLayout([ax_densities, ax_volcano, ax_brain]);
spec_matrix = S.GridLayout([ax_densities ax_volcano; ax_brain ax_cube]);
spec_row = S.GridLayout([spec_column_vector spec_matrix], colsizes = [Auto(), Auto(4)])

f, ax, pl = plot(S.GridLayout(spec_row); figure = (; fontsize = 10))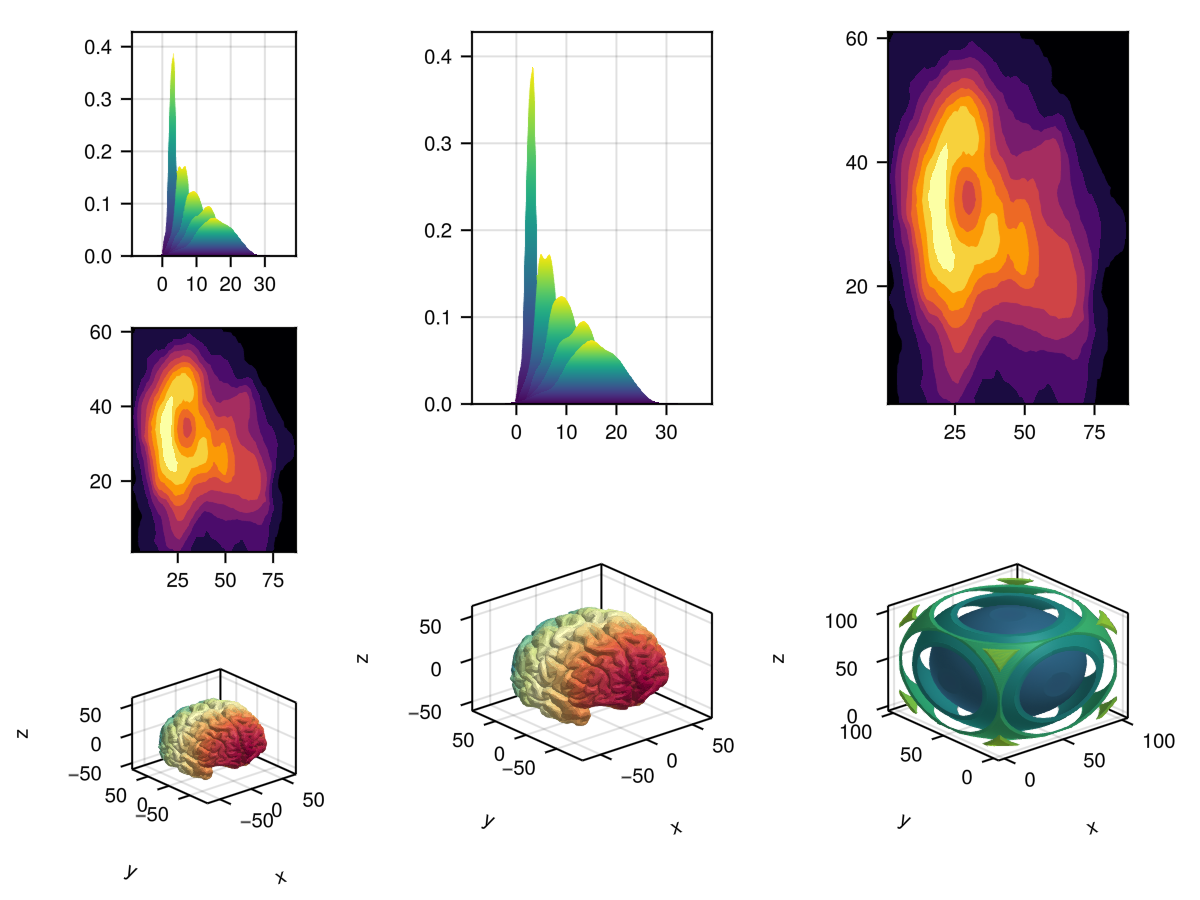
高级规格布局
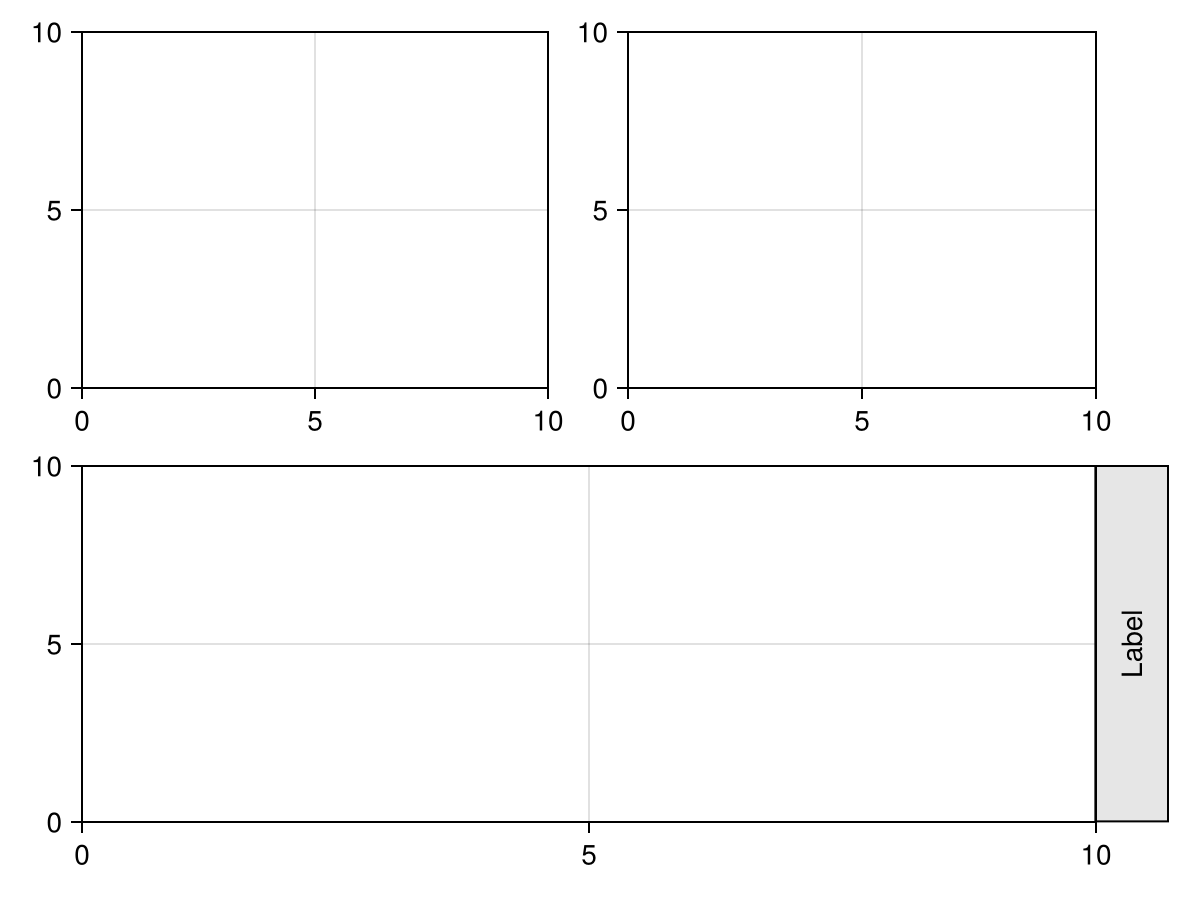
如果您需要更多的控制,您可以将布局中每个对象的位置传递给 S.GridLayout 直接。 这些位置被指定为 (行,列[,侧]) 哪里 侧面 是 里面() 默认情况下。 为 行 和 列 你可以使用整数,如 2,范围像 1:3 或冒号运算符 : 它跨越为其他元素指定的所有行或列。 行和列从 1 默认情况下,但您也可以使用低于 1 如有必要。
</无翻译>
using CairoMakie
import Makie.SpecApi as S

plot(
    S.GridLayout([
        (1, 1) => S.Axis(),
        (1, 2) => S.Axis(),
        (2, :) => S.Axis(),
        (2, 2, Right()) => S.Box(),
        (2, 2, Right()) => S.Label(
            text = "Label",
            rotation = pi/2,
            padding = (10, 10, 10, 10)
        ),
    ])
)
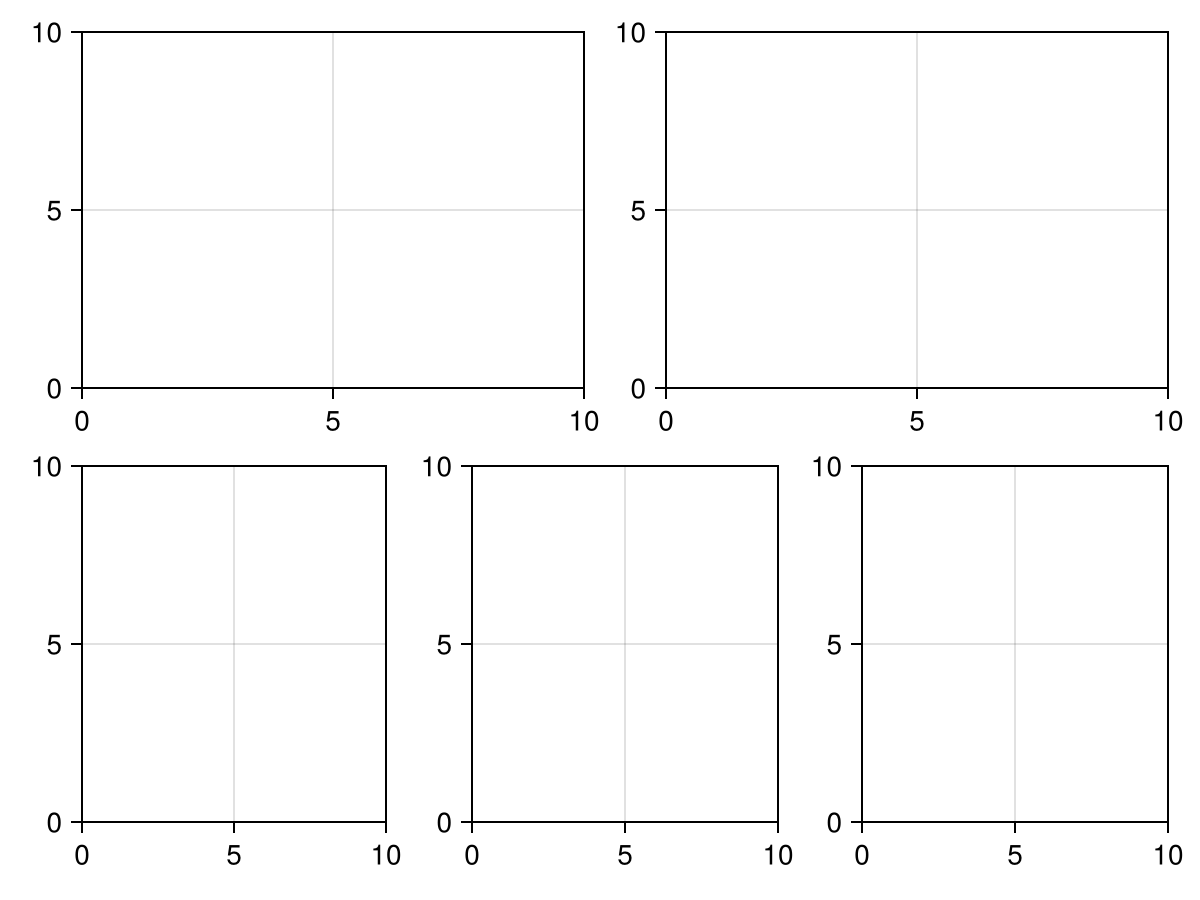
using CairoMakie
import Makie.SpecApi as S

情节(S.GridLayout([
    (1,1)=>S.轴(),
    (1,2)=>S.轴(),
    (2,:)=>S.GridLayout(fill(S.Axis(),1,3)),
]))
以下是所有关键字参数 S.GridLayout 接受。
S.GridLayout([...],
    colsizes = [Auto(), Auto(), 300],
    rowsizes = [Relative(0.4), Relative(0.6)],
    colgaps,
    rowgaps,
    alignmode,
    halign,
    valign,
    tellheight,
    tellwidth,
)using CairoMakie
import Makie.SpecApi as S
axis_matrix = broadcast(1:2, (1:2)') do x, y
S.Axis(; title="$x, $y")
end
layout = S.GridLayout(
axis_matrix;
xaxislinks=vec(axis_matrix[1:2, 1]),
yaxislinks=vec(axis_matrix[1:2, 2])
)
f, _, pl = plot(layout)
# Change limits to see the links in action
for ax in f.content[[1, 3]]
limits!(ax, 2, 3, 2, 3)
end
f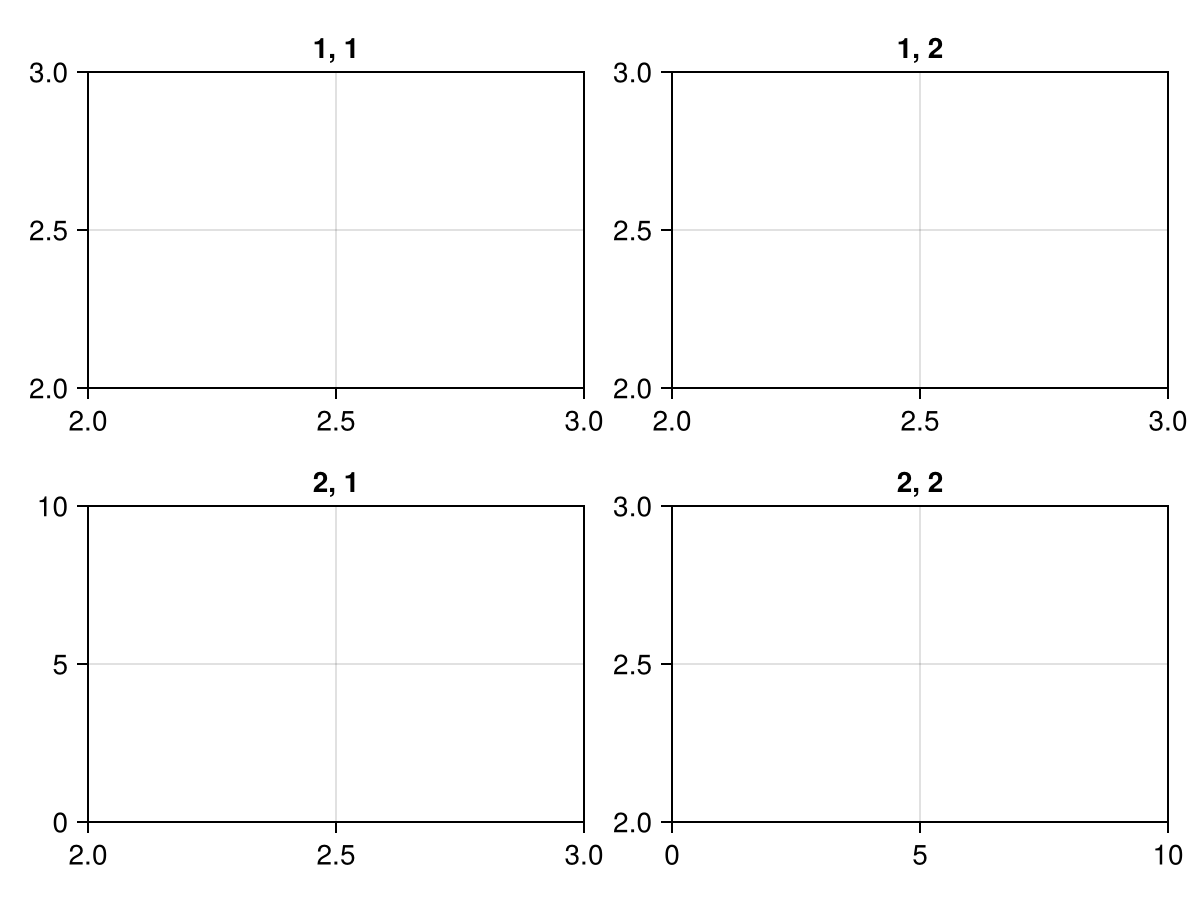
使用规格 转换/转换
|
警告尚未决定如何从 |
你可以超载 转换/转换 并返回一个数组 N.绘图,绘图 或一个 GridLayoutSpec. 它们之间的主要区别在于,返回一个 N.绘图,绘图 可以像任何食谱一样绘制成轴,而重载返回 GridLayoutSpec 可能不会。
转换/转换 为 GridLayoutSpec
using CairoMakie
import Makie.SpecApi as S

# Our custom type we want to write a conversion method for
struct PlotGrid
    nplots::Tuple{Int,Int}
end

# If we want to use the `color` attribute in the conversion, we have to
# mark it via `used_attributes`
Makie.used_attributes(::PlotGrid) = (:color,)

# The conversion method creates a grid of `Axis` objects with `Lines` plot inside
# We restrict to Plot{plot}, so that only `plot(PlotGrid(...))` works, but not e.g. `scatter(PlotGrid(...))`.
function Makie.convert_arguments(::Type{Plot{plot}}, obj::PlotGrid; color=:black)
    axes = [
        S.Axis(plots=[S.Lines(cumsum(randn(1000)); color=color)])
            for i in 1:obj.nplots[1],
                j in 1:obj.nplots[2]
    ]
    return S.GridLayout(axes)
end

# Now, when we plot `PlotGrid` we get a whole facet layout
plot(PlotGrid((3, 4)))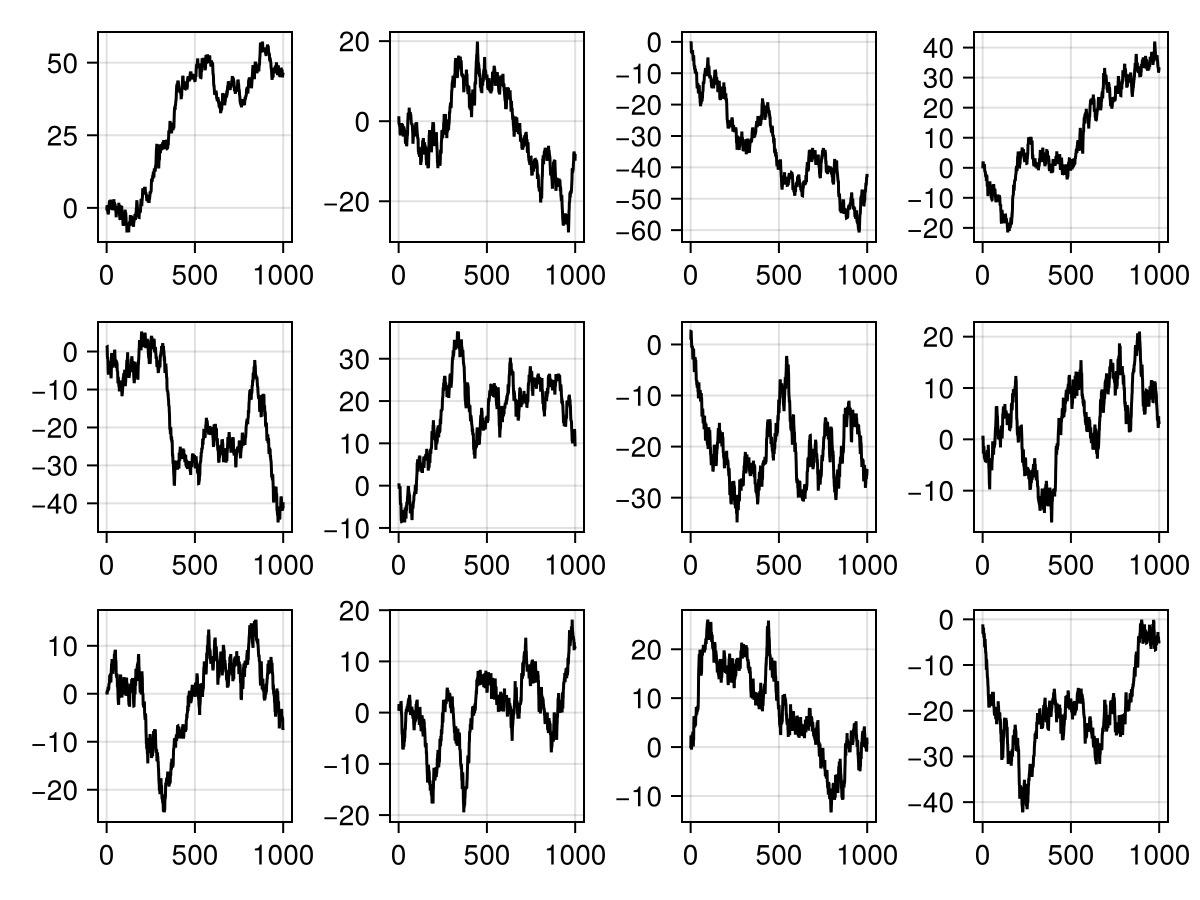
f = Figure()
plot(f[1, 1], PlotGrid((2, 2)); color=Cycled(1))
plot(f[1, 2], PlotGrid((3, 2)); color=Cycled(2))
f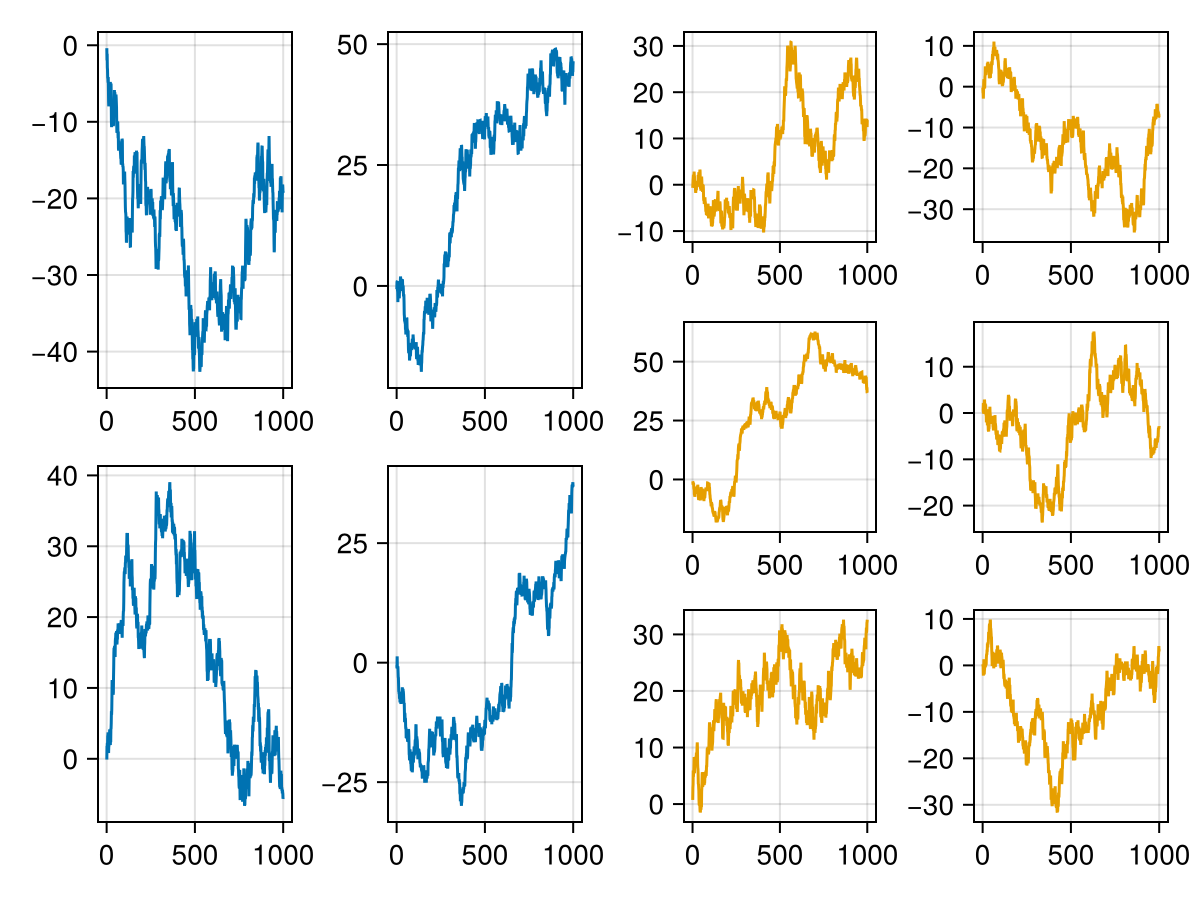
转换/转换 为 N.绘图,绘图s
我们可以返回一个向量 N.绘图,绘图s从 转换/转换 它允许我们在给定输入数据的情况下动态选择要添加的绘图对象。 虽然您也可以使用旧配方API根据输入数据选择绘图类型,但这并不容易适用于改变现有图形中这些绘图类型的可观察更新。 为此,用户不得不进行繁琐的手动簿记,现在已经被抽象出来了。
using CairoMakie
import Makie.SpecApi as S
using Random

Random.seed!(123)

# define a struct for `convert_arguments`
struct CustomMatrix
    data::Matrix{Float32}
    style::Symbol
    kw::Dict{Symbol,Any}
end
CustomMatrix(data; style, kw...) = CustomMatrix(data, style, Dict{Symbol,Any}(kw))

function Makie.convert_arguments(::Type{<:AbstractPlot}, obj::CustomMatrix)
    plots = PlotSpec[]
    if obj.style === :heatmap
        push!(plots, S.Heatmap(obj.data; obj.kw...))
    elseif obj.style === :contourf
        push!(plots, S.Contourf(obj.data; obj.kw...))
    end
    max_position = Tuple(argmax(obj.data))
    push!(plots, S.Scatter(max_position; markersize = 30, strokecolor = :white, color = :transparent, strokewidth = 4))
    return plots
end

data = randn(30, 30)

f = Figure()
ax = Axis(f[1, 1])
# We can either plot into an existing Axis
plot!(ax, CustomMatrix(data, style = :heatmap, colormap = :Blues))
# Or create a new one automatically as we are used to from the standard API
plot(f[1, 2], CustomMatrix(data, style = :contourf, colormap = :inferno))
f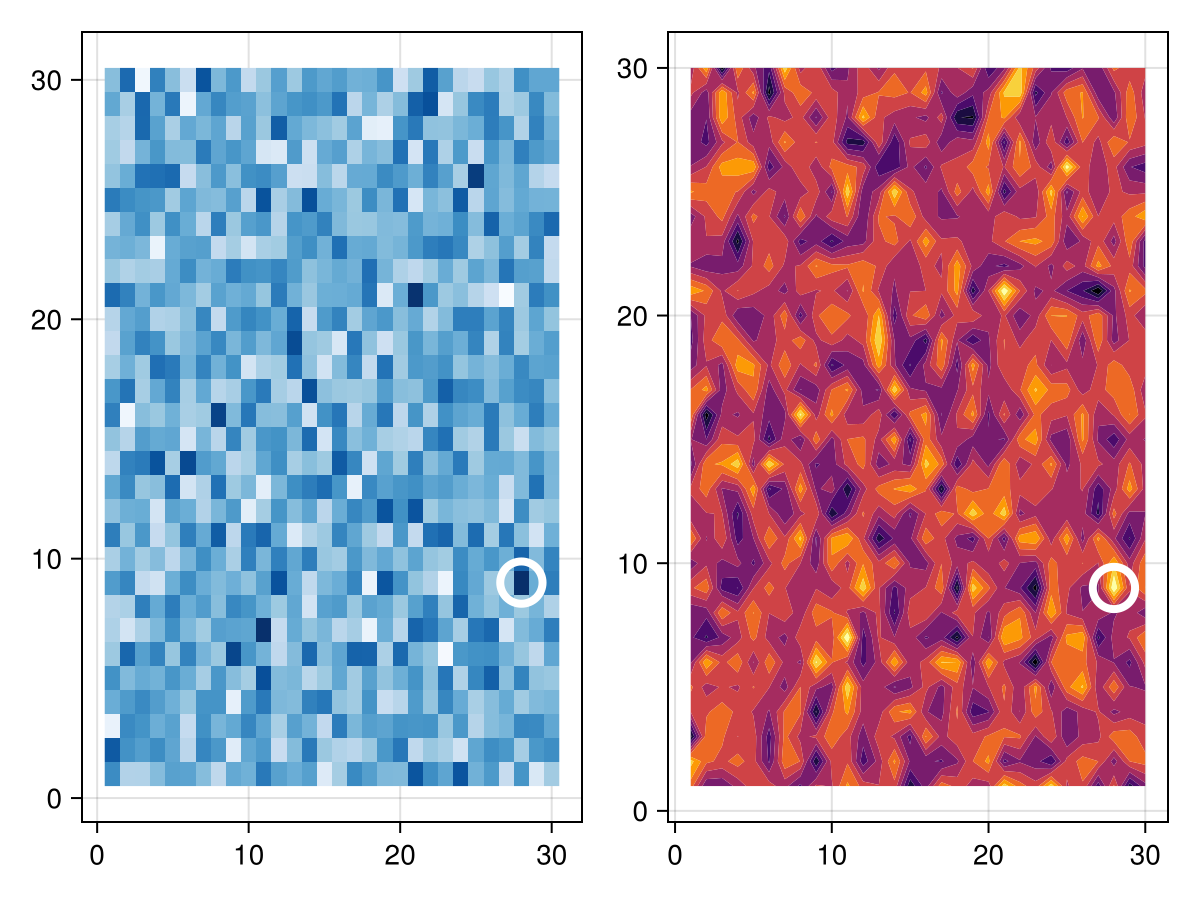
交互式示例
SpecApi面向仪表板和交互式创建复杂绘图。 下面是一个使用 滑块 和一个 菜单,以可视化一个假的模拟:
using GLMakie
using Random
import Makie.SpecApi as S

struct MySimulation
    plottype::Symbol
    arguments::AbstractVector
end

function Makie.convert_arguments(::Type{<:AbstractPlot}, sim::MySimulation)
    return map(enumerate(sim.arguments)) do (i, data)
        return PlotSpec(sim.plottype, data)
    end
end
f = Figure()
s = Slider(f[1, 1], range=1:10)
m = Menu(f[1, 2], options=[:Scatter, :Lines, :BarPlot])
sim = lift(s.value, m.selection) do n_plots, p
    Random.seed!(123)
    args = [cumsum(randn(100)) for i in 1:n_plots]
    return MySimulation(p, args)
end
ax, pl = plot(f[2, :], sim)
tight_ticklabel_spacing!(ax)
# lower priority to make sure the call back is always called last
on(sim; priority=-1) do x
    autolimits!(ax)
end

record(f, "interactive_specapi.mp4", framerate=1) do io
    pause = 0.1
    m.i_selected[] = 1
    for i in 1:4
        set_close_to!(s, i)
        sleep(pause)
        recordframe!(io)
    end
    m.i_selected[] = 2
    sleep(pause)
    recordframe!(io)
    for i in 5:7
        set_close_to!(s, i)
        sleep(pause)
        recordframe!(io)
    end
    m.i_selected[] = 3
    sleep(pause)
    recordframe!(io)
    for i in 7:10
        set_close_to!(s, i)
        sleep(pause)
        recordframe!(io)
    end
end访问创建的块
您可以使用 则(f) 语法:
import Makie.SpecApi as S
ax =  S.Axis(...)
ax.then() do actual_axis_object
    return on(events(actual_axis_object).mouseposition) do mp
        println("mouse: $(mp)")
    end
end
请注意,回调必须是纯的,因为对象将被重用,回调将被再次调用。 允许 上 或 奥纳尼,可以返回一个 观察功能 或单一的一个如上例。
ax.then() do ax
    obs1 = on(f1, events(ax).keyboardbutton)
    obs2 = on(f2, events(ax).mousebutton)
    obs_array = onany(f3, some_obs1, some_obs2)
    return [obs1, obs2, obs_array...]
end
This allows the SpecApi to clean up the callbacks on reuse.
Note that things like `hidedecorations!(axis)` is not yet supported, since we will need some better book keeping of what got mutated by that call.
One of the few functions that's already supported is `linkaxes!`:
julia axes_1=[S.Axis(title="Axis(1):i
")for i in1:3]axes_2=[S.Axis(title="Axis(2):i
")for i in1:3]for ax1in axes_1for ax2in axes_2if ax1!=ax2ax1.然后()做iax ax2。然后()做jax linkaxes!(iax,jax)返回端返回端 `