绘图方法
|
该页面正在翻译中。 |
Makie为每个绘图函数提供了一组简单但功能强大的方法,使您可以轻松创建和操作图形中最常见的方面。
每个情节对象都像 散点,散点 有两个与之关联的绘图函数,一个非变异版本(散点,散点)和一个变异版本(散开!). 这些函数具有不同的方法,根据第一个参数的不同,它们的行为略有不同。
在我们更详细地展示每个版本之前,这里有一个简短的列表。 我们使用 散点,散点 作为我们的例子,但原则适用于每个情节类型。
非变异
除了plot对象之外,非变异方法还会创建并返回一些内容,例如具有默认位置轴的图形,或给定GridPosition或GridSubposition处的轴。
scatter(args...; kwargs...) -> ::FigureAxisPlot
scatter(gridposition, args...; kwargs...) -> ::AxisPlot
[医]图 只是一个新的数字,轴和情节的集合。 为方便起见,它具有相同的显示过载 图,使 散射(args...) 显示没有进一步工作的情节。 它可以在分配时被破坏,比如 fig,ax,plotobj=scatter(args。..).
轴心图 是一个新的轴和情节的集合。 它没有特殊的显示过载,但也可以像 ax,plotobj=scatter(gridposition,args。..).
特殊关键字参数
创建 轴心图 接受特殊案件 轴心,轴心 关键字,您可以在其中传递包含应传递给创建的轴的关键字参数的类似dict的对象。 创建一个 [医]图 另外接受特殊案件 图 关键字,您可以在其中传递一个类似dict的对象,其中包含应传递给创建的图形的关键字参数。
所有其他关键字参数都作为属性传递给绘图函数。
using CairoMakie
# FigureAxisPlot takes figure and axis keywords
fig, ax, p = lines(cumsum(randn(1000)),
    figure = (size = (1000, 600),),
    axis = (ylabel = "Temperature",),
    color = :red)

# AxisPlot takes axis keyword
lines(fig[2, 1], cumsum(randn(1000)),
    axis = (xlabel = "Time (sec)", ylabel = "Stock Value"),
    color = :blue)

fig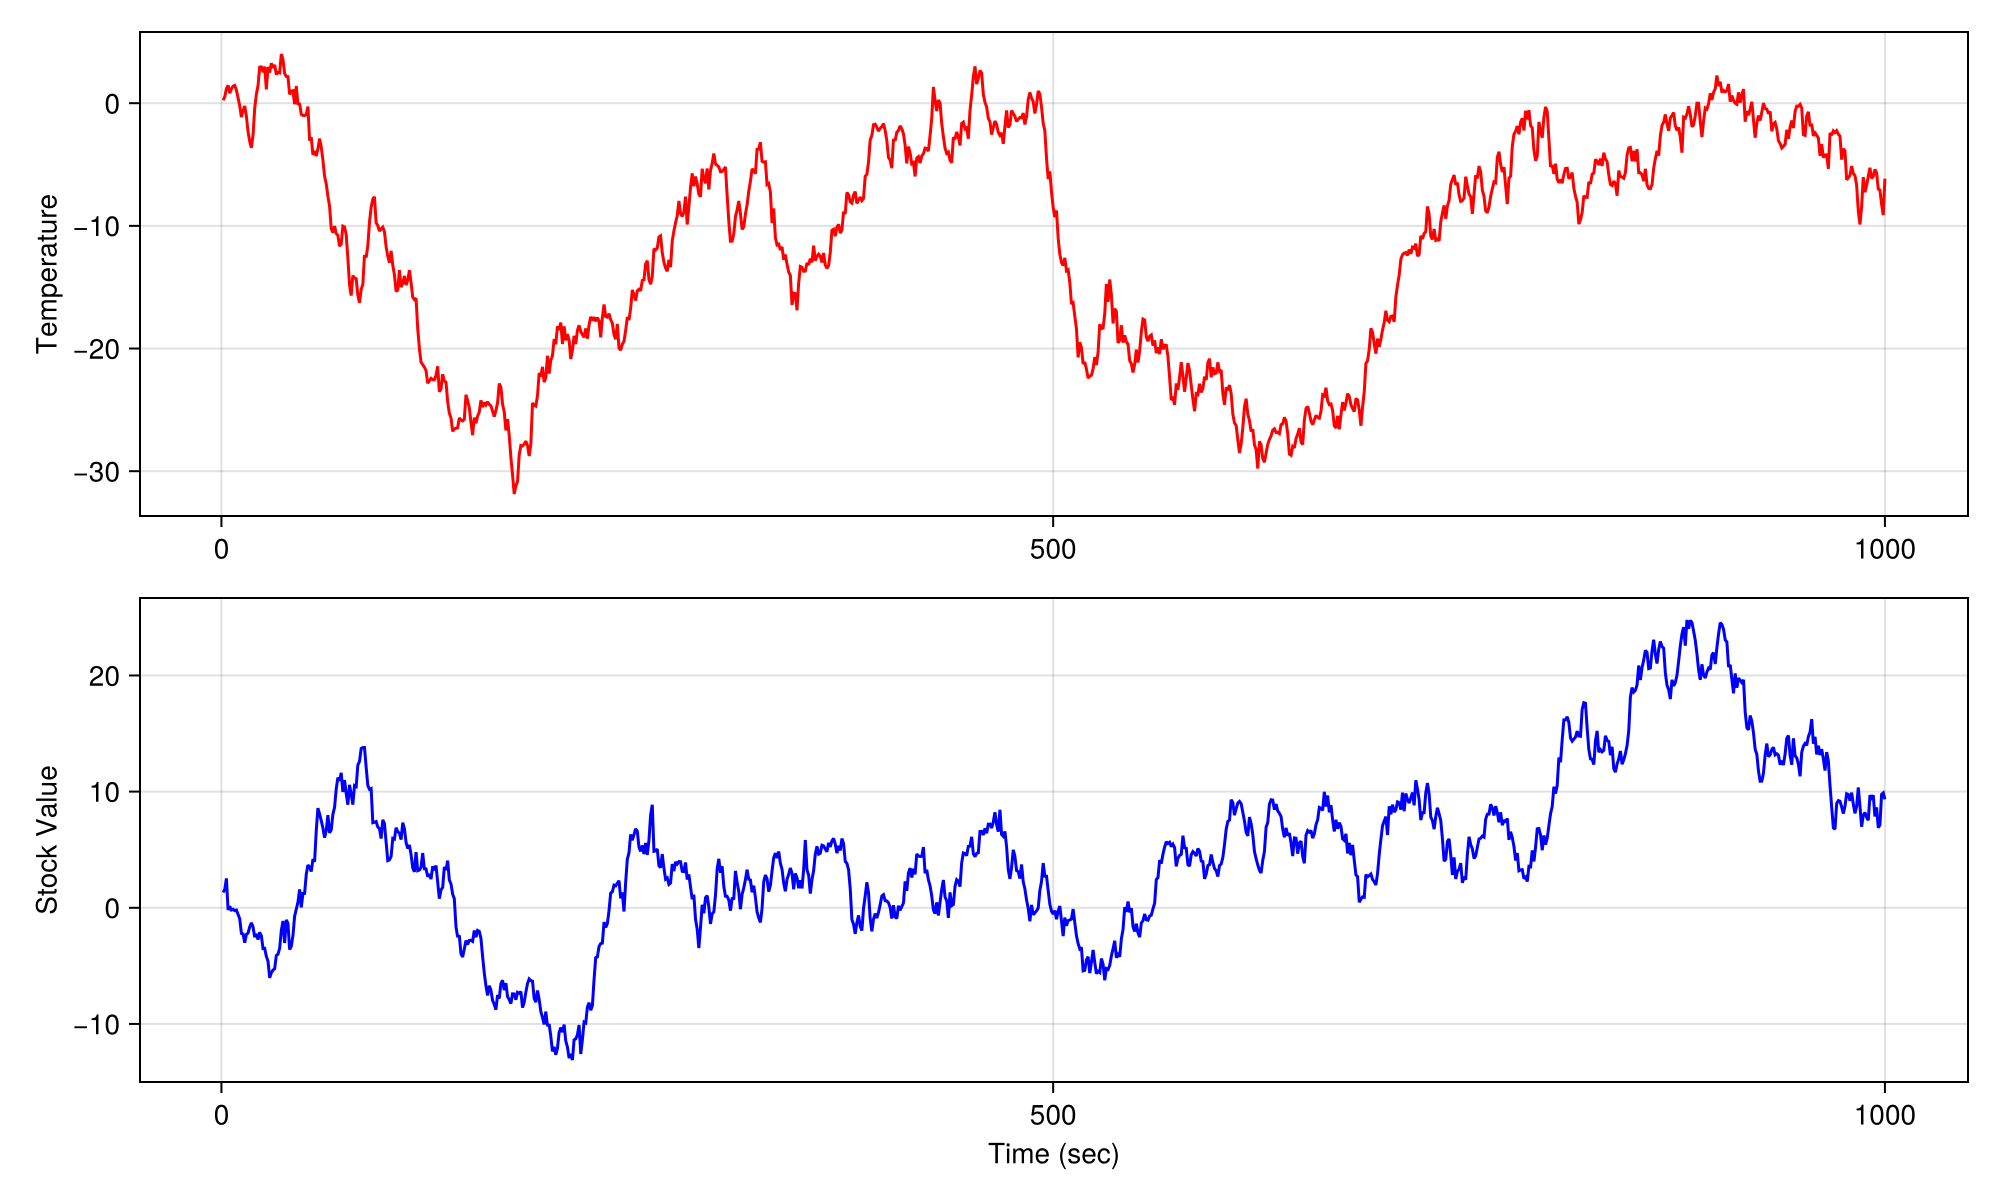
变异
变异方法总是只返回一个plot对象。 如果没有通过数字, 当前配置() 如果没有给出轴或场景,则使用 当前_axis() 被使用。
scatter!(args...; kwargs...) -> ::Scatter
scatter!(figure, args...; kwargs...) -> ::Scatter
scatter!(gridposition, args...; kwargs...) -> ::Scatter
scatter!(axis, args...; kwargs...) -> ::Scatter
scatter!(scene, args...; kwargs...) -> ::Scatter
网格化;网格化
在后台,每个 图 有一个 网格布局 从https://github.com/jkrumbiegel/GridLayoutBase.jl[GridLayoutBase.jl],它很好地处理了绘图元素的布局。 为方便起见,您可以多次索引到一个图形中以引用嵌套的网格位置,这使得快速组装复杂的布局变得容易。
例如, 图[1,2] 创建一个 网格位置 参考第1行和第2列,而 无花果[1, 2][3, 1:2] 创建一个 网格位置 这是指位于行1和列2的嵌套GridLayout中的行3和列1到列2。 该图的链接位于顶部布局的父字段中。
具有非变异绘图功能
using CairoMakie
fig = Figure()

# first row, first column
scatter(fig[1, 1], 1.0..10, sin)

# first row, second column
lines(fig[1, 2], 1.0..10, sin)

# first row, third column, then nested first row, first column
lines(fig[1, 3][1, 1], cumsum(randn(1000)), color = :blue)

# first row, third column, then nested second row, first column
lines(fig[1, 3][2, 1], cumsum(randn(1000)), color = :red)

# second row, first to third column
ax, hm = heatmap(fig[2, 1:3], randn(30, 10))

# across all rows, new column after the last one
fig[:, end+1] = Colorbar(fig, hm)

fig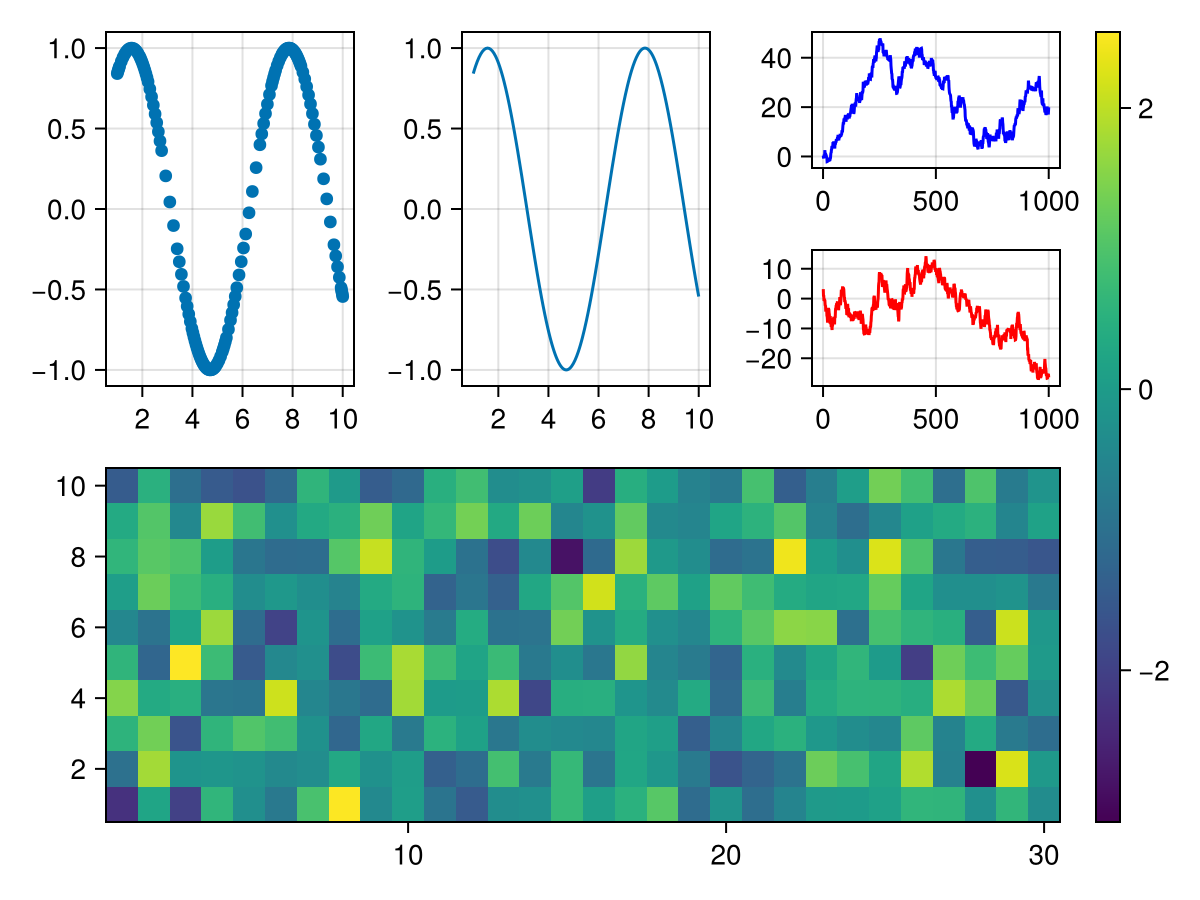
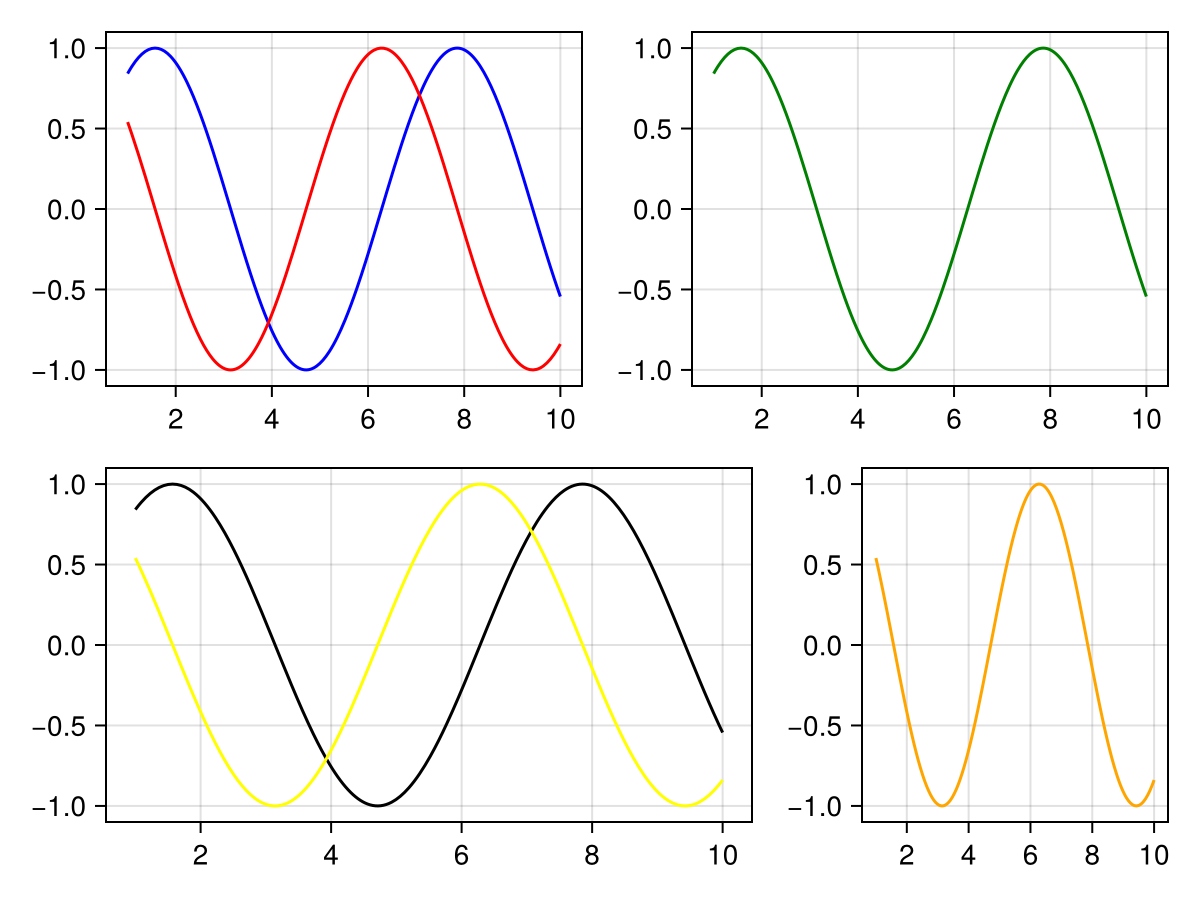
具有变异绘图功能
using CairoMakie
fig = Figure()

lines(fig[1, 1], 1.0..10, sin, color = :blue)
# this works because the previous command created an axis at fig[1, 1]
lines!(fig[1, 1], 1.0..10, cos, color = :red)

# the following line wouldn't work yet because no axis exists at fig[1, 2]
# lines!(fig[1, 2], 1.0..10, sin, color = :green)

fig[1, 2] = Axis(fig)
# now it works
lines!(fig[1, 2], 1.0..10, sin, color = :green)

# also works with nested grids
fig[2, 1:2][1, 3] = Axis(fig)
lines!(fig[2, 1:2][1, 3], 1.0..10, cos, color = :orange)

# but often it's more convenient to save an axis to reuse it
ax, _ = lines(fig[2, 1:2][1, 1:2], 1.0..10, sin, color = :black)
lines!(ax, 1.0..10, cos, color = :yellow)

fig