Software processing of simulation results in Engee
In this article, we will explain how to save simulation results using a variable. simout. Let’s consider working with a variable based on a simple example — the output of a sine wave using a block Sine Wave.
|
The default variable is
|
The simout variable in Engee: integration and interaction
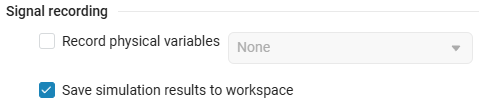
Create a model using blocks Sine Wave and Terminator. To do this, place them on the workspace, connect them with a signal line, and enable signal recording using the signal line context menu. (see Recording signals in Engee).
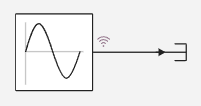
In this example, all the parameters (solver and block parameters Sine Wave) — remain by default. The graph of the sinusoidal signal simulation will be displayed in the window signal visualization ![]() .
.
Turn on signal recording  when connecting blocks on those terminals for which information is required. when connecting blocks on those terminals for which information is required.
|
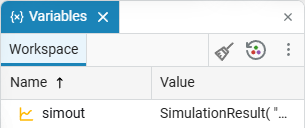
If the circuit is assembled correctly, the result of the simulation will be displayed on the graph. After the simulation ends, the variable simout it will be automatically created in the workspace. Engee.
Variable simout generates DataFrame is a data structure represented as a table. The cells in this table are automatically filled with data from the simulation results. For convenience, save the table in CSV format (named in the example result.csv).
To the variable simout you can contact us via the command collect. The command collects data from a variable simout and saves them to a new variable. To execute the command, create a variable (in this example result) and save the simulation results by entering the following code into the command line:
result = collect(simout["newmodel_1/Sine Wave.1"])where:
-
result– the name of the variable where the simulation data is stored (can be renamed). -
newmodel_1– the name of the current model. -
Sin Wave– the name of the block that outputs the data. -
1– the port number from which the values for the variable are read.simoutand to which the signal recording has been added.
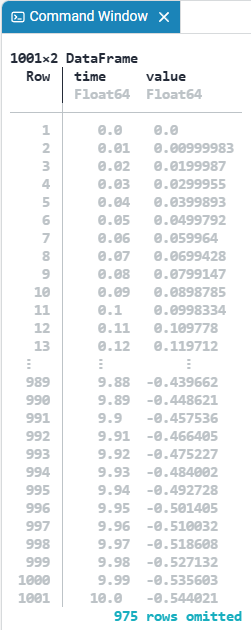
The result can be viewed as a table on the command line.
Next, write down the data about the simulation in a CSV file. Data inside a variable result save it to a CSV file result.csv using the following commands:
using CSV
CSV.write("result.csv", result)
where:
-
using CSV– a string indicating that the code will use functionality from the CSV library. In Julia, the keyword isusingIt is used to import functions and types from packages. -
CSV.write("result.csv", result)– writes data to a CSV file. FunctionCSV.writeaccepts two arguments: a CSV file "result.csv" and a variableresult. As a result, the code takes a variableresultand writes its contents to the "result.csv" file in CSV format.
The results are saved in the "result.csv" file, which is displayed in the file browser.
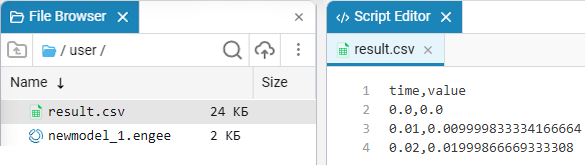
The resulting CSV file shows the numerical results of the block operation. Sine Wave with the specified parameters (in this example, by default). The results are presented in the form of columns time and value, where the block simulation value corresponds to each time point. Sine Wave.
| A CSV file with simulation results can also be obtained using the block To CSV. |
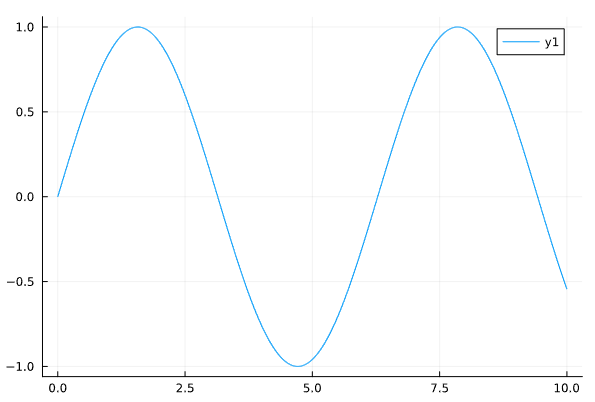
You can verify that the data is saved correctly in the variable. simout visually, by displaying the graph in the command line or script editor:
using Plots
plot(result.time, result.value)
The resulting graph will match the one that was received earlier in the window. Charts:
Thus, the article demonstrates how easy it is to save simulation results using a variable. simout and a few lines of code. This approach is easy to use and ensures the safety of simulation data in a convenient and universal CSV format.