Recording signals in Engee
 Signal recording — This is a function that records the signals created during the simulation for later analysis or visualization. Turn on the recording by clicking on the signal with the left mouse button and selecting the Record function. The enabled signal recording is indicated by an icon
  . A list of all recorded signals can be viewed through the signals menu.
  in the window signal visualization, for example, by turning on tabular display of signals
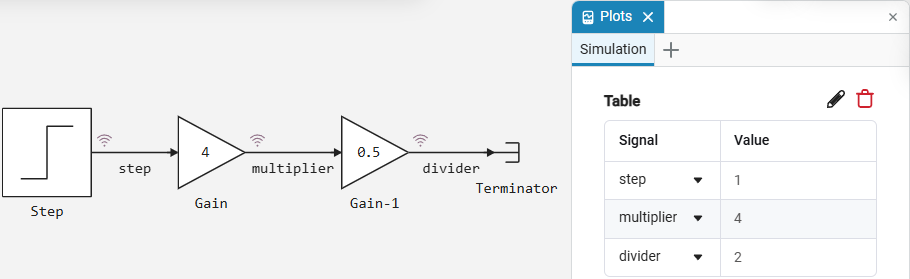
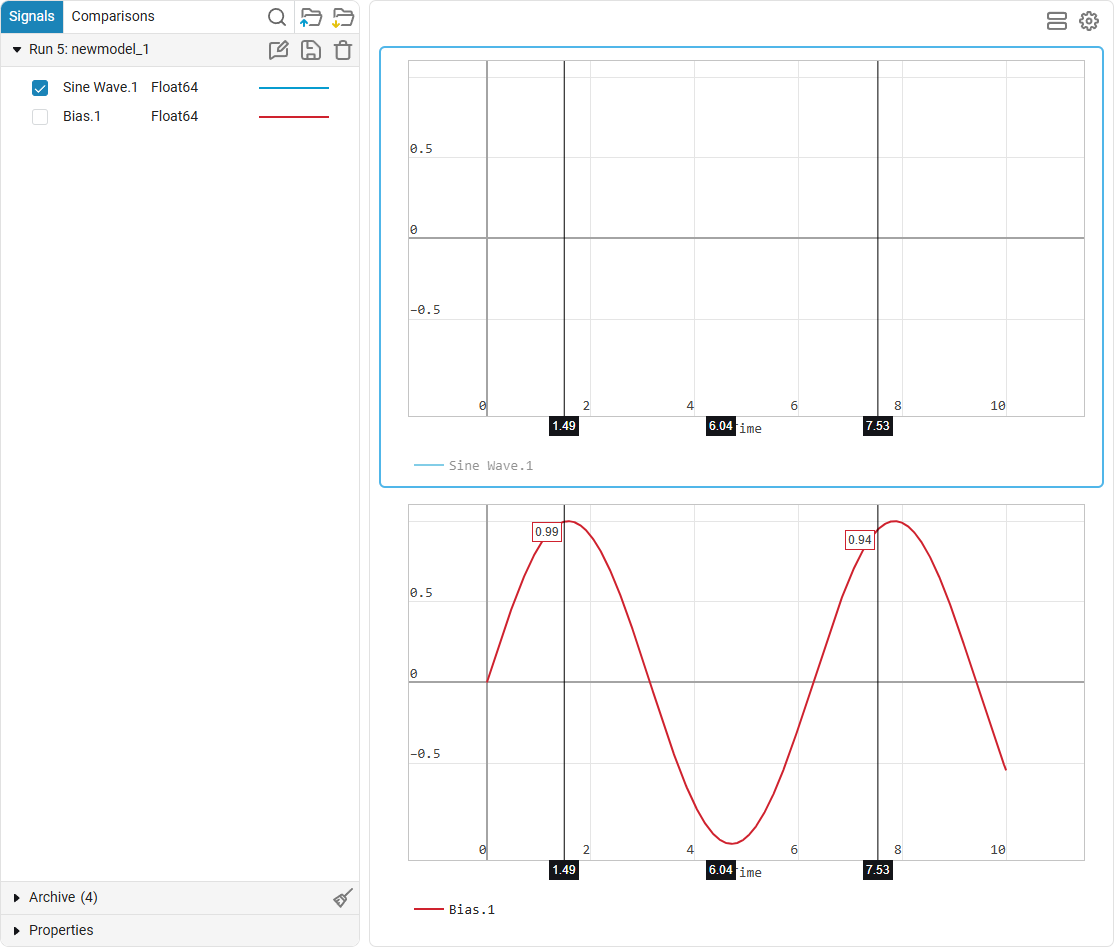
  (shows the instantaneous values of the signals):
Recording signals allows you to work with signals in various situations.:
-
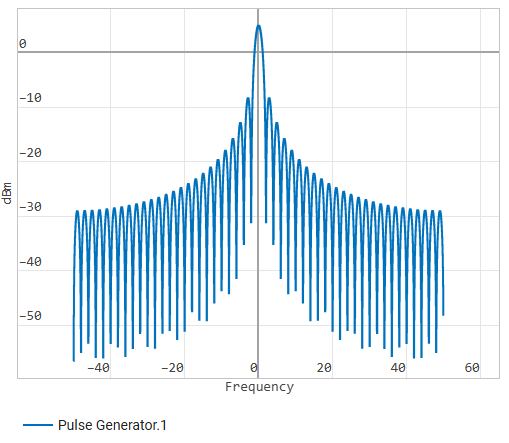
Signal visualization — Analyze your signals in the chart window using all the tools provided by it.
-
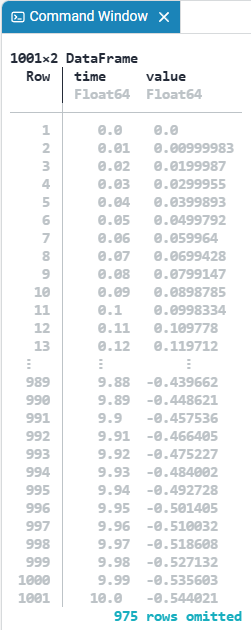
Simout — work with the simout variable, which stores the simulation results of all recorded signals.
-
Data Inspector — Evaluate the simulation results by comparing the signals from one or more runs of your models.
-
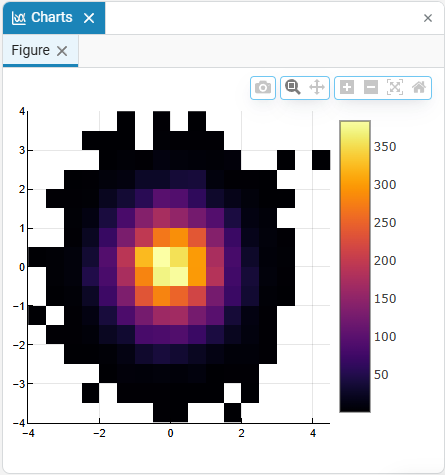
Charts
 — graphically visualize the code from command line
  .
.