Charts
|
The graphics tool is designed to plot graphs using code. To visualize the model signals, use the tool |
Charts ![]() — it is a data visualization tool in Engee, which displays the graphs specified in command prompt
— it is a data visualization tool in Engee, which displays the graphs specified in command prompt  .
.
Window assignment "Charts" — this is the provision of a workflow during calculations and simulation of models. It allows you to clearly separate the visualization obtained from the execution of the code and the visualization of the simulation results of the model (through the window "Signal visualization"), which eliminates confusion and overwriting of graphs.
| The tool "Charts" works only with input via the command line and does not interact with script editor. |
|
New charts are opened in separate tabs of the window "Charts", which prevents them from being accidentally overwritten. By default |
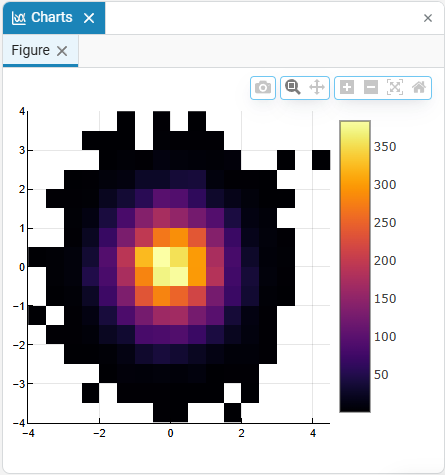
In the window "Charts" when you hover the cursor over the coordinate plane, the following options are available:
-
Download plot as a png — saves the coordinate plane to a PNG file.
-
Zoom — performs scaling of the coordinate plane. It becomes possible to select an area and enlarge its contents. To return the scale By default, double-click on the coordinate plane with the left mouse button.
-
Pan — a tool for moving a graph on a coordinate plane. Allows you to move the chart in any direction using the mouse cursor.
-
Select a rectangular area — creates a scalable frame on the selected rectangular area.
-
Lasso — creates a selected area of any shape.
-
Zoom in — zooms in on the coordinate plane.
-
Zoom out — reduces the scale of the coordinate plane.
-
Autoscale — returns the scale value of the coordinate plane By default.
-
Reset axes display to defaults — Returns graph displays and coordinate plane settings By default.
The key advantage of the tool is full user control over the appearance of the graphs, since the code for generating them is created directly on the command line. For visualization in Julia, the Plots package is mainly used, but direct function calls are also available, for example:
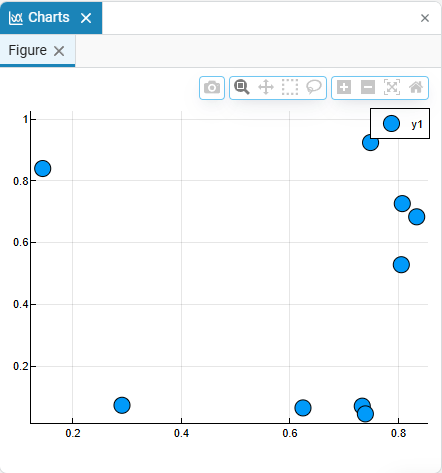
Code for Julia |
Displayed graph |
|---|---|
|
|
|
|
|
|
|
|
For interesting scenarios for working with graphs using the Plots package, see the article Plotting graphs tutorial.