Model Data Editor
Model Data Editor  — This is an Engee tool designed to control model signals. The application makes it easier to find the right signals in open models and subsystems thanks to its user-friendly interface, making it easier to analyze and configure signals for quick work with the model.
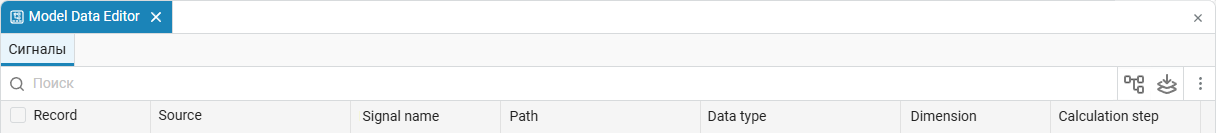
To open the application, click on in the workspace of the model. The application will automatically show the signals of the current model without nested subsystems. To display the signals from the subsystems, press Show signals of nested subsystems  .
.
When viewing nested subsystems is enabled (Show signals of nested subsystems ) elements located inside custom blocks  and blocks with masks are not displayed, but become visible if you open the mask/enter the user block. and blocks with masks are not displayed, but become visible if you open the mask/enter the user block.
|
| The physical models do not have the usual signals — there is only an imitation of physical connections. Therefore Model Data Editor does not show signals for blocks from the library Physical Modeling. |
Interface
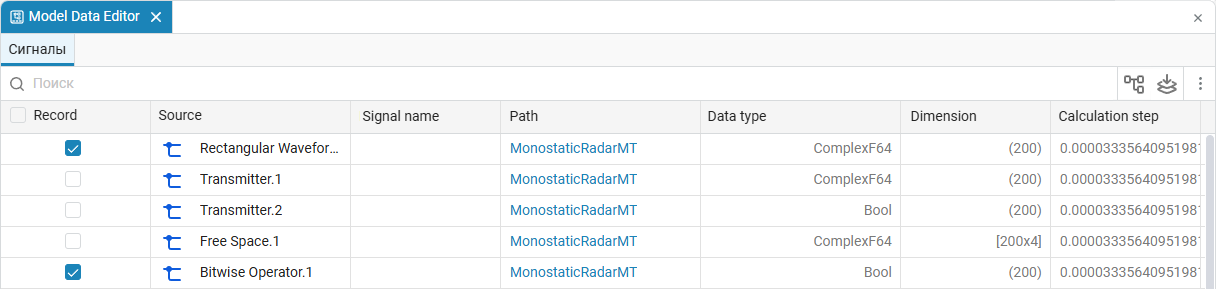
The interface is presented in the form of a table with the ability to search, sort and records  It consists of the following columns:
| Record |
A checkbox for enabling/disabling signal recording |
| Source |
The block from which the signal originates. The name of the source is displayed in the format |
| Signal name |
Signal name (may not be specified) |
| Path |
The route of the signal from the block to the nearest block connected by the signal (highlighted in blue). It is presented in the table as links and is needed to navigate through the model. |
| Data type |
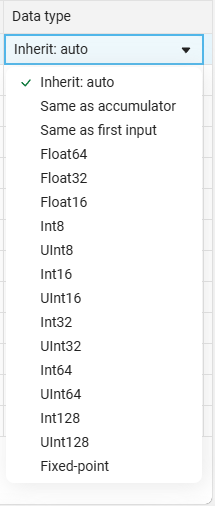
Signal data type. The value in this column can be edited by selecting a cell in the column Data type and set the desired type from the drop-down list (inheritance mode or specific numeric type) |
| Dimension |
Signal dimension |
| Calculation step |
The step of calculating the signal. For virtual subsystems (regular subsystems with Treat as atomic unit turned off), the calculation step parameter is not applied, so the value is not displayed in the table. |
So, Model Data Editor allows:
-
Enable and disable signal recording:
-
View all model signals in one window. Button
Show signals of nested subsystems enables or disables the display of signals from nested subsystems. Viewing is disabled by default.;The application automatically updates the list of signals when the model structure changes. -
Edit the signal data type. In the column Data type You can select the inheritance mode or set a fixed signal data type from the list.:
-
Perform search
 according to the model. Search It allows you to quickly find the necessary signals by name or source. To set a signal name, double-click on it and enter the desired name. When you enter text in the search bar, all matching elements are highlighted.:
-
Go to a specific signal in the model. Find the desired signal, then in the column Path double-click on the line with this signal. The model will be automatically centered in the middle of the workspace on this signal.;
-
Compile the model. Button
 Update model starts the compilation process of the model, thereby updating the data in the application table, since not all model changes get into it at once. Editing of signal parameters is not available during compilation.;
 -
Sort the data in the table. You can sort the contents alphabetically and by value (for columns only Dimension and Calculation step) by clicking on the column name.
You can also:
-
Show/hide columns. Click the button
 , select Show columns and the desired column name from the drop-down list:
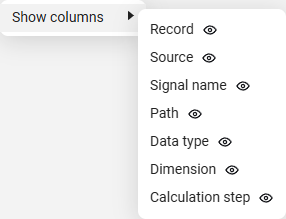
-
Automatically scale the size of the columns by double-clicking on the border between them;
-
Change the width of the columns by dragging their border with the left mouse button held down;
-
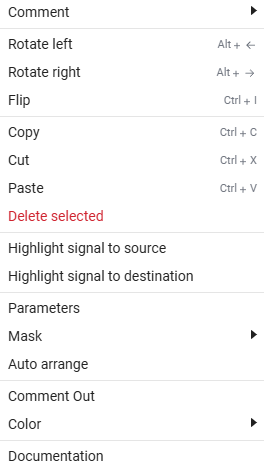
Open a context menu with functions applicable to all selected blocks and signals on the canvas. To do this, select several rows with the necessary signals/blocks in the table using Shift+LKM. Then right-click on one of the selected blocks on the canvas to open the context menu.:
Selecting a signal in the table highlights it on the canvas. When a block/signal is highlighted on the canvas, the corresponding row in the table is also highlighted.