medfilt1
One-dimensional median filtering.
| Library |
|
Arguments
Input arguments
# x — input signal
+
vector | the matrix | An N-dimensional array
Details
An input signal specified as a real vector, matrix, or multidimensional array.
| Data types |
|
# n — filter order
+
3 (by default) | scalar
Details
The order of the one-dimensional median filter, given as a positive integer scalar:
-
If
nIf it’s an odd number, theny(k)— medianx(k-(n-1)//2:k+(n-1)//2). -
If
neven, theny(k)— medianx(k-n/2:k+(n/2)-1). In this case, the function sorts the numbers and calculates the arithmetic mean of the two average elements of the sorted list.
| Data types |
|
# dim — filtered measurement
+
scalar
#
nanflag —
condition NaN
"includenan" (default) | "omitnan"
Details
Condition NaN, set as "includenan" or "omitnan":
-
"includenan"returns a filtered signal such that the median of any segment containingNaN, is also equal toNaN. -
"omitnan"returns a filtered signal such that the median of any segment containingNaN, is equal to the median of values other thanNaN. If all the segment elements areNaN, the result will beNaN.
# padding — filtering of boundary values
+
"zeropad" (default) | "truncate"
Details
Filtering of boundary values, is defined as "zeropad" or "truncate":
-
"zeropad"considers the signal to be zero beyond the boundary values. -
"truncate"calculates the medians of the smaller segments as the signal boundaries are reached.
Examples
Noise reduction using median filtering
Details
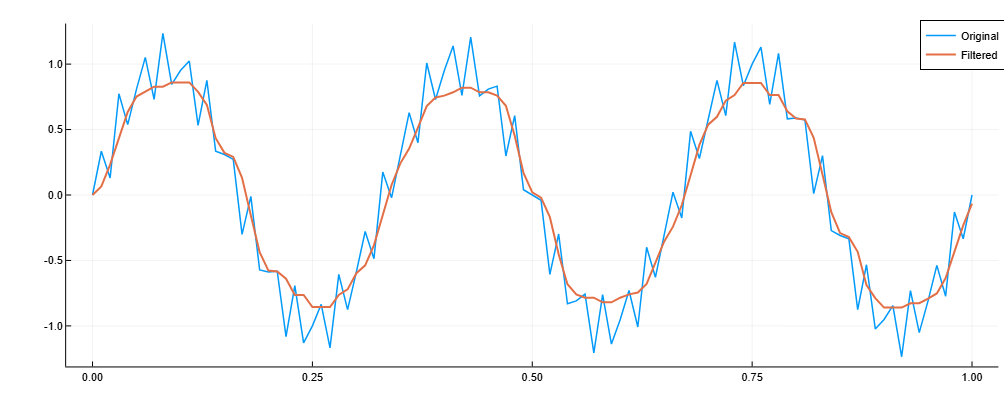
Generate a sinusoidal signal with a sampling frequency 100 Hz during 1 seconds. Add a higher frequency sinusoid to simulate noise. Using the median filter 10-th order for smoothing the signal. Let’s build a graph.
import EngeeDSP.Functions: medfilt1

fs = 100
t = range(0, 1, step=1/fs)
x = sin.(2π * t * 3) .+ 0.25 * sin.(2π * t * 40)

y = medfilt1(x, 10)

p = plot(t, x, label="Original", linewidth=1.5)
plot!(p, t, y, label="Filtered", linewidth=2)


plot!(p, legend=:topright, framestyle=:box)