tropopl
Losses on an inclined track due to the absorption of gases by the atmosphere.
| Library |
|
Syntax
Function call
-
Lgas = tropopl(R,f,platformHeight,el)— Calculates propagation path losses due to tropospheric refraction using the International Telecommunication Union (ITU) standard atmospheric model, known as the Mean Annual Global Reference Atmosphere (MAGRA), which approximates the 1976 standard atmosphere of the United States with a slight relative error.
-
Lgas = tropopl(___,Name=Value)— sets parameters using one or more arguments of the type «name-value» in addition to the input arguments of the previous syntax.
-
Lgas,Llens = tropopl(___)— calculates the corresponding lens losses. Changing the refractive index as a function of altitude causes the atmosphere to act as a lens, the loss of which is independent of frequency. The rays coming from the antenna are refracted in the troposphere, and the energy radiated within a certain angular range is distributed over a slightly larger angular sector, thereby reducing the energy density compared to propagation in a vacuum.
Arguments
Input arguments
# R — oblique range
+
scalar | vector
Details
The oblique range in meters, set as a positive scalar or a real length vector .
| Типы данных |
|
# f — radar frequency
+
scalar | vector
Details
The radar frequency in Hz, specified as a positive real scalar or a positive length vector .
| Типы данных |
|
# platformHeight — height of the radar installation
+
scalar
Details
The height of the radar installation above mean sea level in meters, set as a positive scalar of 0 before 100 Values outside the specified range lead to the output NaN.
| Типы данных |
|
# el — elevation angle
+
scalar | vector
Details
The elevation angle of the propagation path in degrees, set as a scalar or a real vector of length .
| Типы данных |
|
Input arguments «name-value»
Specify optional argument pairs in the format Name = Value, where Name — the name of the argument, and Value — the appropriate value. Type arguments «name-value» they should be placed after the other arguments, but the order of the pairs does not matter.
Example: tropopl(R, f, ht, el, LatitudeModel = "Mid", Season = "Winter") sets the model of mid-latitudes in winter.
# WaterVaporDensity — standard absolute humidity at ground level
+
7.5 (by default) | scalar
Details
The standard absolute humidity at ground level in g/m 3, given as a scalar.
To use this argument, set for the argument LatitudeModel meaning "Standard".
| Типы данных |
|
# ScaleHeight — height scale above sea level
+
2.0e3 (by default) | scalar
Details
The height scale above mean sea level in meters, set as a positive scalar.
To use this argument, set for the argument LatitudeModel meaning "Standard". In a dry atmosphere, set this argument to 6.0e3 m.
| Типы данных |
|
# LatitudeModel — Latitude reference model
+
"Standard" (by default) | "Low" | "Mid" | "High"
Details
The reference model of latitude, set as one of the following values:
-
"Standard"— The model represents the Standard Global Atmosphere (MAGRA), characterized by annual averages of temperature and pressure around the globe. -
"Low"— the model is designed for low latitudes less than22degrees, where seasonal fluctuations are insignificant. -
"Mid"— the model is designed for mid-latitudes from22before45degrees with seasonal profiles for values"Summer"and"Winter", set using the argumentSeason. -
"High"— the model is designed for higher latitudes than45degrees with seasonal profiles for values"Summer"and"Winter", set using the argumentSeason.
# Season — seasonal profile
+
"Summer" (by default) | "Winter"
Details
Seasonal profile for latitude models "Mid" and "High", set as "Summer" or "Winter". Other latitude models ignore this argument.
# Atmospheremeasuries — Custom atmospheric measurements
+
the matrix
Details
Custom atmospheric measurements for calculating the refractive index, specified as a matrix size on , where — the number of height measurements. Meaning must be greater than or equal to 2. The first column of the matrix is the atmospheric temperature in kelvin, the second column is atmospheric pressure in gPa, the third column is absolute humidity in g/m3, and the fourth column is the measurement altitude above mean sea level in meters, indicated in ascending order. When using a custom model, all other arguments are of the type «name-value» are ignored, and the output refractive index is applied to the input height.
The model used by the function tropopl, is based on the assumptions of geometric optics, so waveguide propagation and sub-refraction should not be present in the provided measurements. If atmospheric measurements are provided that demonstrate waveguide propagation and subrefraction, this function will return an error.
|
|
| Типы данных |
|
Examples
Plotting the dependence of attenuation on range
Details
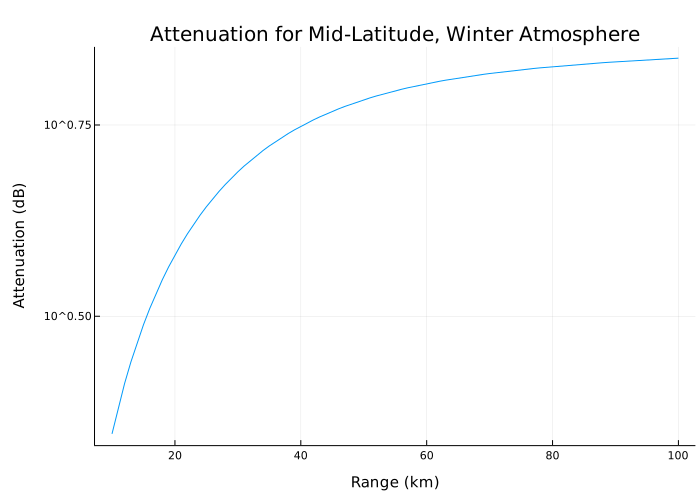
Calculate the dependence of attenuation on range for the radar frequency 100 GHz at elevation angle 5 degrees, using a model of the atmosphere of the middle latitudes in winter.
import EngeePhased.Functions: tropopl

R  = (10:100) * 1e3    # m
f  = 100e9             # Hz
ht = 0                 # m
el = 5                 # deg
Lgas = tropopl(R, f, ht, el, LatitudeModel = "Mid", Season = "Winter")
Let’s build a graph with the results.
plot(R * 1e-3, Lgas,
     yscale = :log10,
     xlabel = "Range (km)",
     ylabel = "Attenuation (dB)",
     title = "Attenuation for Mid-Latitude, Winter Atmosphere")