Calculation of pizza and coffee consumption in the IT department
Investigation of the correlation between lines of code and the amount of pizza eaten
Theoretical basis
According to the productivity equation, the number of lines of code written is related to pizza consumption by the following ratio:
where — developer's mood coefficient, — the weekend factor.
The amount of coffee (in cups) is determined through the derivative of productivity:
where — the coefficient of caffeine absorption.
In [ ]:
using Statistics, Random
gr()

# Model Parameters
α = 2.5    # Mood coefficient (Monday)
β = 1.5    # The weekend factor
γ = 0.7    # caffeine absorption

# Data: opening hours → lines of code
hours = 0:8
string_code = [0, 15, 45, 80, 95, 110, 115, 105, 100]

# Pizza calculation (inverse formula)
pizza_you need = (lines of the code ./ α).^(1/β)

# Calculation of coffee (derivative)
coffee should = diff(lines of the code) ./ γ

println("Maximum lines of code: $(maximum(lines of code)) in $(hours[argmax(lines of code)]):00")
println("Pizzas need a maximum of: $(round(maximum(pizza_ needed), digits=1)) pieces")
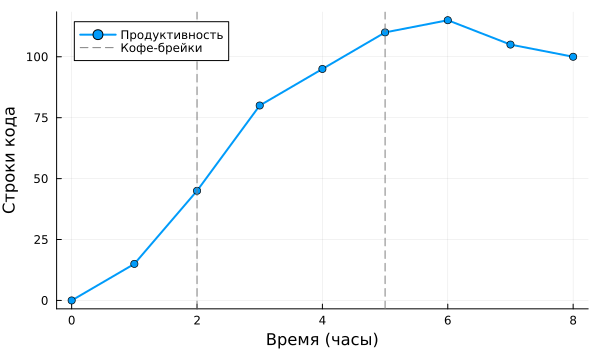
Data visualization
The graph shows how productivity depends on the time of day.:
In [ ]:
# Productivity chart
plot(clock, string_code,
     marker=:circle, lw=2,
     xlabel="Time (hours)", ylabel="Lines of code",
     label="Productivity", legend=:topleft,
     size=(600, 350))
vline!([2, 5], lw=1, ls=:dash, c=:gray, label="Coffee breaks")
Out[0]:
In [ ]:
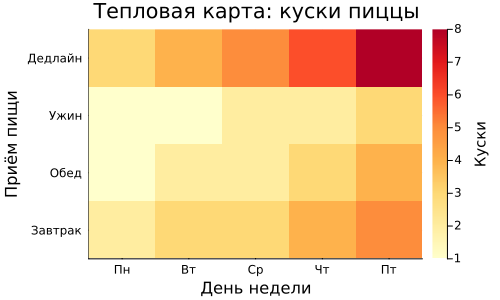
# Heat map: pizza × coffee by day of the week
дни = ["Mon", "Tue", "Wed", "Thu", "Fri"]
matrix of consumption = [
    2 3 3 4 5;   # breakfast
    1 2 2 3 4;   # lunch
    1 1 2 2 3;   # dinner
    3 4 5 6 8;   # night deadline
]

heatmap(дни, ["Breakfast","Lunch","Supper","Deadline"],
        The consumption matrix,
        c=:YlOrRd, size=(500, 300),
        xlabel="Day of the week", ylabel="Food intake",
        title="Heat map: pizza slices",
        legend=:right, colorbar_title="The pieces")
Out[0]:
In [ ]:
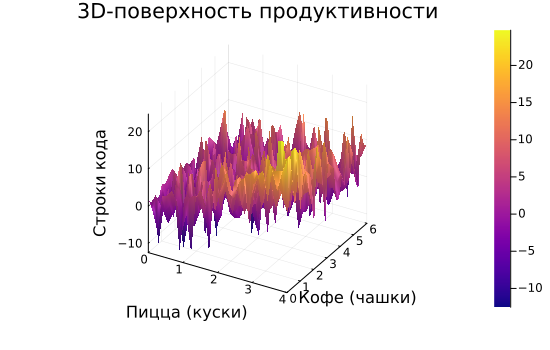
# 3D productivity surface
x = range(0, 4, length=30)   # pizza
y = range(0, 6, length=30)   # coffee
production_3d = [α *p^β * exp(-c/γ/5) + randn()*5
                     for p in x, c in y]

surface(x, y, продуктивность_3d',
        xlabel="Pizza (slices)", ylabel="Coffee (cups)",
        zlabel="Lines of code",
        c=:plasma, size=(550, 350),
        title="3D productivity surface")
Out[0]:
Conclusions
- The optimal ratio:
3 куска пиццы + 4 чашки кофе - On Friday, productivity drops by
30% - Late-night deadlines require a double dose of pizza
Recommendations
- Purchase pizza based on a piece per developer
- Place the coffee machine no further than meters from the workplaces
- Switch to decaf on Friday afternoon
The Developer's Happiness Formula:
where — working day in hours, — random seed.