2-D CFAR Detector
A block of the CFAR receiver detection algorithm for two-dimensional signals.
blockType: CFARDetector2D
|
Path in the library: |
Description
Block 2-D CFAR Detector implements a detector with a constant false alarm probability value for two-dimensional signals. Detection occurs when the value of a signal cell exceeds a threshold value. To maintain a constant probability of a false alarm, the threshold is set to a multiple of the image noise power. The detector evaluates the noise power from neighboring cells surrounding the cell under test (CUT) using one of three cell averaging methods or the Order statistics (OS) method.
The methods of cell averaging are:
-
Cell averaging (CA).
-
Averaging over the largest cell (GOCA).
-
Smallest cell Averaging (SOCA).
For each test cell, the detector:
-
Evaluates noise statistics based on cell values in the training band surrounding the test cell.
-
Calculates the threshold by multiplying the noise estimate by the threshold factor.
-
Compares the value of the cell under test with a threshold value to determine the presence or absence of a target. If the value is greater than the threshold, then the goal is present.
Ports
Entrance
X — input signal
real matrix M by N | real array M by N by P
The input signal is given as a real matrix of size M by N or a real array of size M by N by P. M and N represent rows and columns of the matrix.
Data types: Float16, Float32, Float64, Int8, Int16, Int32, Int64, UInt8, UInt16, UInt32, UInt64, Bool
idx is the index vector of the pass cells being checked:q[<br>] a matrix of positive integers 2 by L
The location of the test cells, defined as a matrix of positive integers of size 2 by L, where L is the number of test cells. Each idx column specifies the row and column index of the test cell. The location of the test cells is limited so that their training areas lie completely within the input signal.
Data types: Float16, Float32, Float64, Int8, Int16, Int32, Int64, UInt8, UInt16, UInt32, UInt64, Bool
K is the threshold coefficient of pass detection:q[<br>] positive scalar
The threshold coefficient used to calculate the detection threshold is set as a positive scalar value.
Data types: Float16, Float32, Float64, Int8, Int16, Int32, Int64, UInt8, UInt16, UInt32, UInt64, Bool
Output
Y — pass detector output:q[<br>] logic matrix (default) | The real matrix
The format of the data output from the detector depends on the Output Format property.:
-
If the Output Format parameter is set to
Cut result, then Y is a D-by-P matrix containing the logical results of detecting the cells under test. D is the length ofcutidx', and P is the value of the third dimension X. The Y lines correspond to the `cutidxlines. For each row, Y contains a logical1in the column if there is a detection in the corresponding cell X. Otherwise, Y contains a logical `0'. -
If the Output Format parameter is set to
Detection index, then Y is a K—by-L matrix containing detection indexes. K is the number of dimensions X. L is the number of detections found in the input data. If X is a matrix, then Y contains the row and column indexes of each detection in X in the form[detrow;detcol]. If X is an array, then Y contains the indexes of rows, columns, and pages of each detection in X in the form[detrow;detcol;detpage]. If the Source of the number of detections parameter is set toProperty, then L is equal to the value of the Maximum number of detections parameter. If the number of actual detections is less than this value, then the columns without detections are set toNaN.
Data types: Float16, Float32, Float64, Int8, Int16, Int32, Int64, UInt8, UInt16, UInt32, UInt64, Bool
Th — calculated threshold for pass detection:q[<br>] The real matrix
The calculated detection threshold for each detected cell, returned as a real matrix. The data on the Th port has the same dimension as Y.
-
If the Output format parameter is set to
Detection index, then Th returns the detection threshold. -
If the Output format parameter is set to
CUT result', then Th returns the detection threshold for each corresponding detection in Y. If the Source of the number of detections parameter is set to `Property, then L is equal to the value of the Maximum number of detections parameter. If the number of actual detections is less than this value, then the columns without detections are set toNaN.
Dependencies
To use this port, select the Output Detection Threshold checkbox.
Data types: Float16, Float32, Float64, Int8, Int16, Int32, Int64, UInt8, UInt16, UInt32, UInt64, Bool
N — estimated noise power of
The real matrix
An estimate of the noise power for each detected cell, returned as a real matrix.
-
If the Output format parameter is set to
Detection index, then N returns the noise power if the Y element is1, andNaNif the Y element is0. If the Source of the number of detections parameter is set toProperty, then L is equal to the value of the Maximum number of detections parameter. If the number of actual detections is less than this value, then the columns without detections are set toNaN. -
If the Output format parameter is set to
CUT result, then N returns the noise power for each corresponding detection in Y.
Dependencies
To use this port, select the Output estimated noise power checkbox.
Data types: Float16, Float32, Float64, Int8, Int16, Int32, Int64, UInt8, UInt16, UInt32, UInt64, Bool
Parameters
CFAR algorithm — pass noise power estimation algorithm:q[<br>] CA (default) | GOCA | SOCA | OS
The noise power estimation algorithm, specified as CA, GOCA, SOCA or OS'. For `CA, GOCA, SOCA, the noise power is the average value of the cells in the training sample.
For OS, the noise power is the kth value of the cell, obtained as a result of numerical ordering of all the values of the training cells. Set k with the Rank of order statistical parameter.
-
'CA` is a cell—by-cell averaging algorithm. Calculates the sample average of all the training cells surrounding the CUT cell.
-
GOCA is a cell—by-cell averaging algorithm. Divides the two-dimensional learning window surrounding the CUT cell into left and right halves. The algorithm then calculates a sample average for each half and selects the largest average.
-
SOCA is an algorithm for averaging over the smallest cell. Divides the two-dimensional learning window surrounding the CUT cell into left and right halves. The algorithm then calculates the sample average for each half and selects the smallest average.
-
'OS' is an algorithm for order statistics. Sorts the training cells in ascending order of numerical values. The algorithm then selects the kth value from the list. k is the rank set by the Rank of order statistical parameter.
Rank of order statistical — rank of ordinal statistics
1 (default) | positive integer
Set the rank of the ordinal statistics used in the two-dimensional CFAR algorithm as a positive integer. The value of this parameter must be in the range from 1 to , where — the number of training cells. With the value 1, the smallest value in the training area is selected.
Dependencies
To use this parameter, set the CFAR Algorithm parameter to OS.
Size in cells of the guard region band — width of the protective pass band:q[<br>] [1,1] (default) | non-negative integer scalar | 2-element vector of positive integers
The number of security cells in a row and column on each side of the cell under test, in the form of non-negative integers. The first element sets the size of the protective strip according to the size of the string. The second element sets the size of the security area according to the size of the string. Specifying Size in cells of the guard region band as a scalar is equivalent to specifying a vector with the same value for both dimensions. For example, the value [1 1] indicates that there is an area around each CUT cell that is one security cell wide.
Size in cells of the training region band — width of the training area
[1,1] (default) | non-negative integer scalar | 2-element vector of positive integers
The size in the cells of the strip of the training area, set as a non-negative integer or a 1 by 2 matrix of non-negative integers. The first element sets the size of the learning band by row, the second by column. Specifying Size in cells of the training region band as a scalar is equivalent to specifying a vector with the same value for both dimensions. For example, the value [1 1] means that for each test cell there is an area with a width of one training cell surrounding the protective area.
Threshold factor method — a method for determining the threshold coefficient of
Auto (default) | Input port | Custom
The method for determining the threshold coefficient is set as Auto, Input port or `Custom'.
-
Auto— the threshold coefficient is determined based on estimated noise statistics and the probability of a false alarm. -
`Input port' — the threshold coefficient is set using the input port K.
-
Custom— the threshold factor is set using the Custom threshold factor parameter.
Custom threshold factor — configurable threshold pass factor:q[<br>] 1 (default) | positive scalar
Configurable threshold detection coefficient, set as a positive scalar.
Dependencies
To use this parameter, set the Threshold factor method parameter to Custom.
Probability of false alarm — probability of false alarm
0.1 (default) | a real scalar in the range from 0 to 1
The probability of a false alarm, set as a real scalar in the range from 0 to `1'. The threshold coefficient can be calculated from the required false alarm probability.
Dependencies
To use this parameter, set the Threshold factor method parameter to Auto.
Output format — the format of the detection results is
CUT result (default) | Detection index
The format of the detection results is set as CUT result or `Detection index'.
-
CUT result— The detection results represent the logical detection values (1or0) for each tested cell. -
Detection index— the results are a vector or matrix containing the indexes of the cells being tested that exceed the detection threshold.
Output threshold detection — enabling the threshold detection output
disabled (by default) | enabled
Select this option to enable the output of detection thresholds via the Th output port.
Output estimated noise power — enabling the threshold detection output
disabled (by default) | enabled
Select this option to enable the output of the estimated noise power through the output port N.
Source of the number of detections — the source of the number of detections for the pass report:q[<br>] Auto (default) | Property
The source of the number of detections is set as Auto or Property.
-
Auto— the number of registered detection indexes is equal to the total number of tested cells in which indexes are detected. -
Property— the number of reported detections is determined by the value of the Maximum number of detections parameter.
Dependencies
To use this parameter, set the Output format parameter to `Detection index'.
Data types: Float16, Float32, Float64, Int8, Int16, Int32, Int64, UInt8, UInt16, UInt32, UInt64, Bool
Maximum number of detections — the maximum number of detection indexes at the output of
1 (default) | positive integer
The maximum number of detection indexes that must be obtained at the output is set as a positive integer.
Dependencies
To use this parameter, set the Output format parameter to Detection index and the Source of the number of detections parameter to Property.
Data types: Float16, Float32, Float64, Int8, Int16, Int32, Int64, UInt8, UInt16, UInt32, UInt64, Bool
Algorithms
The 2-D CFAR algorithm requires an estimate of the noise power. The noise power is calculated from cells that are not supposed to contain the target signal. These cells are training cells. The training cells form a strip around the test cell (CUT), but can be separated from the CUT by a protective strip. The detection threshold is calculated by multiplying the noise power by the threshold factor.
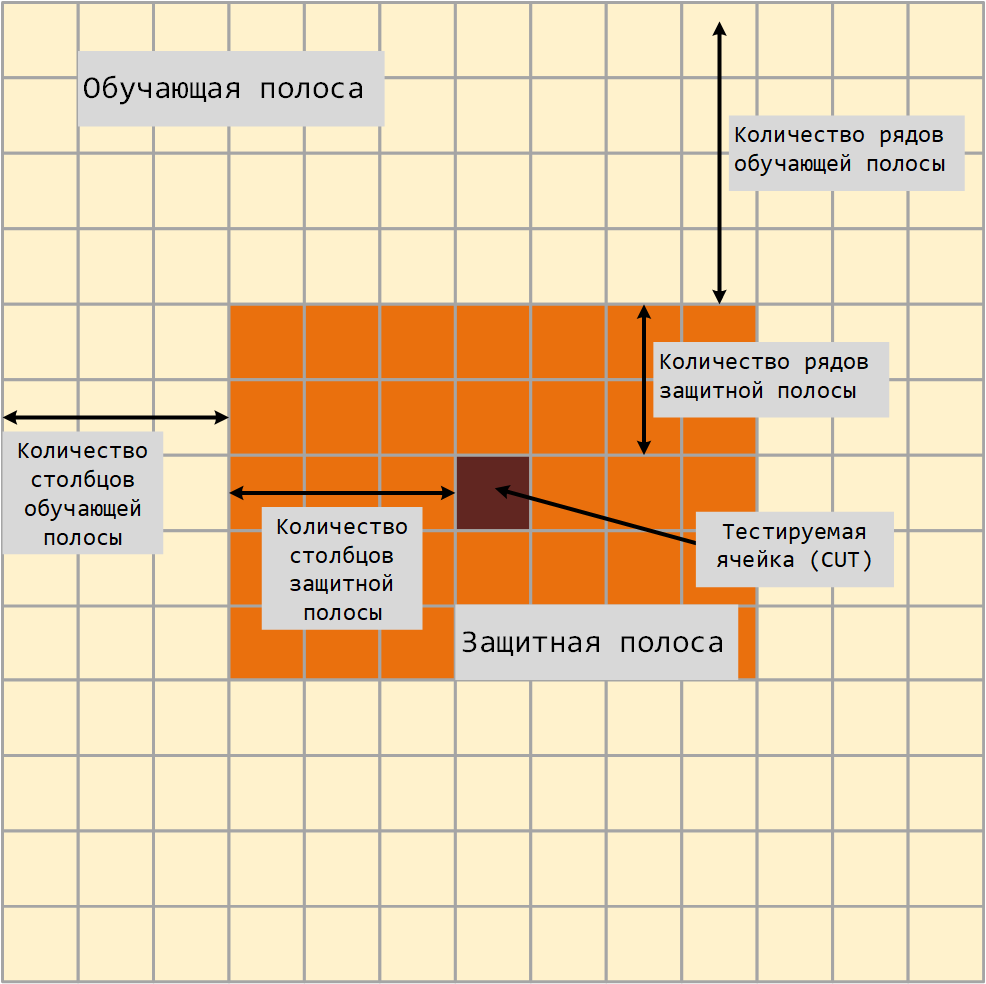
For GOCA and SOCA averaging, the noise power is defined as the average value of one of the left or right halves of the training cell area.
Since the number of columns in the training area is odd, the cells in the middle column equally belong to either the left or the right half.
When using the ordinal statistical method, the rank cannot be greater than the number of cells in the training cell area. . You can calculate .
-
— the number of columns of the training strip.
-
— the number of rows of the training strip.
-
— the number of columns of the protective strip.
-
— the number of rows of the protective strip.
The total number of cells in the combined training area, protection area, and CUT cell is:
.
The total number of cells in the combined protective area and the CUT cell is
.
The number of training cells is .
By design, the number of training cells is always even. Therefore, to implement the median filter, you can select the rank or .