RITM Plot XY
Display of the XY-graph on the KPM monitor «RITM».
blockType: CFunction
|
Path in the library: |
Description
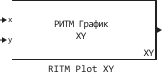
Block RITM Plot XY designed to display the XY-graph on the KPM monitor «RITM». The block accepts two input vectors of the same length: coordinate values and coordinate values .
One block corresponds to one graph and one line on this graph.
Assumptions and limitations
-
The block works in the XY-graph mode.
-
One block creates one chart and one line on the dashboard of the KPM monitor «RITM».
-
The Input x specifies the horizontal coordinates of the points.
-
The Input y specifies the vertical coordinates of the points.
-
The input vectors x and y must have the same dimension.
-
When changing a parameter Количество пар x/y на линию: the expected dimension of the input signals changes.
-
With the location value
−1The schedule is placed on the dashboard automatically.
Ports
Input
#
x
—
coordinate values
vector
Details
Vector of coordinate values .
The dimension of the input ports is set by the parameter Количество пар x/y на линию:. For example, if this parameter is set to 1024, then the input ports have the dimension (1024,); and if the value 2048 Then — (2048,).
The dimensions of the input vectors x and y must match.
| Data types |
|
| Complex numbers support |
No |
#
y
—
coordinate values
vector
Details
Vector of coordinate values .
The dimension of the input ports is set by the parameter Количество пар x/y на линию:. For example, if this parameter is set to 1024, then the input ports have the dimension (1024,); and if the value 2048 Then — (2048,).
The dimensions of the input vectors y and x must match.
| Data types |
|
| Complex numbers support |
No |
Parameters
Параметры двумерного графика:
# Расположение графика на дашборде (-1 для автоматического расположения): — index of the chart position on the dashboard
Details
The index of the chart position on the dashboard of the KPM monitor «RITM». Meaning −1 enables automatic location.
| Default value |
|
| Program usage name |
|
| Tunable |
No |
| Evaluatable |
Yes |
# Название графика: — chart title
Details
The chart title displayed on the KPM monitor «RITM».
| Default value |
|
| Program usage name |
|
| Tunable |
No |
| Evaluatable |
Yes |
# Количество пар x/y на линию: — number of points on the XY line
Details
The number of points on the XY line. Sets the dimension of the input vectors x and y.
| Default value |
|
| Program usage name |
|
| Tunable |
No |
| Evaluatable |
Yes |
# Подпись линии в легенде: — name of the line
Details
The name of the line displayed in the graph legend.
| Default value |
|
| Program usage name |
|
| Tunable |
No |
| Evaluatable |
Yes |
#
Толщина линии: —
graph line thickness
Тонкая | Средняя | Толстая
Details
| Values |
|
| Default value |
|
| Program usage name |
|
| Tunable |
No |
| Evaluatable |
Yes |
#
Цвет линии: —
graph line color
Красный | Оранжевый | Зелёный | Бирюзовый | Голубой | Синий | Фиолетовый | Пурпурный
Details
| Values |
|
| Default value |
|
| Program usage name |
|
| Tunable |
No |
| Evaluatable |
Yes |
# Подпись оси X: — horizontal axis signature
Details
The text signature of the horizontal axis.
| Default value |
|
| Program usage name |
|
| Tunable |
No |
| Evaluatable |
Yes |
# Подпись оси Y: — vertical axis signature
Details
The text signature of the vertical axis.
| Default value |
|
| Program usage name |
|
| Tunable |
No |
| Evaluatable |
Yes |