EngeePhased.CFARDetector2D
|
Page in progress. |
A detector with a constant false alarm level (PULT) for two-dimensional signals.
| Library |
|
| Block |
Description
System object EngeePhased.CFARDetector2D simulates a detector with maintaining a constant false alarm level (PULT) for two-dimensional signals.
The input signal sequence is divided into intervals (called cells). Detection is registered when the cell value in the input data exceeds the threshold value. To maintain a constant false alarm rate, the threshold value is set to a multiple of the noise power of the input data.
The detector evaluates the noise power from neighboring cells surrounding the tested cell (cell-under-test, CUT) using one of three cell averaging methods or the ordinal statistics method. Cell averaging methods: cell averaging (CA), largest cell value averaging (GOCA), or smallest cell value averaging (SOCA).
For more information about CFAR detectors, see [1].
For each tested cell, the detector:
-
Evaluates noise statistics based on cell values in the training band surrounding the test cell.
-
Calculates the threshold value by multiplying the noise estimate by the threshold factor.
-
Compares the value of the cell under test with a threshold value to determine the presence or absence of a target. If the value is greater than the threshold, then the goal is present.
To create and use a detector with a POOL, follow these steps:
-
Create an object EngeePhased.CFARDetector2D and set its properties.
-
Call the object with arguments as if it were a function.
To learn more about how to work with system objects, see Engee System Objects.
Syntax
Creation
-
detector = EngeePhased.CFARDetector2D()— creates a two-dimensional detector object with a POOL with default property values. -
detector = EngeePhased.CFARDetectora2D(Name=Value)— creates a two-dimensional detector object with a POOL with specified properties in the form of a pairName=Value, whereName— the name of the property, andValue— the appropriate value. You can specify multiple pairs «name-value» the order of the pairs does not matter. Unspecified properties retain their default values.detector=EngeePhased.CFARDetector2D(Method="OS", ThresholdFactor="Custom", Rank=2)
Using
-
Y = detector(X,cutidx)— performs two-dimensional detection with a POOL in the input data X for the tested cells cutidx. The output argument Y contains the detection results for the cells being tested. -
Y,th = detector(_)— also returns the detection threshold th applied to the detected test cells. To use this syntax, set the ThresholdOutputPort valuetrue. -
Y,noise = detector(_)— also returns an estimate of the noise power noise for each detected test cell in the argument X. To use this syntax, set the NoisePowerOutputPort valuetrue. -
_ = detector(X,cutidx,thfac)— also uses the threshold factor thfac to calculate the detection threshold. To use this syntax, set the ThresholdFactor value"Input port".
Arguments
Input arguments
X — input signal
+
the real matrix M by N | a real array of M by N by P
Details
The input signal, specified as a real matrix on or a real array on on
| Типы данных |
|
cutidx — indexes of tested cells
+
the matrix of positive integers 2 by D
Details
Indexes of the cells under test, set as a matrix of positive integers on , where — the number of cells being tested.
Each column cutidx contains the row and column indexes of the cell under test. The same index is applied to all pages in the input array. The location of the cells to be tested should be limited so that the areas to be tested lie completely within the input data.
| Типы данных |
|
thfac — detection threshold coefficient
+
positive scalar
Details
The threshold coefficient used to calculate the detection threshold, set as a positive scalar.
Dependencies
To use this input argument, set the property CustomThresholdFactor of the detector object to "Input port".
| Типы данных |
|
Output arguments
Y is the detector output
+
the logical matrix D on P | the logical matrix K by L
Details
The format of the detector output data depends on the property OutputFormat:
-
If for a property OutputFormat value set
"Cut result", the argument Y is a matrix on , containing the logical detection results. Meaning is the length of the cutidx argument, and is the value of the third dimension of the argument X. The Y lines correspond to the cutidx lines. For each line of the argument, Y contains the value1in the column, if there is a detection in the corresponding column of the argument X. Otherwise, the Y argument contains the values0. -
If for a property OutputFormat value set
"Detection index", the argument Y is a matrix on , containing detection indexes. Meaning is the number of detections found in the input data, and — the number of dimensions X. If the argument X is an array, then the argument Y contains the row, column, and page indexes of each detection in X as[detrow;detcol;detpage]. If the property NumDetectionsSource is set to"Property", is equal to the value of the NumDetections property. If the number of actual detections is less than this value, then the non-detections columns are set toNaN.
| Типы данных |
|
th — calculated detection threshold
+
the real matrix
Details
The calculated detection threshold for each detected cell, returned as a real matrix. The data on the th port has the same dimension as Y.
-
If for a property OutputFormat value set
"CUT result", the argument th returns the detection threshold when the argument Y is1, andNaNwhen the argument Y is0. -
If for a property OutputFormat value set
"Detection index", the th argument returns the detection threshold for each corresponding detection in Y. If the property NumDetectionsSource is set to"Property", is equal to the value of the NumDetections property. If the number of actual detections is less than this value, columns without detections are set toNaN.
Dependencies
To enable this output argument, set the ThresholdOutputPort value true.
| Типы данных |
|
noise — noise power assessment
+
the real matrix
Details
An estimate of the noise power for each detected cell, returned as a real matrix. The noise has the same dimensions as the Y argument.
-
If for a property OutputFormat value set
"CUT result", the noise argument returns the noise power when the Y argument is1, andNaNwhen the argument Y is equal to0. -
If for a property OutputFormat value set
"Detection index", the noise argument returns the noise power for each corresponding detection in Y. If the NumDetectionsSource property is set to"Property", is equal to the value of the NumDetections property. If the number of actual detections is less than this value, columns without detections are set toNaN.
Dependencies
To enable this output argument, set the NoisePowerOutputPort value true.
| Типы данных |
|
Features
#
Method —
The POOL averaging method
String
Details
A two-dimensional POOL averaging method defined by one of the following values: "CA" (by default), "GOCA", "SOCA" or "OS".
For values "CA", "GOCA", "SOCA" The noise power is the average value of the samples received from the training area.
For the value "OS" The noise power is is the cell value obtained as a result of numerical ordering of all the values of the training cells. Install using the Rank.
| The averaging method | Description |
|---|---|
|
Calculates the sample average of all the training cells surrounding the test cell. |
|
Divides the two-dimensional learning window surrounding the test cell into left and right halves. The algorithm then calculates the average of the samples for each half and selects the largest average. |
|
Divides the two-dimensional learning window surrounding the test cell into left and right halves. The algorithm then calculates the average of the samples for each half and selects the smallest average. |
|
Sorts the training cells in ascending order of numerical values. The algorithm then selects -th value from the list, where — this is the rank set by the property Rank. |
#
NoisePowerOutputPort —
enabling noise output power estimation
Logical
Details
Switching on the noise output power, set as false (by default) or true.
To get a noise estimate, set the NoisePowerOutputPort property to true and use the output argument noise when calling the object function.
#
ProbabilityFalseAlarm —
required probability of false alarm
Real number
Details
The required probability of a false alarm, given as a real positive scalar in the range of 0 before 1.
The algorithm calculates the threshold coefficient from the required false alarm probability.
Default value — 0.001.
Dependencies
To use this property, set the ThresholdFactor value "Auto".
#
OutputFormat —
format of the detection results
String
Details
The format of the returned detection results, set by one of the following values: "CUT result" (by default) or "Detection index".
If the OutputFormat property is set to "CUT result", the results are boolean detection values (1 or 0) for each tested cell.
If the OutputFormat property is set to "Detection index" The results are a vector or matrix containing the indexes of the checked cells that exceeded the detection threshold.
#
ThresholdFactor —
the method of determining the threshold coefficient
String
Details
The threshold coefficient method, set by one of the following values: "Auto" (by default), "Custom" or "Input port":
-
"Auto"— the object automatically calculates the threshold coefficient based on the desired probability of a false alarm specified in the property ProbabilityFalseAlarm. In the calculation, it is assumed that each independent input signal is a single pulse coming out of a detector with a quadratic law without pulse integration. The calculation also assumes that the noise is white Gaussian. -
"Custom"— the threshold coefficient is set in the CustomThresholdFactor property. -
"Input port"— the input argument thfac sets the threshold coefficient.
#
TrainingBandSize —
the size of the training area
Scalar / array of real numbers
Details
The number of rows and columns of cells in the training area on each side of the cell being tested, set as a positive integer or matrix on of positive integers. The first element sets the size of the training area by rows, the second by columns.
Specifying this property as a scalar is equivalent to specifying a training area with the same value for both dimensions.
Default value [1 1] indicates an area with a width of 1 the training cell surrounding the test cell.
#
GuardBandSize —
the size of the protective area
Scalar / array of real numbers
Details
The number of rows and columns of cells in the protective area on each side of the cell under test, set as a positive integer or matrix on of positive integers. The first element sets the size of the protective area by rows, the second by columns.
Default value [1 1] indicates an area with a width of 1 the training cell surrounding the test cell.
Meaning 0 indicates the absence of protective cells.
#
ThresholdOutputPort —
enabling the output of the threshold detection value
Logical
Details
Enabling the detection threshold output, set as false (by default) or true.
To enable the detection threshold output, set the ThresholdOutputPort property to true and use the output argument th.
#
NumDetections —
maximum number of detection indexes
Integer
Details
The maximum number of detection indexes, set as a positive integer.
Default value — 1.
Dependencies
To use this property, set the OutputFormat value "Detection index", and for the property NumDetectionsSource the value "Property".
#
Rank —
rank of ordinal statistics
Integer
Details
The rank of an ordinal statistic, given as a positive integer scalar.
The value of this property must lie between 1 and , where — the number of training cells. Default value 1 sets the lowest value in the learning area.
Dependencies
To use this property, set the Method value "OS".
#
NumDetectionsSource —
the source of the number of detections
String
Details
The source of the number of detections, set to one of the following values: "Auto" (by default) or "Property":
-
If the NumDetectionsSource property is set to
"Auto"The number of reported detection indexes is equal to the total number of cells tested that have detections. -
If the NumDetectionsSource property is set to
"Property", the number of reported detections is determined by the value of the NumDetections property.
Dependencies
To use this property, set the [Property:OutputForma]t value "Detection index".
#
CustomThresholdFactor —
user threshold coefficient
Real number
Details
A custom threshold coefficient set as a real positive scalar.
Default value — 1.
Dependencies
To use this property, set the Property to:ThresholdFactor value "Custom".
Examples
Setting a two-dimensional POOL threshold for noise-only data
Details
This example shows how to set a two-dimensional PULL threshold based on the required probability of false alarm (pfa).
Let’s perform detection using the POOL method of cell averaging on a matrix of cells with the size containing Gaussian noise. Let’s evaluate the empirical pfa and compare it with the required pfa. To get a good estimate, we will perform this simulation on 1000 similar matrices. First, we will set the threshold using the required pfa. In this case, there are no target cells, and the pfa can be estimated by the number of cells exceeding the threshold. Let’s assume that the data is being processed using a quadratic law detector and that pulse integration is not performed. We use a band of training cells with a width of 3 cells and height 4 cells. We use a wide protective strip 3 cells and height 2 cells to separate the test cells (CUT) from the training cells. Specify the required PFA 5.0e-4.
using EngeePhased
using Random

Random.seed!(1234)

p = 5e-4
rs = MersenneTwister(5)
N = 41
ntrials = 1000
detector = EngeePhased.CFARDetector2D(TrainingBandSize=[4,3],
    ThresholdFactor="Auto",GuardBandSize=[2,3],
    ProbabilityFalseAlarm=p,Method="SOCA",ThresholdOutputPort=true);
Let’s create an image with the size 41 on 41 containing random complex data. Then we will square this data to simulate a quadratic law detector.
x  = 2/sqrt(2) * (randn(rs, N, N, ntrials) + im * randn(rs, N, N, ntrials))
x2 = abs.(x).^2;
We will process all the cells in each image. To do this, we will find the row and column of each CUT cell, the learning area of which is completely inside each image. Let’s display the CUT cells.
Ngc = detector.GuardBandSize[2];
Ngr = detector.GuardBandSize[1];
Ntc = detector.TrainingBandSize[2];
Ntr = detector.TrainingBandSize[1];
cutidx = Matrix{Int}(undef, 2, 0)
colstart = Ntc + Ngc + 1;
colend = N - ( Ntc + Ngc);
rowstart = Ntr + Ngr + 1;
rowend = N - ( Ntr + Ngr);

for m in colstart:colend
    for n in rowstart:rowend
        cutidx = [cutidx [n; m]]
    end
end

ncutcells = size(cutidx,2);

using Plots

cutimage = zeros(N, N)

for k in 1:ncutcells
    cutimage[cutidx[1, k], cutidx[2, k]] = 1
end

heatmap(cutimage, aspect_ratio=:equal, yflip=true)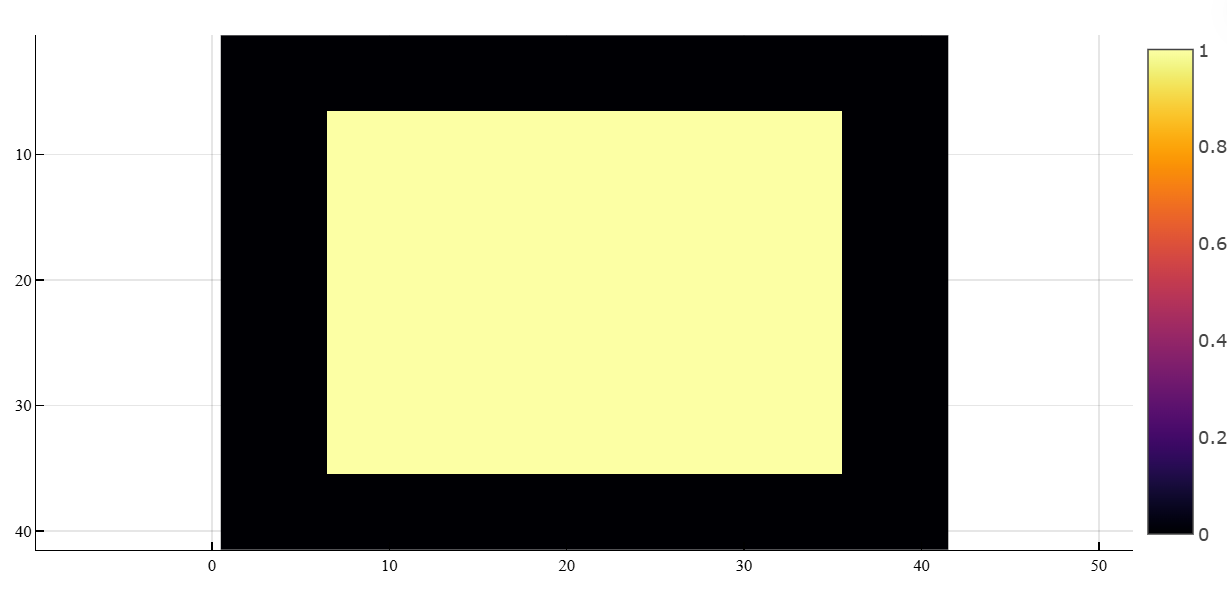
Let’s perform the detection of all CUT cells. Let’s return the detection classification and the threshold value used to classify the cell.
dets,th = detector(x2,cutidx);We will find and display the false positive image.
using Plots

di = Int[]
for k in 1:ntrials
    d = dets[:, k]
    if any(d)
        push!(di, k)
    end
end

idx = di[1]
detimg = zeros(N, N)
for k in 1:ncutcells
    detimg[cutidx[1, k], cutidx[2, k]] = dets[k, idx]
end

heatmap(detimg, aspect_ratio=:equal, yflip=true)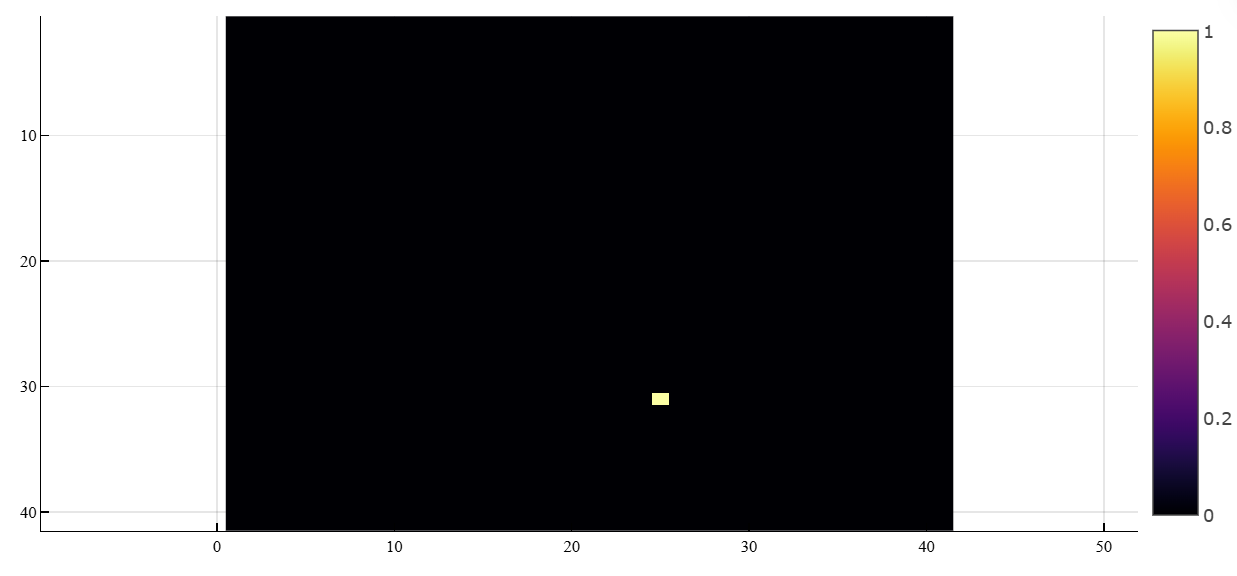
Let’s calculate the empirical pfa.
pfa = sum(dets) / ntrials / ncutcells0.0005005945303210463The empirical and set values of pfa are the same.
Let’s display the average empirical threshold value for all images.
import EngeeDSP.Functions: mean
mean(th, "all")31.71466631470533Let’s calculate the theoretical threshold coefficient for the required pfa value.
import EngeePhased.Functions: npwgnthresh

threshfactor = npwgnthresh(p,1,"noncoherent");
threshfactor = 10^(threshfactor/10)7.600902459542084The theoretical threshold factor multiplied by the noise variance must match the measured threshold.
noisevar = mean(x2, "all")
threshfactor*noisevar30.42597796742739The theoretical and empirical thresholds coincide with the acceptable difference.
Additional Info
Cells under test
Details
The algorithm for two-dimensional detection with PULT requires an estimate of the noise power. The noise power is calculated from cells that are assumed not to contain the target signal. These cells are training cells. The training cells form a strip around the test cell, but can be separated from the test cell by a protective strip. The detection threshold is calculated by multiplying the noise power by the threshold factor.

For GOCA and SOCA averaging, the noise power is defined as the average value of one of the left or right halves of the training cell area.
Since the number of columns in the training area is odd, the cells in the middle column equally belong to either the left or the right half.
When using the ordinal statistics method, the rank cannot be greater than the number of cells in the training cell area. . You can calculate .
The total number of cells in the combined training area, protection area and test cell is:
where
-
— the number of columns of the training strip;
-
— the number of lines of the training strip;
-
— the number of columns of the protective strip;
-
— the number of lines of the protective strip.
The total number of cells in the combined protective area and the cell under test is:
The number of training cells is:
By design, the number of training cells is always even. Therefore, to implement the median filter, you can select the rank or .
Data accuracy
Details
System object EngeePhased.CFARDetector2D supports single and double precision for inputs, properties, and arguments.
If the input data of the argument X has single precision, then the output data has single precision.
If the input data of the argument X has double precision, then the output data has double precision.
The accuracy of the output data does not depend on the accuracy of the properties and other arguments.