Transition graphs
Transition graphs (flow chart) are graphical constructs that represent the flow of operations or logic in the system. Graphs are constructed using nodes, transitions and transitions by default. Such graphs are used in modeling decision trees, iterative cycles, etc.
The logic of the transition graph:
-
The transition graph is executed at each step of the Chart block;
-
The execution of the transition graph usually starts by default and ends at the exit node, which does not have available transitions with true conditions. If all outgoing transitions from a node have false conditions, then backtrackingfootnote can be applied:[Backtracking (backtracking) is a problem—solving method based on an attempt to sequentially iterate through all possible solutions in order to find the right one. When the program reaches a decision node (for example, in the transition graph, it can be an exit node), and all possible options for further actions turn out to be incorrect (for example, all transitions from the node have false conditions), it returns (backtracks) to the previous decision node and tries another (alternative) option.] to find an alternative way;
-
Actions and conditions that determine the behavior of the model are set on transitions.
For more information about the logic of the transition graph, see here.
Transitions in the transition graph occur in accordance with the priority of transitions. Transition priority determines the order in which they are evaluated and executed if the conditions of several transitions are true at the same time. If multiple transitions are possible from a node, their priorities will be assigned automatically. In the future they can be changed manually.
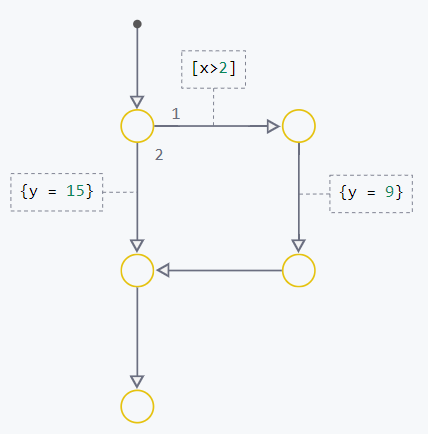
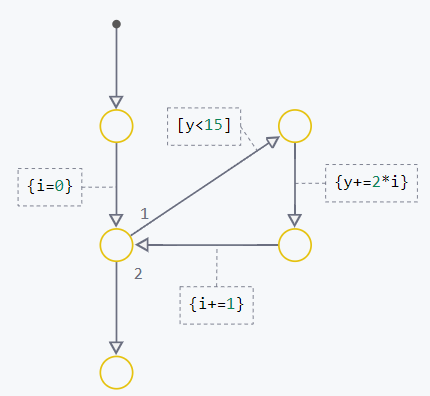
Examples of implementation of constructions if-else and while using transition graphs:
| If-Else | While |
|---|---|
|
|
|
|