State Machines
Introduction
A State machine (MS) is a representation of an event—driven system that switches from one mode of operation to another when the condition determining the change is true. MS can be used to design and develop dispatch control systems, task planning, fault management, communication protocols, user interfaces, and hybrid systems.
MS Engee is implemented graphically inside the block Chart. To get started, place the Chart block on the Engee workspace and double-click into it.
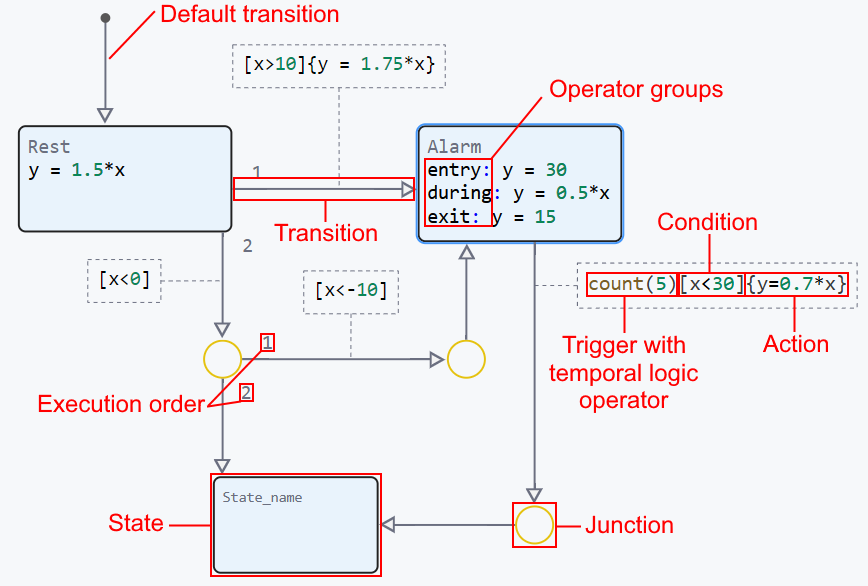
Inside the Chart block library Engee  It consists of four elements:


These elements form the basis of the MS, but additional elements are used for a more complete implementation of the models, for example:
For a better understanding of the MS operation, it is recommended to include animation of transitions in settings window ![]() :
:
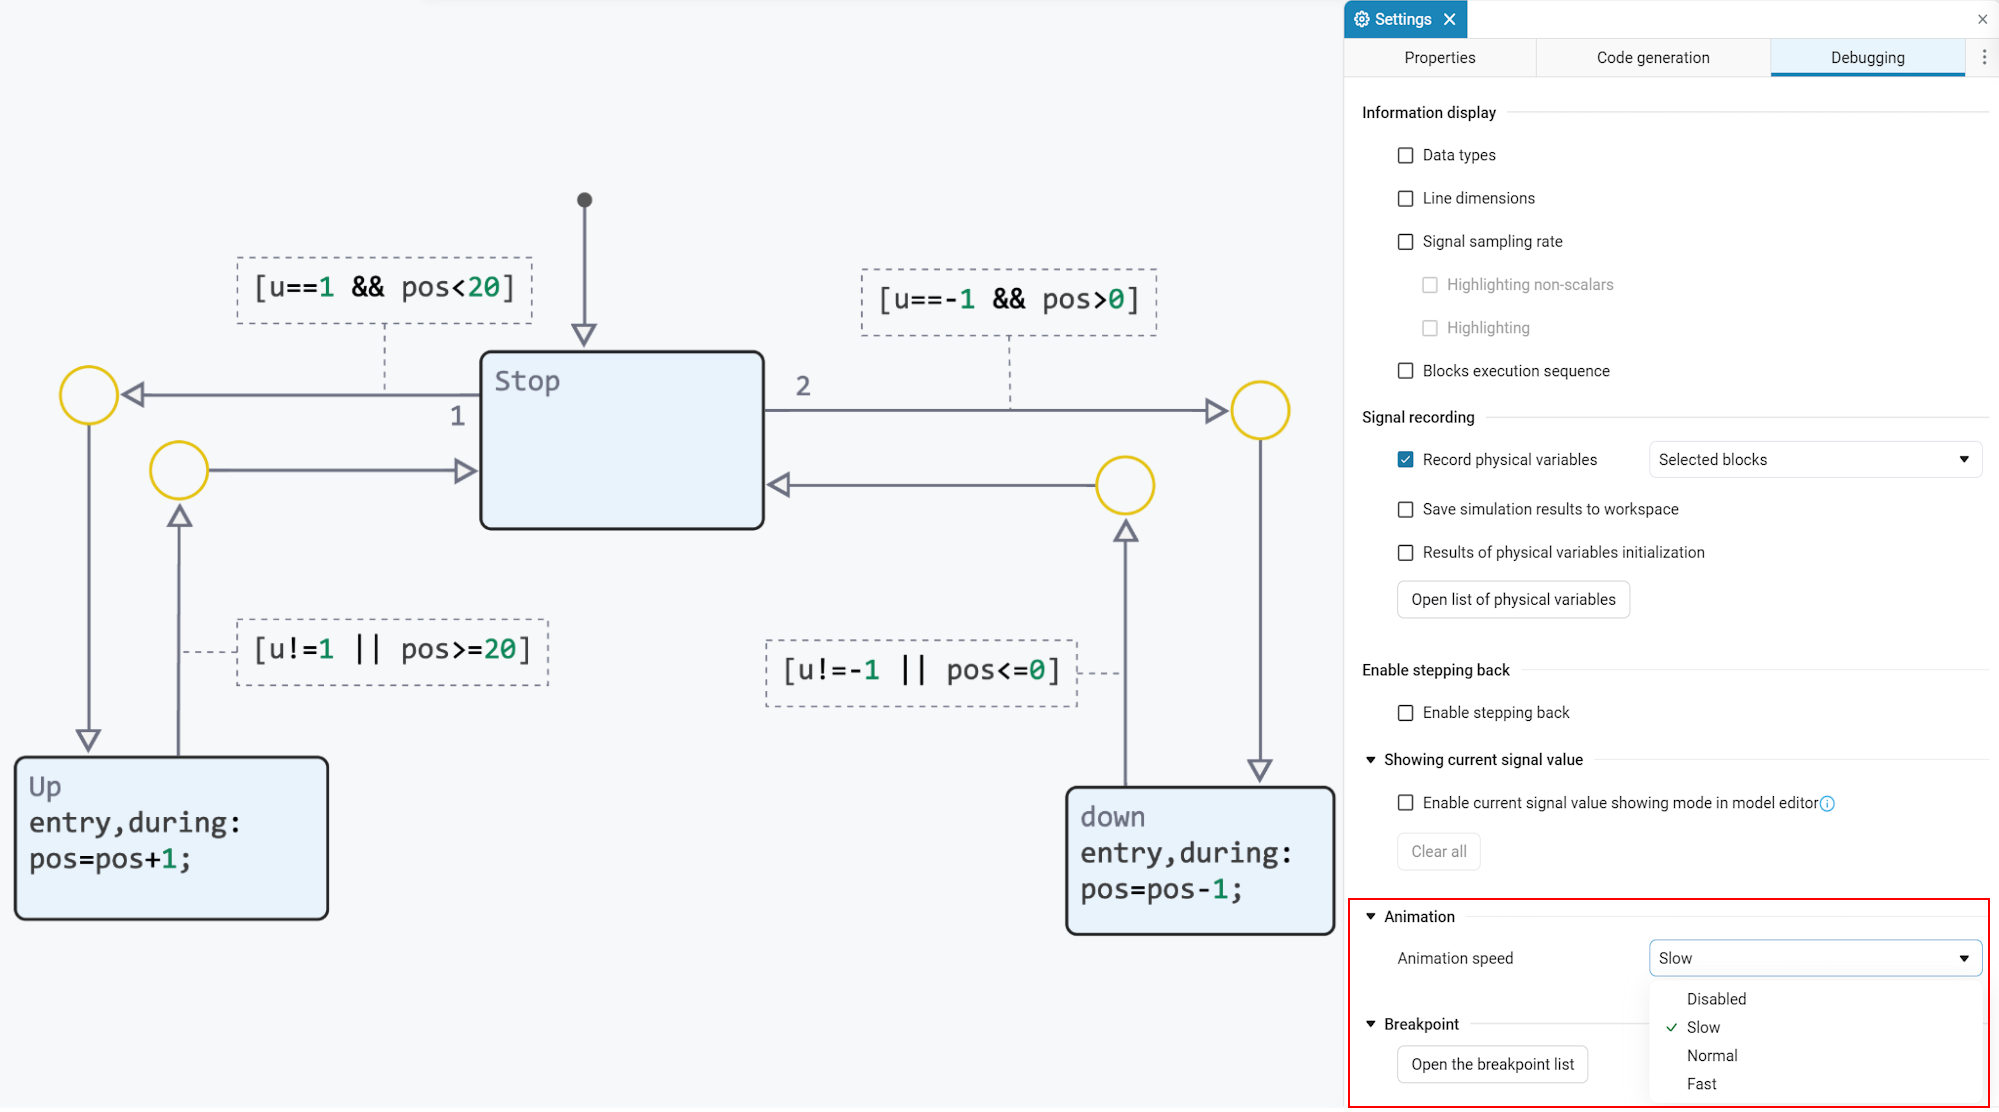
Animation is implemented by highlighting transitions. Transitions will be highlighted according to the order of execution.:
|
Parameter Simulation speed in the window Settings
|

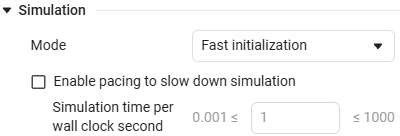
You can also disable states and transitions to temporarily exclude them from model execution. Use this to conduct testing., debugging and configuring alternative scenarios for the state machine without deleting elements:
Visualization of state machine results
The MS visualization process has no major differences from the visualization of classical Engee models*:
-
In the window signal visualization
 , when enabled recording signals select the output signal (in our case, Chart.a is the output variable
 afrom the Chart block):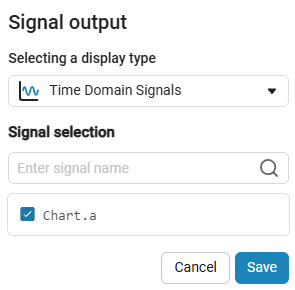
-
Run a simulation of the model
 . The simulation result will be shown on the coordinate plane of the visualization window.:
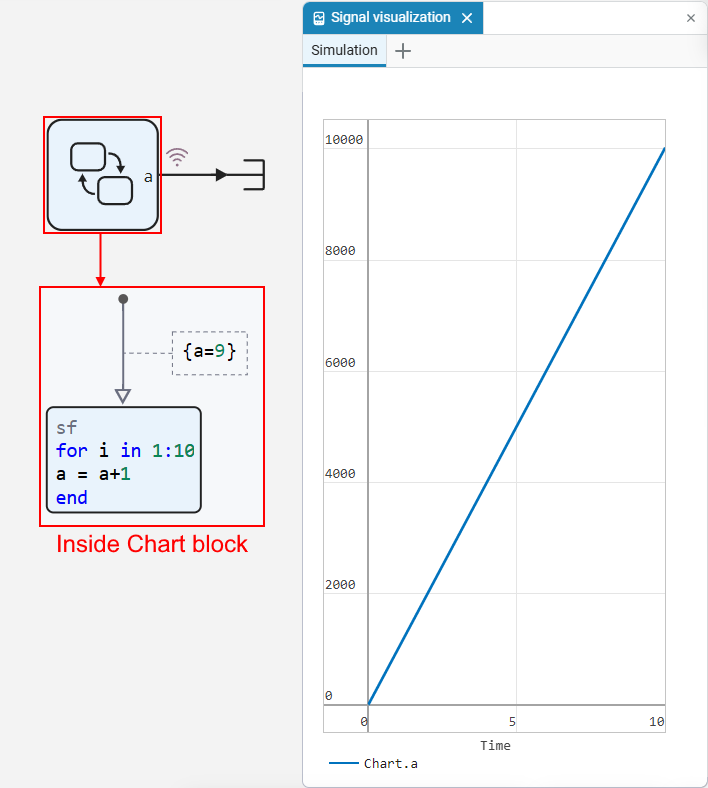
For more information about visualization in Engee, see the article Signal visualization.