Chart
Implementation of control logic using a finite automaton.
blockType: Chart
Path in the library: |
Description
Block Chart — this is a graphical representation of a finite automaton. A finite automaton is a mathematical model of a device that describes a system with a finite number of states.
To get started with the block Chart put it on the Engee workspace and double-click into it.
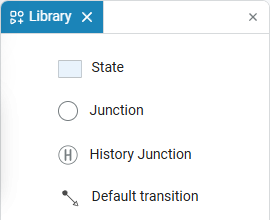
Inside Chart block library ![]() changes the view:
changes the view:

Read about states, nodes, transitions and memory nodes in the article State Machines.
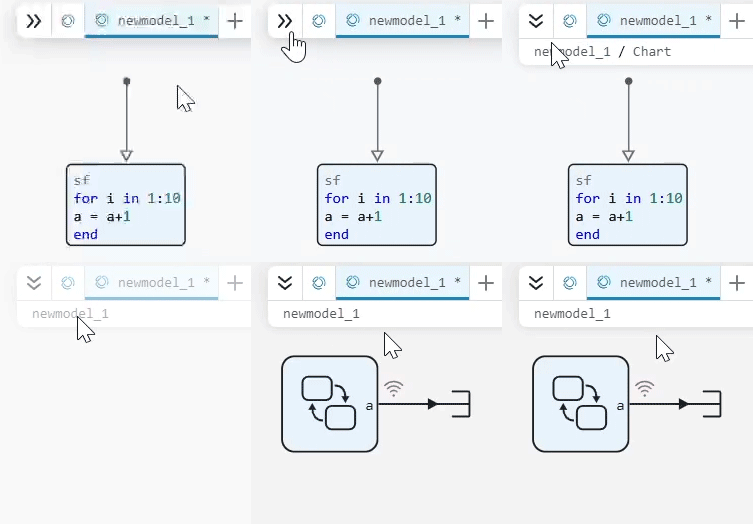
Block Interface Chart It is unified with the interface for working with subsystems, so to exit it back to the workspace Engee use the hierarchy navigation tab  on the model panel or press Esc:

Ports
Input
Port_in — input signal that creates the input port
scalar
The input signal is in the form of an internal block variable Chart, corresponding to the input port of the block. Appears after the creation of the input internal variable menu for adding signals in the settings window of the finite automaton model ![]() :
:

The input port cannot be assigned an initial value.
Data types: Float16, Float32, Float64, Int8, Int16, Int32, Int64, Int128, UInt8, UInt16, UInt32, UInt64, UInt128, Fixed
Output
Port_out — the output signal that creates the output port
scalar
The output signal is in the form of an internal block variable Chart, corresponding to the output port of the block. Appears after creating the output internal variable in the menu for adding signals in the settings window of the state machine model ![]() :
:

Data types: Float16, Float32, Float64, Int8, Int16, Int32, Int64, Int128, UInt8, UInt16, UInt32, UInt64, UInt128, Fixed
|
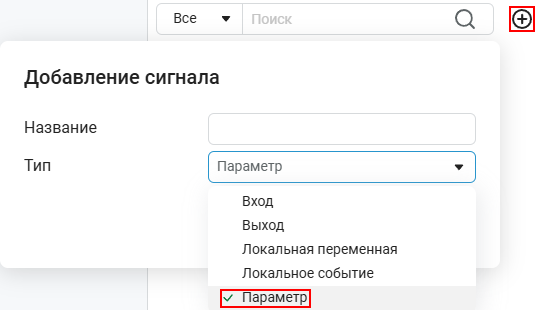
Block Chart is a separate part of Engee, so variables from workspace is not available in it. To make them visible, open settings window
The name of the parameter must match the name of the variable in the workspace. You can view active variables in variable window If the block Chart located inside the masked subsystem, then the mask parameters can also be passed inside it. Read more about the creation of such subsystems in the article Masks in Engee. |


