Electric Car Window Lift
In this example, we will tell you how to describe the logic of the operation of an electric glass lifter using the Chart block of the finite state machine library.
The logic of operation when raising and lowering the glass
Let's create a state transition diagram for modeling the electric window lifter system in a car according to the following requirements.
One input (u) is the direction in which the window should move.
- -1 – the glass is lowered
- 0 – the glass remains stationary
- 1 – the glass rises.
One output (pos) is the current position of the window.
- pos = 0 – The window is fully open
- pos = 20 – The window is completely closed
The chart of the Chart block should have the following characteristics:
- If it is indicated that the window is closing (u = 1), but it is not fully closed,
the pos should be increased by 1. - If the window is lowered (u = -1) and it is not fully open, the pos value should be reduced by 1.
- If the window is programmed to remain stationary (u = 0), the pos value
should not change. - The window position should start with full closure (pos = 20).
- The graph should be displayed every 0.1 seconds.
- The chart should contain three states – Up, Down and Stop.
The resulting model is located in a folder called power_window_simple.engee. You can open it and explore it in more detail. But it is also possible to run the model using code and get the results.
# Enabling the auxiliary model launch function.
function run_model( name_model, path_to_folder )

    Path = path_to_folder * "/" * name_model * ".engee"

    if name_model in [m.name for m in engee.get_all_models()] # Checking the condition for loading a model into the kernel
        model = engee.open( name_model ) # Open the model
        model_output = engee.run( model, verbose=true ); # Launch the model
    else
        model = engee.load( Path, force=true ) # Upload a model
        model_output = engee.run( model, verbose=true ); # Launch the model
        engee.close( name_model, force=true ); # Close the model
    end

    return model_output
end
run_model("power_window_simple",@__DIR__) # Launching the model.
# Reading of encoded signals from simout
Pos = simout["power_window_simple/pos"];
Pos = collect(Pos);
using Plots
plot(Pos.time, Pos.value)
Now you can complicate the model and take into account when lifting the glass the option when something gets between the glass and the window frame.
The logic of operation based on the sensor
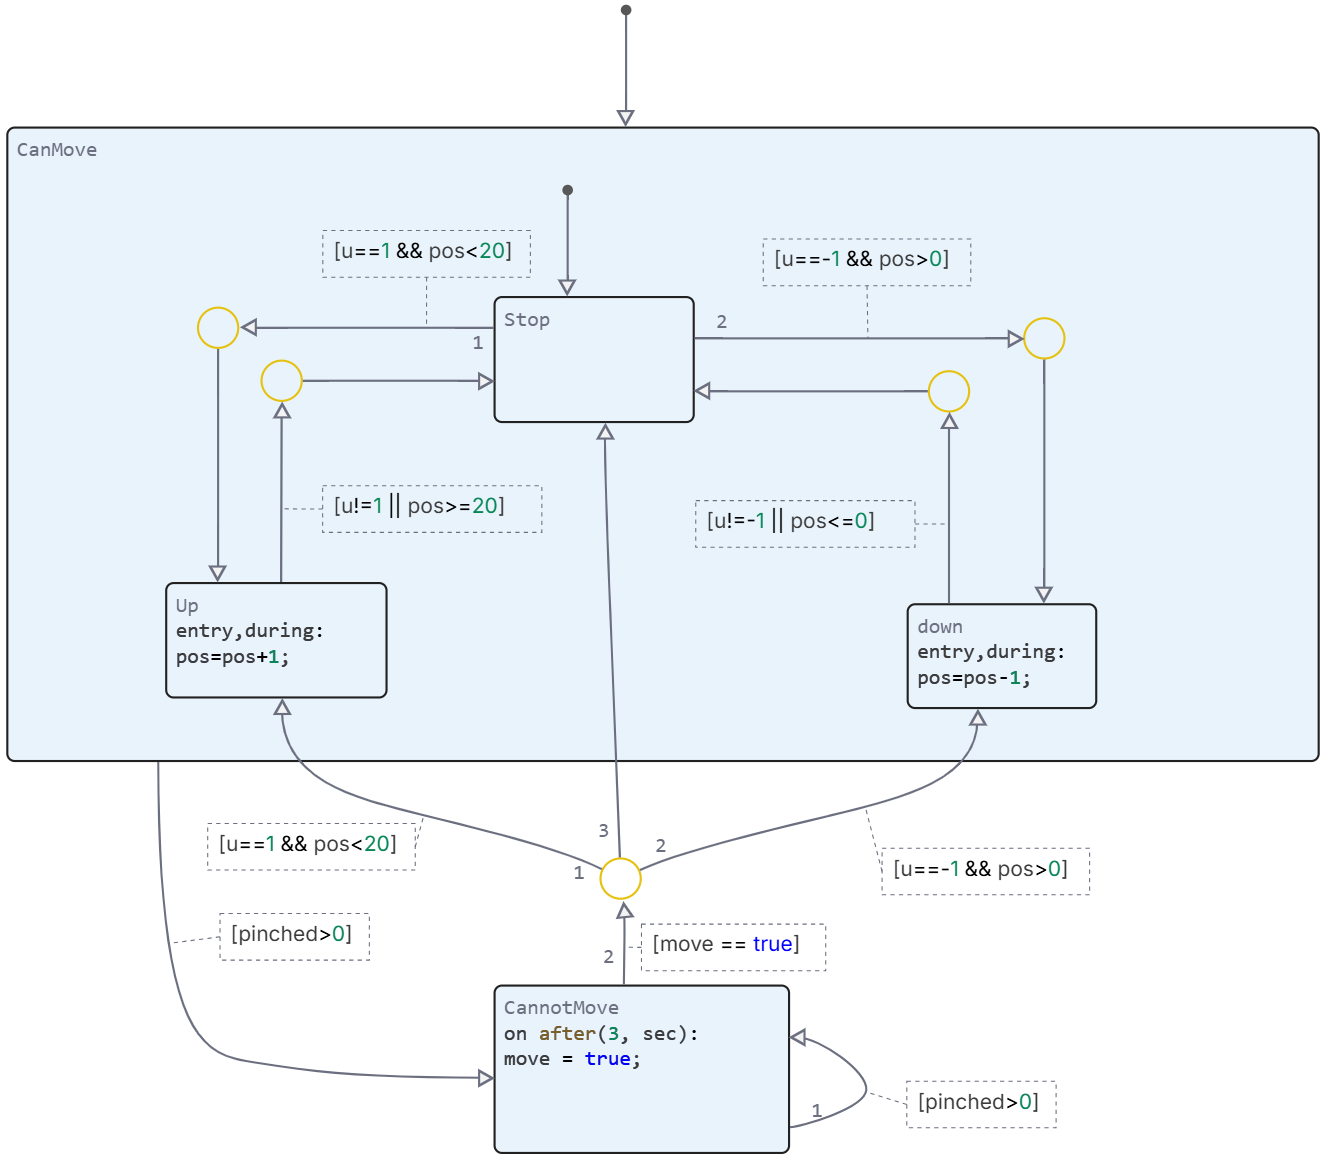
Let's change the model to take into account the "pinching" sensor. The following requirements apply to the logic of operation of a window lifter with a sensor:
- If the pinching sensor detects pinching (pinching signal is greater than 0),
the window should not move at all for 3 seconds.; - After that, if the signal from the sensor is 0, then normal operation resumes. Otherwise, the window does not move until the obstacle disappears.
Let's add the model from the previous paragraph. By adding the CannotMove state, which is responsible for the possibility of glass movement. That is, the transition to this state occurs when the pinched variable is greater than 0. The assembled model is shown below and the model file is located in the folder with the name power_window.engee.
run_model("power_window",@__DIR__) # Launching the model.
# Reading of encoded signals from simout
Pos = simout["power_window/pos"];
Pos = collect(Pos);
plot(Pos.time, Pos.value)
Conclusions
Thus, we took into account the case when an object is pinched when the window is raised. You can further complicate the model, taking into account the various difficulties when closing the window. You can also find other examples of using the Chart block in the section Finite automata.