Defining chart behavior using status actions and transition labels
State actions and transition actions are instructions that you write inside the state or during the transition, respectively, to determine the behavior of the diagram during modeling.
Let's consider a model with a finite automaton that empirically verifies one of the variants of [the Collatz hypothesis] (https://ru.wikipedia.org/wiki/The Collatz hypothesis). For a given numeric input the diagram calculates the Collatz sequence by repeating the rule:
- If even, then
- If If it's an odd number, then
The Collatz hypothesis states that for every natural number, there is a sequence of numbers that eventually reduces to one.
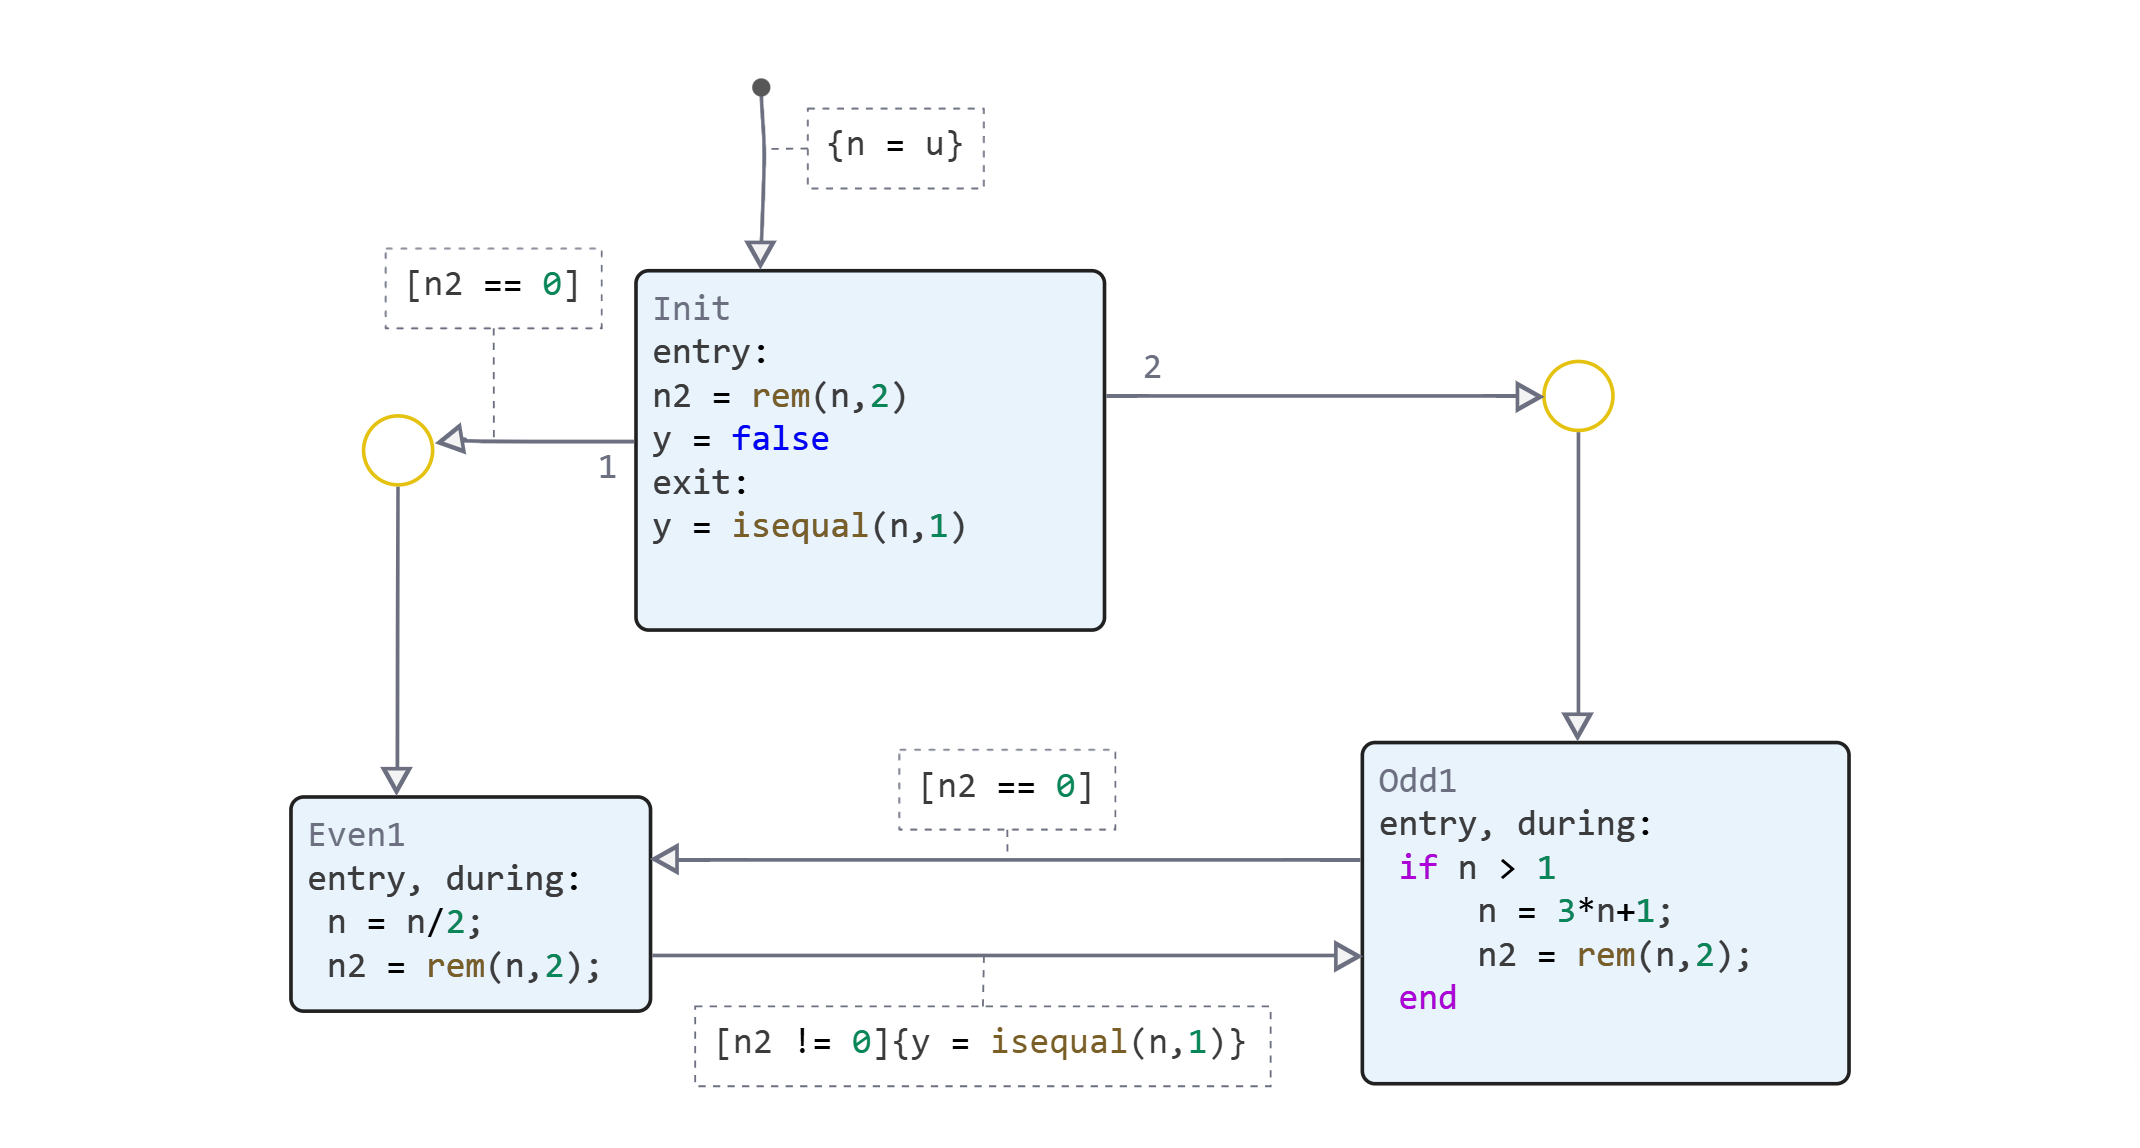
The diagram consists of three states. At the beginning of the simulation, the Init state initializes the chart data by setting:
- Local data n corresponds to the input value u.
- Local data n2 is converted to remainder when dividing n by 2.
- Output data y is set to false
Depending on the parity of the input data, the diagram switches to either Even or Odd state. As the state activity switches between Even and Odd states, the diagram calculates the numbers in sequence. When the sequence of hailstones reaches a value of 1, the output data y becomes true and the simulation stops.
Types of State actions
The state actions determine what the state diagram does while the state is active. The most common types of state actions are entry, during, and exit:
-
entry - Actions occur when the state becomes active.
-
during - actions occur at a time step when the state is already active, and the diagram does not move from this state.
-
exit - actions occur when the chart exits this state.
You can specify the type of state action using the full keyword (entry, during, exit) or the abbreviation (en, du, ex). You can also combine the types of state actions using commas. For example, an action with the combined type entry, during occurs at the time step when the state becomes active, and at each subsequent time step while the state remains active.
The hailstone diagram contains actions in states:
-
Init — when this state becomes active at the beginning of the simulation, the entry action determines the parity of n and sets y to false. When the chart exits the Init state after one time step, the exit action determines whether n is equal to one.
-
Even — when this state becomes active, and at each subsequent time step while the state is active, the combined entry, during action calculates the value and parity for the next number in the sequence of hailstones, n/2.
-
Odd — When this state becomes active, and at each subsequent time step while the state is active, the combined entry, during action checks whether the n value is greater than one, and if so, calculates the value and The parity for the next number in the sequence of hailstones is 3*n+1.
Types of transition labels
The transition labels define what the state diagram does when the active state changes. The most common types of transition labels are conditions and actions based on conditions: [Condition]{Action}.
-
A condition is a logical expression that determines whether a transition is taking place. If you do not specify a condition, the transition will occur one time step after the initial state becomes active.
-
A conditional action is an instruction that is executed when the condition providing the transition is true. The condition action is performed after the condition, but before any exit or entry state actions.
The hailstone diagram contains actions on transitions:
-
Default transition to Init — at the beginning of the simulation, the condition is applied assigns the input value u to the local data n.
-
Switching from Init to Even is a condition defines that the transition occurs when n is even. The number 1 in the source of this transition indicates that this transition is evaluated before the Init transition to Odd.
-
Switching from Odd to Even is a condition defines that the transition occurs when n is even.
-
Transition from Even to Odd is a condition defines that the transition occurs when n is odd. In this case, the condition applies determines whether n is equal to one.
Study the behavior of the diagram
Let's run a simulation for the sequence of hailstones starting at a value of 9. To do this, use command control to load and run the model. collatz.engee.
modelName = "collatz";
model = modelName in [m.name for m in engee.get_all_models()] ? engee.open( modelName ) : engee.load( "$(@__DIR__)/$(modelName).engee");
results = engee.run( modelName )
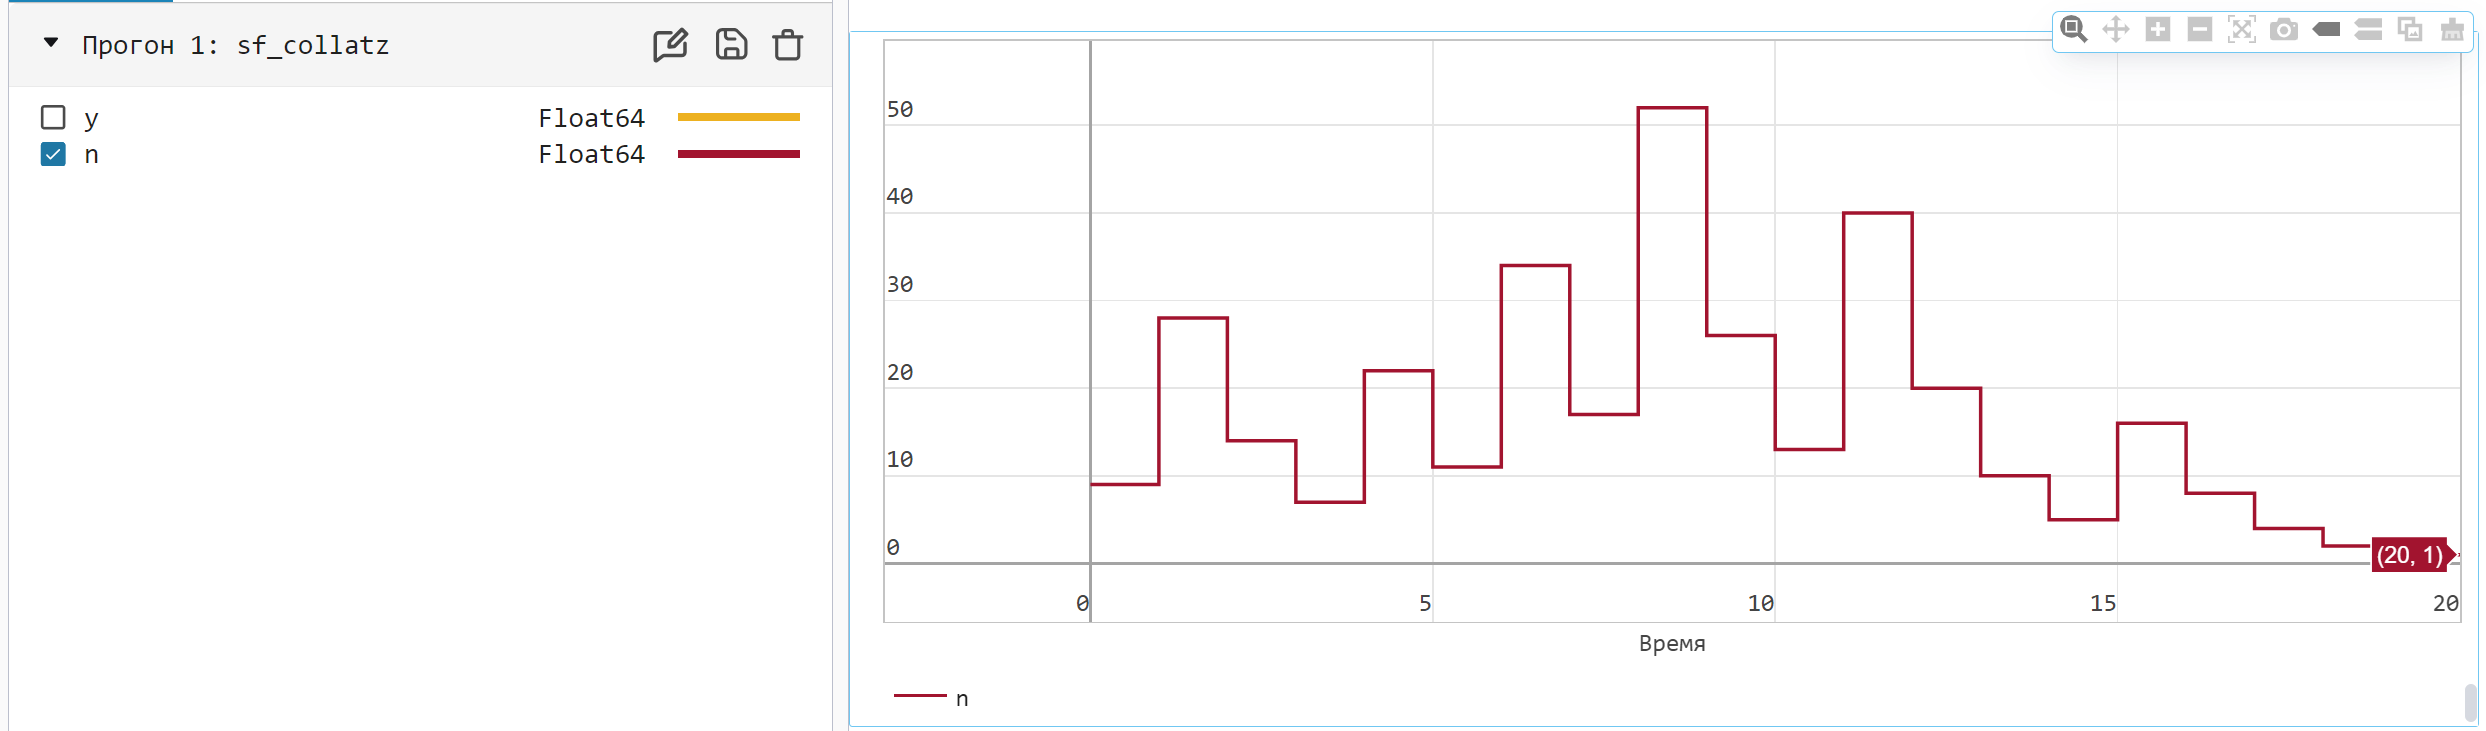
We will get the results and study the behavior of the diagram.
res_n = results["n"].value;
res_t = results["n"].time;
bar(res_t, res_n)
State diagram
-
At the moment of time the default state is Init. The transition action sets the value of n to 9. The Init state becomes active. The actions in entry set the Init value of n2 to 1 and y to false.
-
At the moment of time The condition n2 == 0 is not fulfilled, so the diagram is preparing to switch to Odd. The exit action in Init sets y to false. The Init state becomes inactive, and the Odd state becomes active. The entry action in Odd sets n to 28 and n2 to 0.
-
At the moment of time the condition n2 == 0 is true, so the diagram is preparing to move to Even. The Odd state becomes inactive, and the Even state becomes active. The entry action in Even sets n to 14 and n2 to 0.
-
At the moment of time The condition n2 ~= 0 is not satisfied, so the diagram does not switch to another state. The Even state remains active. The action during the Even set sets n to 7 and n2 to 1.
-
During The condition n2 ~= 0 is true, so the diagram is preparing to switch to Odd. The transition action sets y to false. The Even state becomes inactive, and the Odd state becomes active. The entry actions in Odd set n to 22 and n2 to 0.
-
The graph continues to calculate the sequence of hailstones until it reaches the value at a moment in time .
-
During operation The chart is preparing for the transition from Even to Odd. The transition action sets y to true. The Even state becomes inactive, and the Odd state becomes active. Entry actions in Odd do not change n or n2.
You can also run a simulation of the model from the simulation environment. To do this, open the model collatz.engee and run it. Next, you can view the simulation result in the Graphs window or in the Data Inspector application.
-
On the "Applications" tab in the upper-right corner, go to the "Data Inspector" section.
-
To see the values of the sequence of hailstones, select the recorded signal n in the data inspector.
Conclusion
The sequence of "hailstones" reaches a value of 1 after 19 iterations. You can also experiment with other numbers.