Building and running a state flow diagram
*A state diagram is a graphical representation of a finite state machine consisting of states, transitions, and data. You can create a diagram to determine how the system reacts to external inputs, events, and time conditions.
Let's review how to create the logic of a half-wave rectifier.
Building a state flow diagram
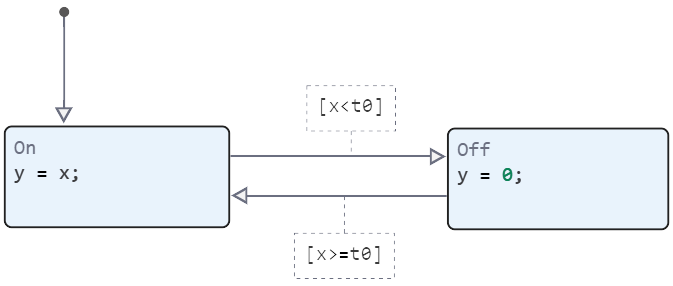
The diagram contains two states, labeled On and Off. In the On state, the output signal of the diagram y is equal to the input signal x. In the Off state, the output signal is zero. When the input signal crosses a certain threshold t0, the diagram transitions between these states. The actions in each state update the value of y at each time step of the simulation.
To create and model this diagram, follow these steps.
Open the editor
- Create a new model and add the Chart block to the modeling field.
engee.create("rectifier_start")
engee.add_block("/StateMachines/Chart", "rectifier_start/")
- To open the editor, double-click on the Chart block.
The main components of the Chart block editor are the chart canvas, the object panel, and the settings panel, where you can set signals.
- The diagramming canvas is the area where you create a diagram by combining states and transitions.
- A panel with objects that can be used to make a diagram is displayed on the left side of the canvas.
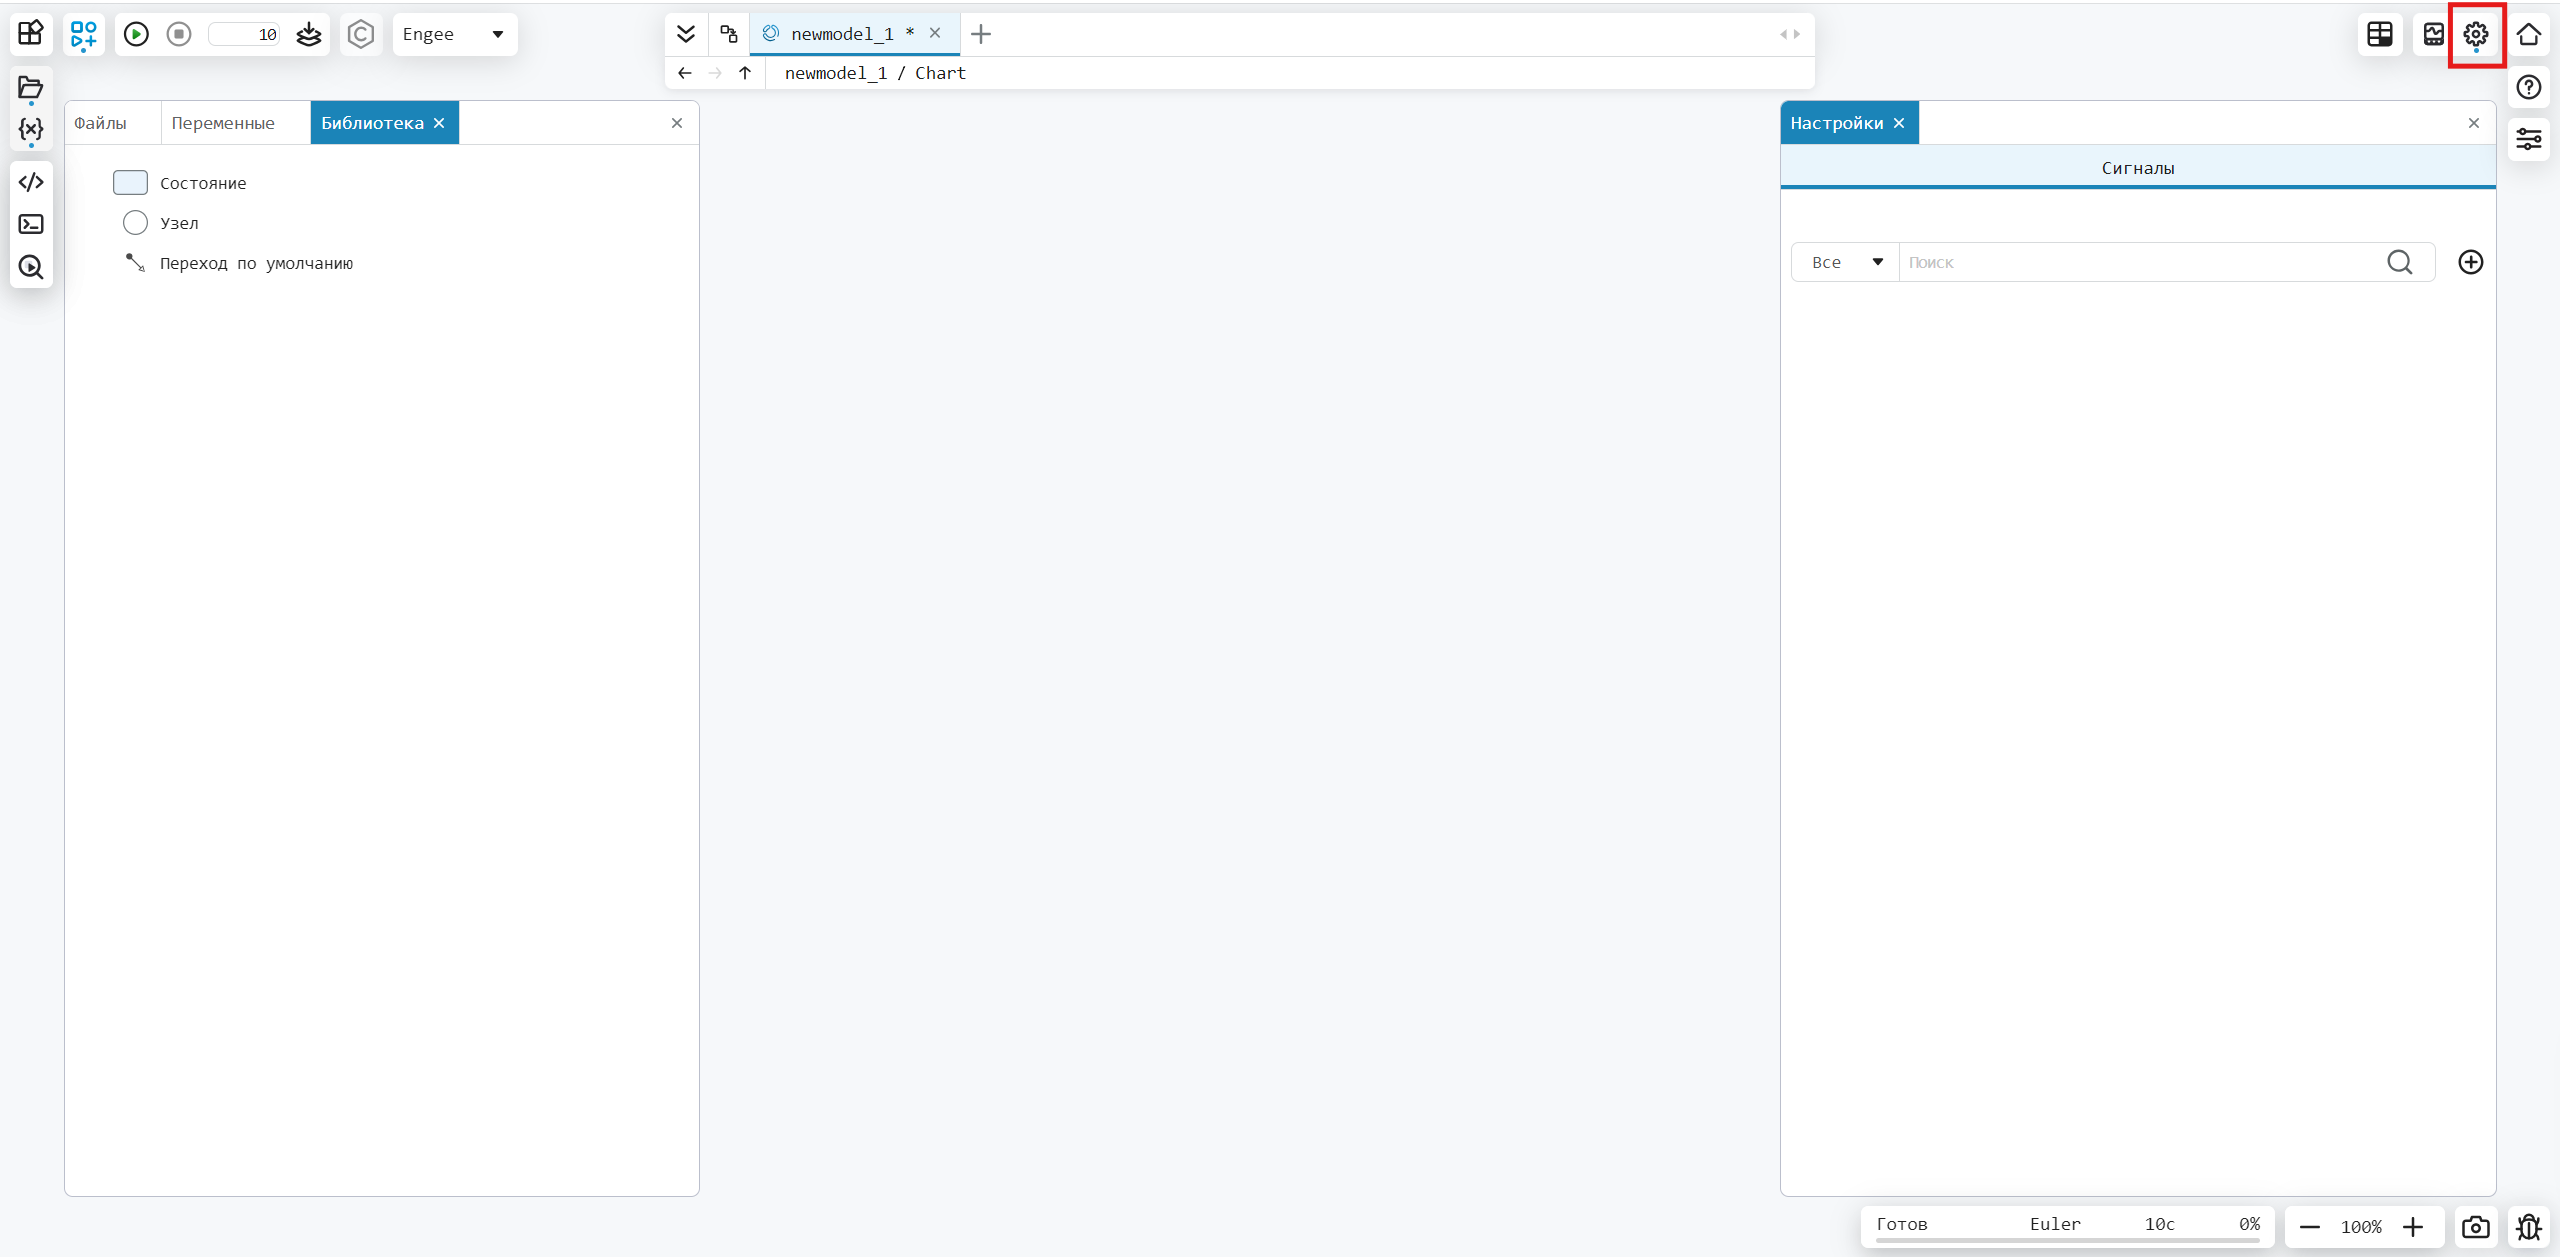
- The gear button in the upper right corner. If you click on it inside the editor, the "Signals" section opens. You can set input and output signals in it, as well as set a local variable.
Adding states and transitions
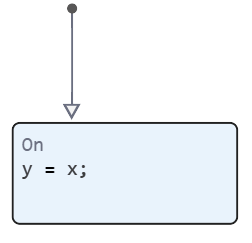
- In the objects panel, select the "Status" object and move it to the diagram canvas. The default transition state will appear. In the text field, enter the name of the state On and the action of the state in the highlighted curly brackets y=x.
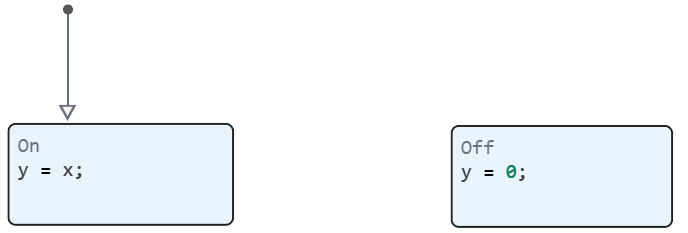
- Add another state. Right-click and drag the On state. Change the name of the new state to Off. Double-click on the state and change the state action to y = 0.
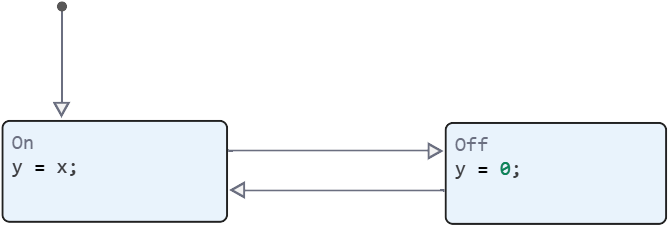
- Place two status objects side by side and connect them with a transition. To draw a transition, click and drag the cursor from the border of one state to the border of another state. When the transition is highlighted in blue, a menu appears next to it to add a condition ([]) of passage or an action ({}) that will occur during the transition. Add two transitions.
- To add conditions for transitions in our diagram, click on the transition and enter the condition in square brackets. Set the condition to switch from On to Off, and to switch back.
-
Additional functions for working with the status chart.
- For better clarity, move each transition label to a convenient location above or below the corresponding transition.
- To resize the chart to match the size of the canvas, press the space bar.
Set the signals
Before you can execute a diagram, you must identify each symbol that you use in the diagram and specify its scope (for example, input data, output data, or local data).
- Open the settings tab by clicking on the gear in the upper-right corner.
- Click on the + sign and add the name of the signals you are using, as well as the type. The Type column displays the intended scope for each undefined symbol, depending on its use in the diagram.
- Define the variables used as shown in the figure below.
Simulate the model
To simulate a model, connect the Chart block to other model blocks via the input and output ports.
- To return to the Engee modeling environment, click on the model name in the navigation bar.
-
Add the source to the model:
- From the Sources section, add the sine wave block - Sine Wave.
- Double-click on the Sine Wave block and set the sampling time to 0.2.
- Connect the output of the Sine Wave block to the input of the state diagram.
- Label the signal as x.
-
Add the receiver to the model:
- From the receivers section, add the Terminator block.
- Connect the output of the Chart block to the input of the Terminator block.
- Label the signal as y.
-
Record the signals
- Tap on the signal line. Next, hover over the three dots and click on
.png) .
. - Record the signals x and y.
- Tap on the signal line. Next, hover over the three dots and click on
- To start the simulation, click "**Execute **"
 . During the simulation, active states and transitions are highlighted.
Displaying results
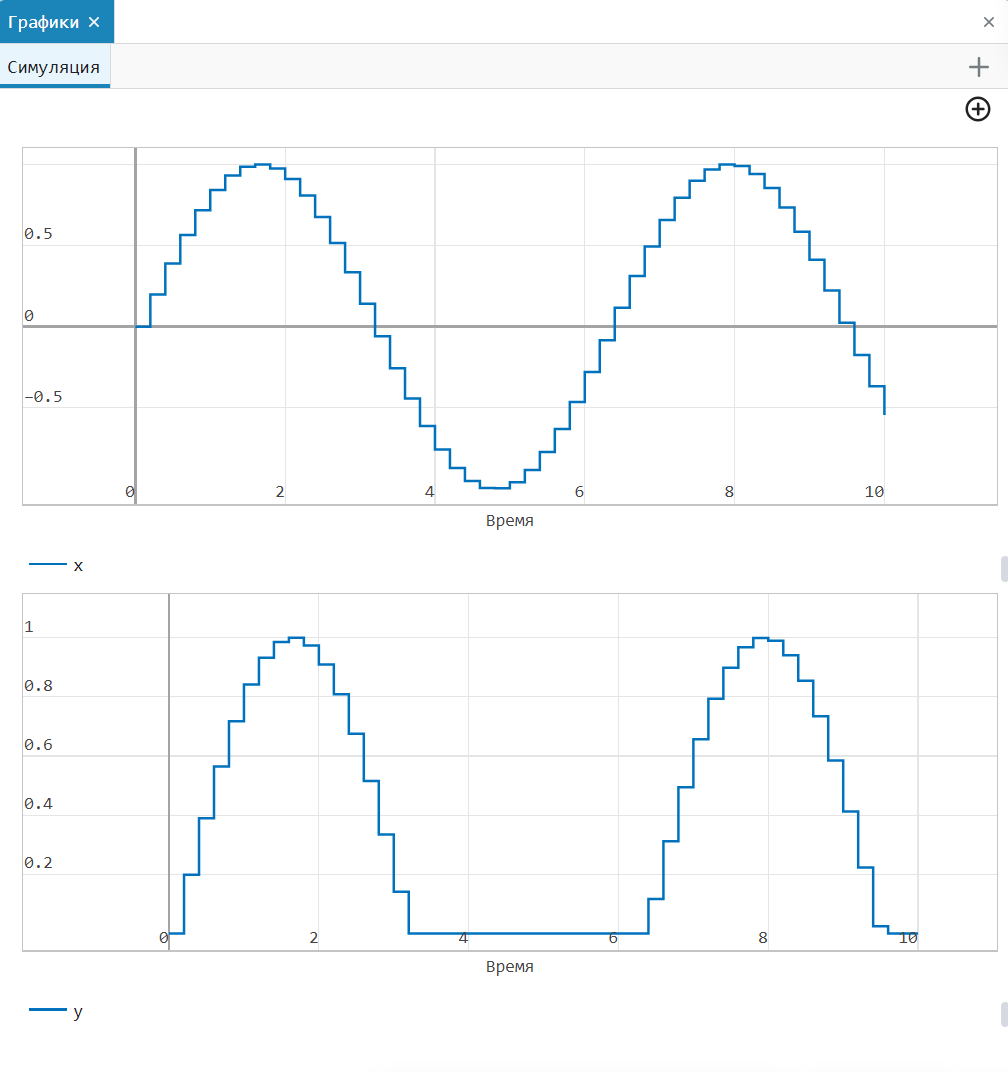
- After modeling, go to the Charts tab in the upper-right corner.
- Select the x and y signals from the signals menu.
.png)
- You can reflect the signals on one chart or on two different ones.
.png)
Conclusion
The simulation results show that the rectifier filters out negative input values.