Model of the air temperature control system
The purpose of this example is to demonstrate the capabilities of the Chart block in forming the logic of managing various objects. In particular, in this example, we will consider the option of controlling the air temperature in a room.
The principle of operation
The model (AirCond_Chart.engee) consists of several subsystems. The outside temperature is generated by a random signal and is implemented in the External Temperature block. Thermodynamics inside the room in the subsystem - Room Thermodynamics. It simulates the effect of external heat flow and calculates the current air temperature taking into account the coefficient of influence of the air conditioner - heatFlow, the value of which is determined in the Chart block. You can learn more about the implementation of the models by double-clicking on the subsystem of interest.
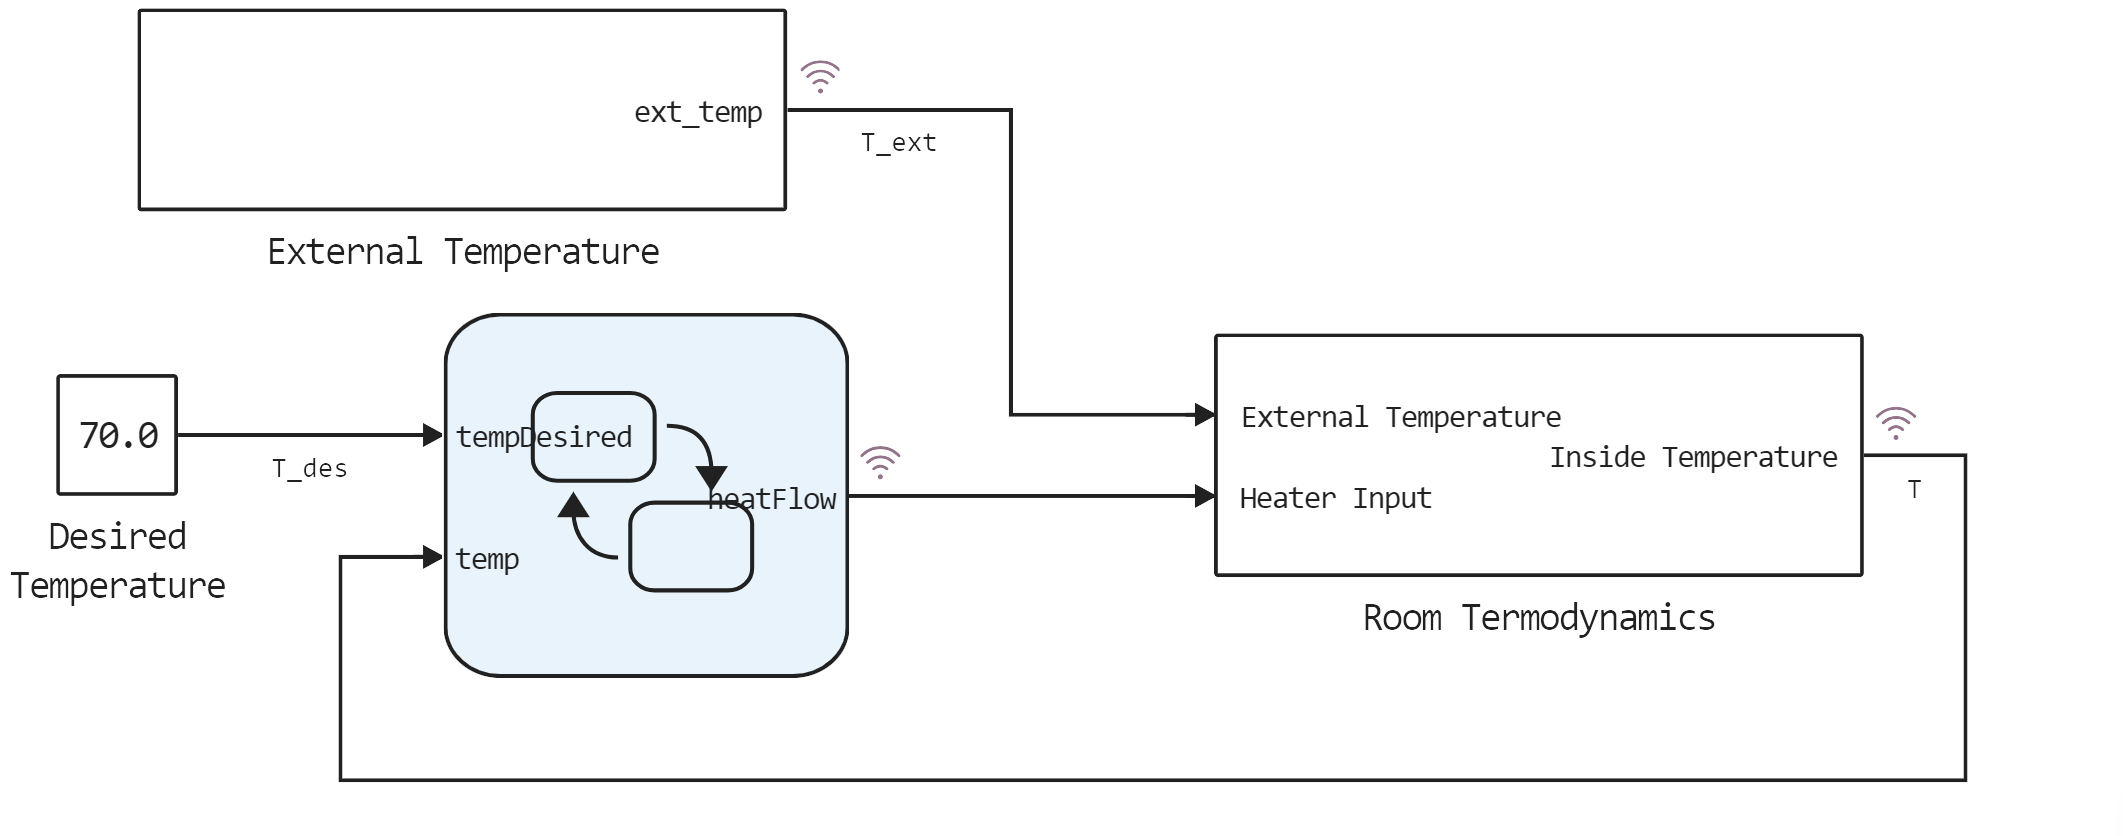
The Chart block implements the logic of controlling the air temperature in the room.
The algorithm of the flowchart is as follows. The Chart input receives signals:
- temp - the current air temperature in the room, F;
- tempDesired - desired air temperature, F;
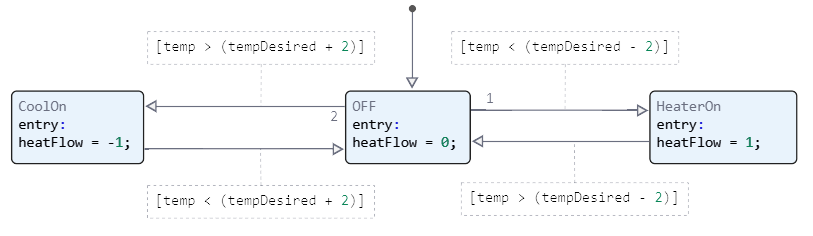
Next, two parameters are compared inside the block. If the current temperature is higher than desired, the heatFlow parameter will set to -1 and the temperature will start to decrease. If the current temperature is less than desired, the heatFlow parameter will be set to 1 and the temperature will rise. If the current temperature falls within the acceptable range, the heatFlow is set to 0.
Let's run the model and look at the result.
# Enabling the auxiliary model launch function.
function run_model( name_model, path_to_folder )

    Path = path_to_folder * "/" * name_model * ".engee"

    if name_model in [m.name for m in engee.get_all_models()] # Checking the condition for loading a model into the kernel
        model = engee.open( name_model ) # Open the model
        model_output = engee.run( model, verbose=true ); # Launch the model
    else
        model = engee.load( Path, force=true ) # Upload a model
        model_output = engee.run( model, verbose=true ); # Launch the model
        engee.close( name_model, force=true ); # Close the model
    end

    return model_output
end
run_model("AirCond_Chart",@__DIR__) # Launching the model.
# Reading of encoded signals from simout
T_ext = simout["AirCond_Chart/T_ext"];
T_ext = collect(T_ext);

heatFlow = simout["AirCond_Chart/Chart.heatFlow"];
heatFlow = collect(heatFlow);

T = simout["AirCond_Chart/T"];
T = collect(T);
using Plots
plot(T_ext.time, T_ext.value, label = "T_ext")
plot!(T.time, T.value, label = "T")
As you can see, with temperature jumps outside, the temperature inside the room also began to change, however, due to the control logic, it remained within the acceptable range of values. Let's plot the change in the heatFlow parameter to make sure that the Chart block is working.
plot(heatFlow.time, heatFlow.value, label = "heatFlow")
Conclusion
In this example, we have considered a way to implement control logic using the Chart block of the finite state machine library. The implementation option was simplified, but the simulation results show that the model does a good job of maintaining temperature.