Code generation for Arduino (PWM on finite state machines)
In this example, we will develop the simplest model in Engee for pulse width modulation at the output of Arduino-compatible boards using the library Finite automata for constructing an algorithm and a block C Function to interact with the target device's peripherals.
Introduction
The purpose of this example is to show the process of developing a PWM contact control algorithm for Arduino-compatible platforms using the finite automata library. In this example, as opposed to the demo example arduino_blink_chart all possible states of the algorithm are reduced to a single one, and the change in output variables occurs in conditional transitions. This makes it possible, albeit slightly, to reduce the volume of the compiled file uploaded to the target device. In addition, the example shows how to use the block C Function access the peripherals of the controller and the functions of the Arduino development environment.
The hardware in this example uses the same as in the example arduino_blink_chart.
Description of the model
In the PWM contact control model of the Arduino board, the block Сhart directly reproduces the control algorithm, its output contacts cnt and out They are used to output and save the corresponding variables. Block C Function It is used to interact with the controller's peripherals through functions used in the Arduino IDE. Block Outport ("Cnt") in the model is necessary for successful code generation.

To the "in" block input C Function The value of the PWM pulse duration is received, where it is then transmitted to the PWM pin (~13) of the Arduino board.
State diagram
Block Status diagram Chart as mentioned earlier, in this example it is represented by a single state - Counter. As you can see from the diagram below, this state does not reproduce any actions other than checking the transition conditions. At each step of the model calculation, the transition condition is checked in the specified order until one of them is fulfilled. When the condition is fulfilled, the condition body is executed and the transition to the initial state occurs, after which the cycle repeats.
In the body of the condition, one of the 6 possible values of the variable is assigned. out the duration of the PWM pulse and the counter variable is incremented cnt. The condition for performing one of the transitions is to find the counter variable in one of the specified ranges. When the variable is reached cnt the maximum value is "1000", the counter is reset (cnt = 0;), the PWM pulse duration is set to "0".
Thus, we get the output Out the block Chart stepwise change of the PWM pulse duration.
.png)
The initial values of the output variables are "0", as can be seen from the signal settings menu in the status diagram.
Block C Function
Block C Function It is used in the considered model exclusively for code generation. Therefore, for the successful compilation and verification of the Engee model, the user code is divided into sections C Function enclosed in conditional compilation directives #ifdef ... #endif. What is written in the code C Function the compilation condition is met only when the header file is attached. Arduino.h, which happens automatically when compiled from the Arduino IDE, and does not happen when compiled in the Engee simulation environment.
Section StartCode The block is used to initialize the controller's peripherals and will be called in the Arduino IDE once in the function setup().
.png)
Section OutputCode The block is used to change the duration of the PWM pulse and output this value to the serial port. It will be called every 1 millisecond in the function loop().
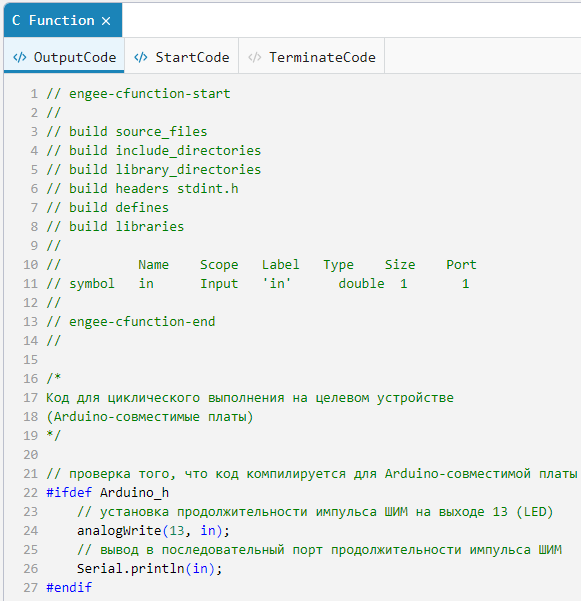
A detailed description of each procedure is given in the comments section. C Function.
Simulation results
Let's load the described model:
if "pwm_chart" in [m.name for m in engee.get_all_models()]
    m = engee.open( "pwm_chart" );
else
    m = engee.load( "$(@__DIR__)/pwm_chart.engee" );
end

data = engee.run(m);
From the obtained model data, we will plot the change in the value of the counter and the duration of the PWM pulse.:
using Plots
plotlyjs();
plot(data["Chart.cnt"].time, data["Chart.cnt"].value,
    label="Cnt", size=(900,300), lw=2)
plot!(data["Chart.out"].time, data["Chart.out"].value,
    label="Out", size=(900,300), lw=2)
xlims!(0.0,3.0)
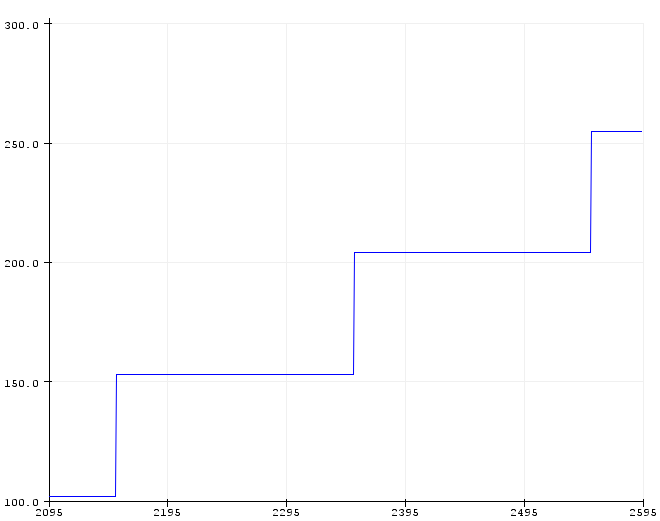
As can be seen from the simulation results, the received counter signal Cnt increases in increments of "1" every 1 millisecond from "0" to "1000" for 1 second. PWM pulse duration signal Out depending on the value, the counter value increases stepwise with the values: "51", "102", "153", "204", "255".
Now, after making sure that the algorithm and model are working correctly, you can proceed to code generation and playback of the model on the target device.
Uploading code to Arduino
To transfer the developed model to the target device, we will generate a C code.:
engee.generate_code( "$(@__DIR__)/pwm_chart.engee",
                     "$(@__DIR__)/pwm_chart_code" )
In the specified directory pwm_chart_code the plug-in files were generated. Also in the directory of the demo example arduino_pwm_chart a pre-written Arduino sketch with the name of this directory has been posted. arduino_pwm_chart.ino. It connects the header file obtained during code generation, initializes and calls the model calculation time variables, and also calls the model calculation functions. At the same time, the model calculation functions are now used not only to calculate the control algorithm, but also to control the controller's peripherals. A detailed description of the sketch is given in the comments of its code.
To execute the code on Arduino, you need to download the directory arduino_pwm_chart and upload the sketch arduino_pwm_chart.ino from the Arduino IDE to the target device. In our case, as mentioned earlier, this is Iskra Neo from Amperka.
After successful compilation and download of the executable code to the target device, the Arduino IDE diagnostic window displays a message about the success of the operation and the size of the output file.:
.png)
Code execution on Arduino
As in the block C Function we used the value of the PWM period duration not only to control the PWM channel, but also to output the calculated value to the serial port of the computer, go to the Arduino IDE tools and run the plotter over the serial connection. A variable change will be displayed on the connection plotter. out at every step of the calculation.
.png)
As can be seen from the graph shown on the plotter, the period of change in the PWM pulse duration is 200 milliseconds, and the duration values have the previously specified values. In addition, a gradual increase in the brightness of the built-in LED can be observed on the Arduino board, with a period of 1 second, since both the LED and pin 13 of the board are connected to the same channel of the controller.
Removing signals from the Arduino board
At the end of testing the model on the target device, we will perform an oscilloscope of the required signal from pin 13 of the Arduino board.
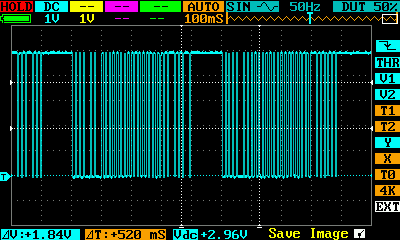
The presented waveform shows a gradual increase in the duration of the PWM pulse with a period of change in duration of ~ 200 milliseconds and a total duration of the cycle of increase in duration of 1 second.
Conclusion
In the considered demo example, a model of a PWM control algorithm for Arduino-compatible platforms based on a library of finite automata was developed. Special attention is also paid to the consideration of working with the peripherals of the target device through the block C Function. As it was established from the data obtained from the microcontroller and the waveforms taken from the debugging board, the C code generated from the Engee model accurately reproduces the embedded algorithm and corresponds to the simulation results.