Three-phase sinusoidal signal generator
In this demo, we will look at ways to embed code generated from the subsystem of the Engee model.
Introduction
The purpose of this example is to develop a model of a three-phase sine wave generator. The input signals of the generator are the amplitude [V] and frequency [Hz] of the output signals: instantaneous phase voltages. The phase difference of the sinusoidal signals is .
In the course of the example, we will conduct algorithm modeling, code generation, embedding and verification in the Engee model, embedding and testing on the target device, an Arduino-compatible platform.
Description of the model
The developed model sine_generator.engee It is an algorithm for a three-phase sinusoidal signal generator contained inside a subsystem. SinGen. The amplitude values are applied to the subsystem inputs Amp = 1.0 and the frequencies Freq = 25.0. Output sinusoidal signals Sin_A, Sin_B and Sin_C they are logged.
The calculation step of the model is 0.001 sec.
Subsystem contents SinGen shown in the picture below.
.png)
This subsystem reproduces standard calculations using the following equations:
Simulation results
Download and execute the described model:
if "sine_generator" in [m.name for m in engee.get_all_models()]
    m = engee.open( "sine_generator" );
else
    m = engee.load( "$(@__DIR__)/sine_generator.engee" );
end

data = engee.run(m);
From the obtained model data, we will plot the output variables - the instantaneous phase voltages. SinGen.Sin_A, SinGen.Sin_B, SinGen.Sin_C.
using Plots
plotlyjs()
plot(data["SinGen.Sin_A"].time, data["SinGen.Sin_A"].value,
    label="V_a", size=(900,300), lw=2, st=:step)
plot!(data["SinGen.Sin_B"].time, data["SinGen.Sin_B"].value,
    label="V_b", size=(900,300), lw=2, st=:step)
plot!(data["SinGen.Sin_C"].time, data["SinGen.Sin_C"].value,
    label="V_c", size=(900,300), lw=2, st=:step,
    legend=:topleft)
xlabel!("Time, seconds")
ylabel!("Voltage, V")
The output signal graphs obtained as a result of the simulation are three-phase sinosoidal voltages V_a, V_b, V_c with a frequency of 25 Hz, an amplitude of 1 V and a phase shift .
Code generation
To embed the developed algorithm, it is necessary to generate code from the subsystem SinGen:
engee.generate_code( "$(@__DIR__)/sine_generator.engee",
                     "$(@__DIR__)/sine_generator_SinGen_code";
                     subsystem_name="SinGen" )
As a result of executing the code generation command, files were created in the specified directory main.c, sine_generator_SinGen.h and sine_generator_SinGen.c.
.png)
Now let's look at and test the ways to embed the code generated from the model.
Embedding the code in the Engee model
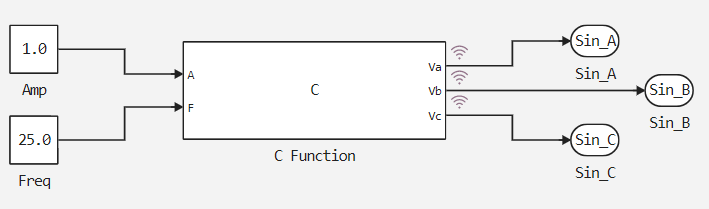
To test the operation of the generated code, we will embed it in the Engee model. sine_generator_test.engee. The input and output parameters of the algorithm are identical to the parameters in the original model sine_generator.engee. However, the algorithm itself is implemented here on the basis of generated C files embedded in the block. C Function.
.png)
Embedding the code is as follows. In the block C Function The locations of the generated files are specified, input and output variables are initialized, and calculation functions generated from the model are called.
Contents of the tab </> OutputCode the block C Function:
// engee-cfunction-start
//
// build source_files /user/start/examples/codegen/sine_generator/sine_generator_SinGen_code/sine_generator_SinGen.c
// build include_directories /user/start/examples/codegen/sine_generator/sine_generator_SinGen_code
// build library_directories
// build headers sine_generator_SinGen.h
// build defines
// build libraries
//
//          Name    Scope   Label   Type    Size    Port
// symbol   A      Input   'A'      double  1       1
// symbol   F      Input   'F'      double  1       2
// symbol   Va     Output   'Va'      double  1       1
// symbol   Vb     Output   'Vb'      double  1       2
// symbol   Vc     Output   'Vc'      double  1       3
//
// engee-cfunction-end
//

//передача в структуру значений частоты и амплитуды
sine_generator_SinGen_U.Frequency = F;
sine_generator_SinGen_U.Amplitude = A;

sine_generator_SinGen_step();

// передача из структуры величин мгновенных напряжений по фазам
Va = sine_generator_SinGen_Y.Sin_A;
Vb = sine_generator_SinGen_Y.Sin_B;
Vc = sine_generator_SinGen_Y.Sin_C;
Contents of the tab </> StartCode the block C Function:
// вызов функции инициализации
sine_generator_SinGen_init();
Contents of the tab </> TerminateCode the block C Function:
// вызов функции терминации
sine_generator_SinGen_term();
Modeling embedded code
Download and execute the model sine_generator_test.engee to test the generated code:
if "sine_generator_test" in [n.name for n in engee.get_all_models()]
    n = engee.open( "sine_generator_test" );
else
    n = engee.load( "$(@__DIR__)/sine_generator_test.engee" );
end

test = engee.run(m);
From the obtained model data, we will plot the output variables - the instantaneous phase voltages. SinGen.Sin_A, SinGen.Sin_B, SinGen.Sin_C.
plot(test["SinGen.Sin_A"].time, test["SinGen.Sin_A"].value,
    label="V_a", size=(900,300), lw=2, st=:step)
plot!(test["SinGen.Sin_B"].time, test["SinGen.Sin_B"].value,
    label="V_b", size=(900,300), lw=2, st=:step)
plot!(test["SinGen.Sin_C"].time, test["SinGen.Sin_C"].value,
    label="V_c", size=(900,300), lw=2, st=:step,
    legend=:topleft)
xlabel!("Time, seconds")
ylabel!("Voltage, V")
As can be seen from the graphs obtained, the resulting voltage signals in the test model also have a sinusoidal appearance with the specified frequency, amplitude, and phase shift.
Let's also compare the simulation results of sinusoidal phase A signals for the initial and test models.:
plot(data["SinGen.Sin_A"].time, data["SinGen.Sin_A"].value,
    label="V_a", size=(900,300), lw=4, st=:step)
plot!(test["SinGen.Sin_A"].time, test["SinGen.Sin_A"].value,
    label="V_a_test", size=(900,300), lw=2, st=:step,
    legend=:topleft)
xlabel!("Time, seconds")
ylabel!("Voltage, V")
As can be seen from the above graphs, the results of modeling the initial model and the model for verifying the results of code generation are completely identical.
Embedding code in an Arduino sketch
To test the developed algorithm on the target device, you need to connect the generated files. sine_generator_SinGen.c and sine_generator_SinGen.h to the user program project.
This example uses the Iskra Neo controller from Amperka to demonstrate. The execution of the algorithm on the target device consists in transmitting the values of the generated signals by the controller to the serial port. The display of the transmitted values will be carried out by the Arduino IDE tools.
To embed the algorithm code, a sketch for the Arduino IDE was previously developed. sine_generator.ino, which is also attached to the folder of this demo. The content of the sketch is functionally identical to the content of the block C Function the Engee test model, except for the functions of working with peripherals and the calculation step maintenance cycle. A detailed description of how the sketch works is given in the comments to the code.
Code execution on Arduino
After successfully compiling and uploading the sketch to the target device, we will open the "Serial Plotter" from the Arduino IDE toolkit. A screenshot of the plotter with the output signals is shown in the figure below.
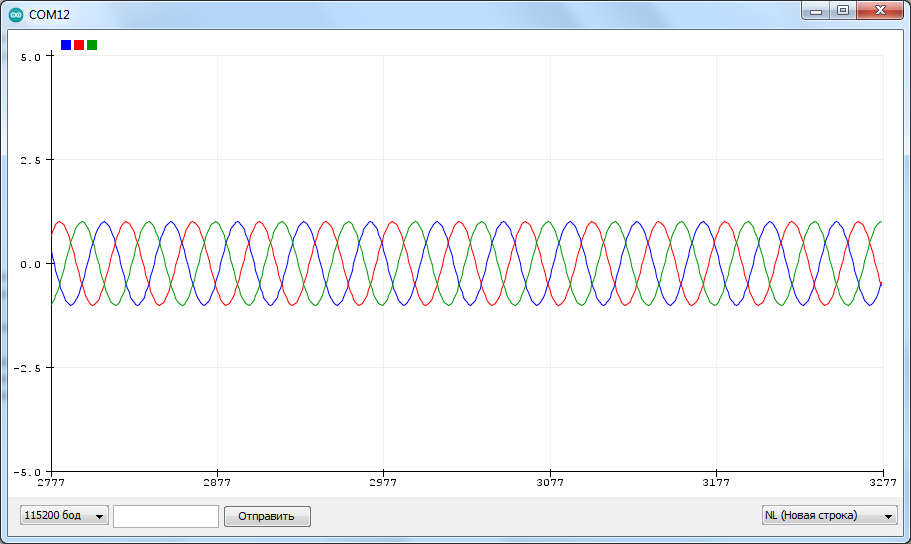
The plotter graphs show that the resulting signals also have preset amplitude, frequency, and phase shifts.
Conclusion
In this demo, a model of a three-phase sinusoidal signal generator with preset parameters - amplitude, frequency, and phase shift - was developed. The generator algorithm was debugged in the Engee model, then the resulting code generation files were tested by embedding into the Engee model, and finally the generated C files were uploaded to a custom sketch and tested on the target device.
Thus, using a simple example of a sine wave generator, we examined the possibilities of generating code from the Engee model.