Code generation for MIC32 (Fuzzy Controller Testing)
This demo shows the development of the Engee model for testing a fuzzy controller over the entire input signal range with output output to the DAC of the MIK32V2 microcontroller.
Introduction
The purpose of the example is to test the operation of a fuzzy controller with two inputs and one output. The fuzzy controller model is assembled from separate blocks of the Engee basic library for ease of familiarization with the functional features of the controller. The target device used in this demo is the MIK32 NUKE V0 debugging board.3 based on microcontroller [K1948VK018 MIK32 Amur](https://mikron.ru/products/mikrokontrollery/mk32-amur /). The code was compiled and uploaded to the microcontroller from VS Code with the PlatformIO extension.
Description of the model
The general view of the model is shown in the figure below.
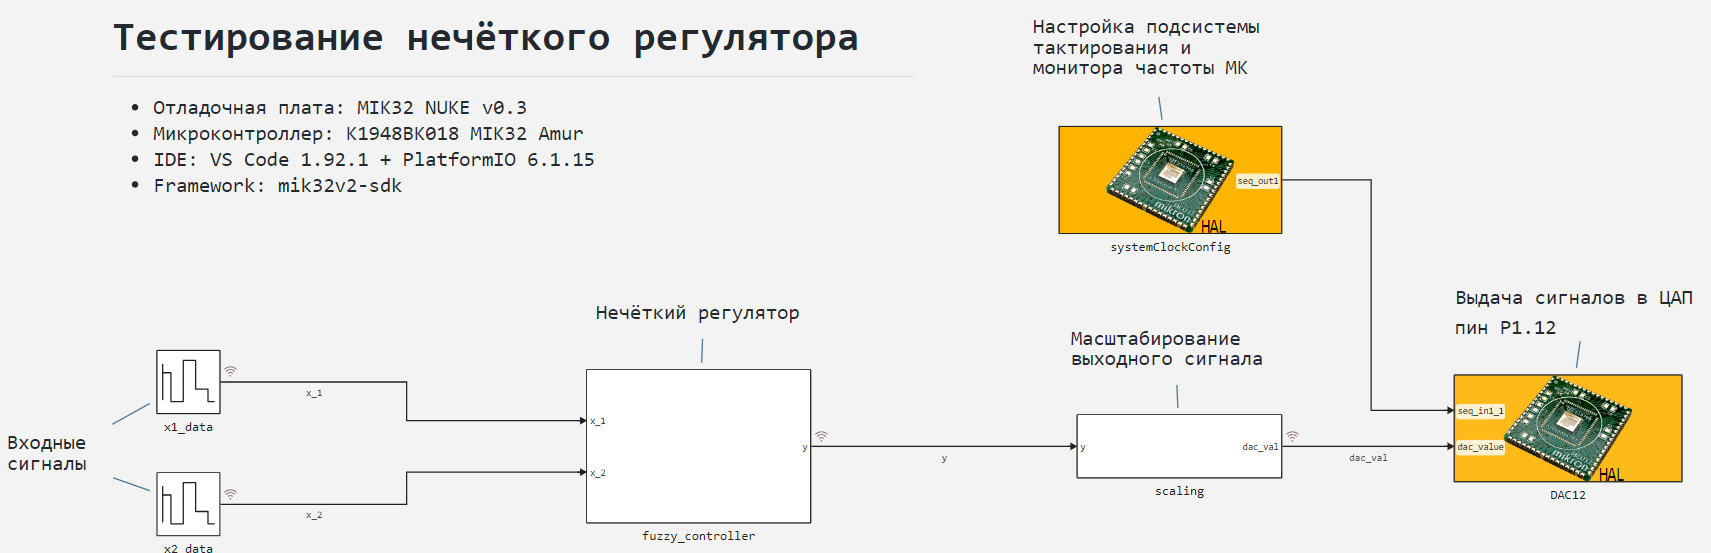
It consists of blocks for setting two input, testing signals, a subsystem of a fuzzy controller with two inputs and one output, a subsystem for scaling the output signal, and peripheral blocks of the HAL library MIC32.
Inputs and outputs of the regulator
Repeating variable discrete signals from the [Repeating Sequence Stair] blocks are applied to the inputs of the controller (https://engee.com/helpcenter/stable/en/base-lib-sources/repeating-sequence-stair.html ):
# Input signals:
x1_data = Vector(range(-2,2,105))
x2_data = Vector(range(-2,2,21))

# Sampling step:
Ts = 0.01

using Plots
gr()
plot([x1_data,x2_data]; label=["x1_data" "x2_data"],
     st=:step, title = "Input signals", aspect_ratio=10)
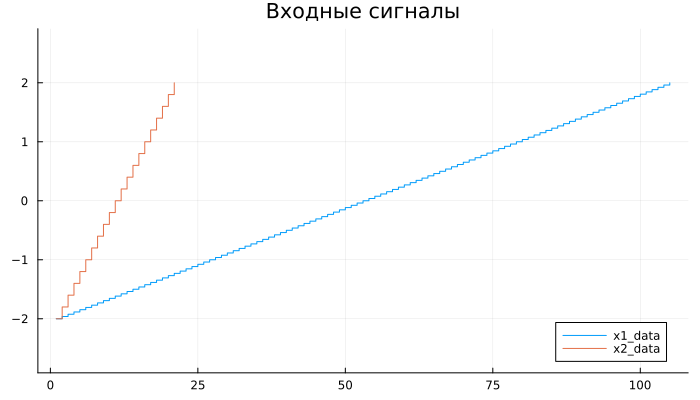
This setting of the input signals allows you to check the results of calculations of the output signal of the controller over the entire range of values of one and the second signals.
Subsystem operation scaling it consists in changing the range of values and the data type of the output signal of the controller: :
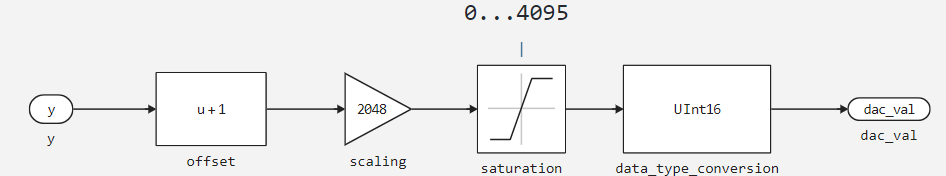
The signal is limited from 0 to 4095, since the MIC32 DACs have a 12-bit bit rate, the data format is integer, unsigned, 2 bytes.
The structure of the fuzzy controller
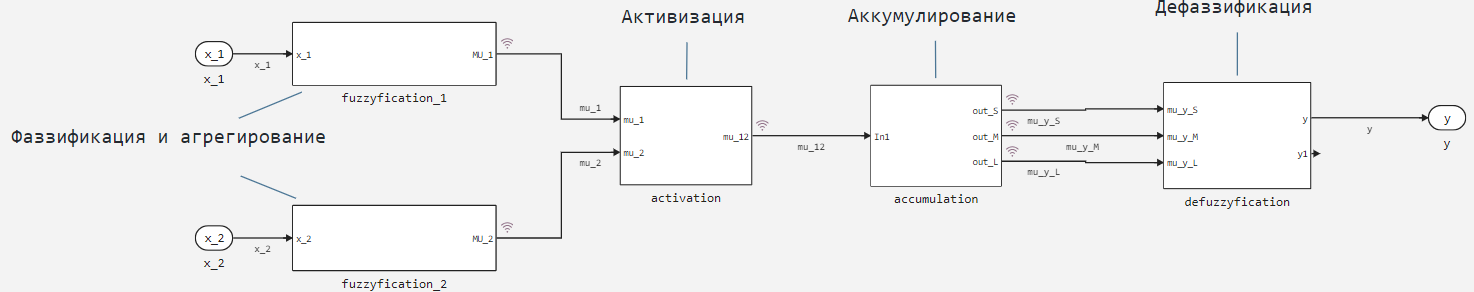
The fuzzy controller is built according to the Mamdani algorithm and consists of identical fuzzification and aggregation blocks, an activation block (min function), an accumulation block (max function), and a defuzzification block (center of gravity method for single-point sets, COGS).
The number of linguistic terms of the input signals is 3, the output signal is 3.
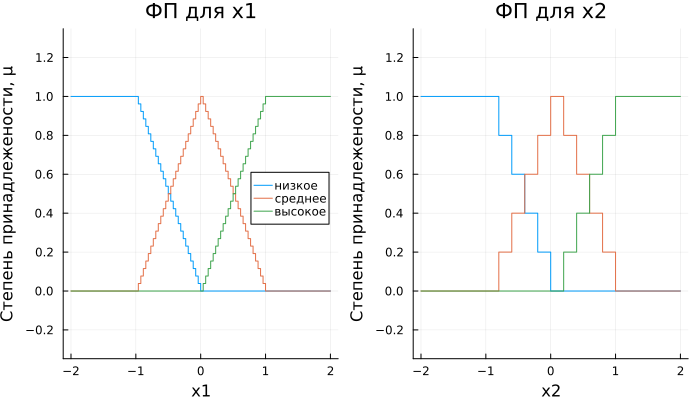
Fuzzification and aggregation
The input variables have three linguistic terms that accept non-zero truth values in the ranges of "LOW": , "AVERAGE": , "HIGH": . At the aggregation stage, triangular membership functions (AF), symmetrical with respect to zero, are applied to the input signals. In subsystems fuzzyfication The OP is played in blocks 1-D Lookup Table. The calculation of the AF for the terms of the input variables is given below.
# OP for x1
μ_S_x1 = -x1_data;
μ_M_x1 = 1.0.-abs.(x1_data);
μ_L_x1 = copy(x1_data);

μ_x1 = [μ_S_x1, μ_M_x1, μ_L_x1];

# OP for x2
μ_S_x2 = -x2_data;
μ_M_x2 = 1.0.-abs.(x2_data);
μ_L_x2 = copy(x2_data);

μ_x2 = [μ_S_x2, μ_M_x2, μ_L_x2];

термы = ["low" "average" "high"];
Input saturation function:
function saturation(µ)
    for i in 1:length(μ)
        if μ[i] > 1
            μ[i] = 1.0
        end
        if μ[i] < 0
            μ[i] = 0.0
        end
    end
end;
Applying saturation to terms, constructing membership functions:
for i in 1:3
    saturation(µ_x1[i])
end

for i in 1:3
    saturation(µ_x2[i])
end

график1 = plot(x1_data, μ_x1; title = "OP for x1", label = термы, xlabel = "x1")
график2 = plot(x2_data, μ_x2; title = "OP for x2", label = :none, xlabel = "x2")
plot(graph1, graph2;
     ylabel = "Degree of affiliation, μ", legend = :right, aspect_ratio=3)
Activation
At the stage of activation in the subsystem activation The conclusions for all combinations of terms are defined. Activation is performed by the minimum function:
Accumulation
In the subsystem accumulation The following rule base is reproduced:
- ** IF** ( "LOW" AND ( "LOW" OR "AVERAGE")) ** THEN** "LOW"
- ** IF** ( "LOW" AND "HIGH") OR
( "AVERAGE" AND ( "LOW" OR "AVERAGE")) ** OR**
( "HIGH" AND "LOW") THEN "AVERAGE" - ** IF** ( "AVERAGE" AND "HIGH") OR
( "HIGH" AND ( "AVERAGE" ** OR** "HIGH")) THAT "HIGH"
For clarity, let's present it in the form of a table.:
колонки = ["low", "average", "high"];
rows = copy(columns);
baza_edited = [
                "low" "average" "average";
                "low" "average" "high";
                "average" "high" "high"
               ];
(n,m) = size(base_edit)

heatmap(base_edit, fc = cgrad([:blue; :red; :green]), leg=false, xticks=(1:3,columns), yticks=(1:3,rows))
title!("The rule base")
xlabel!("Terms x1")
ylabel!("Terms x2")
annotate!( [(j, i, base_added[i,j]) for i in 1:n for j in 1:m])
vline!(0.5:(n+0.5), c=:black)
hline!(0.5:(m+0.5), c=:black)
The degrees of truth of the output terms are determined in the maximum function from the conclusions according to the expressions:
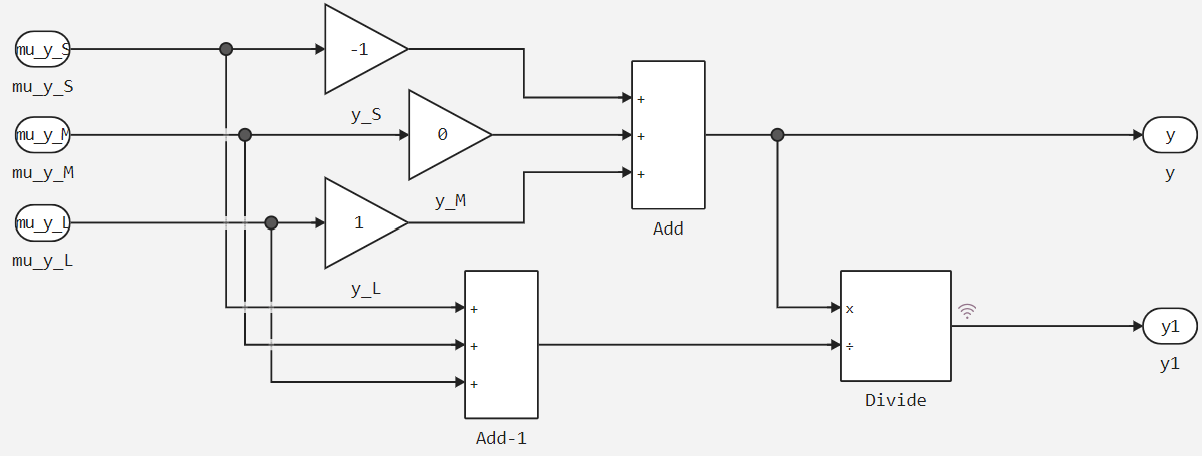
Defuzzification
In the subsystem defuzzyfication The center of gravity method for single-point sets (COGS) is implemented. The midpoints for the membership functions of the output terms: . The calculation is implemented without reducing the degrees of membership to the sum ( ) and with a cast ( ). For modeling and testing, we further use the first method.
Simulation results
Download and execute the example model:
# @markdown **Software modeling management:**
# @markdown Requires you to enter only the model name
имя_модели = "mik32_fuzzy_reg" # @param {type:"string"}
if the model name is in [m.name for m in engee.get_all_models()]
    model = engee.open( model name );
else
    модель = engee.load( "$(@__DIR__)/"*имя_модели*".engee" );
end
data = engee.run(model);
Plotting the output variable
plot(данные["dac_val"].time, данные["dac_val"].value;
     label="y", title="The output signal", xlims=(0,1.1))
This signal is included in the program loaded into the controller and will be transmitted to the digital-to-analog converter.
The controller peripherals in the model are implemented using [C Function] blocks (https://engee.com/helpcenter/stable/en/base-lib-user-defined-function/c-function.html ), as it was implemented in early DAC examples for MIC32: sawtooth signal, Engee logo.
Code generation and project assembly
# @markdown **Code generation:**
# @markdown A folder for the code generation results will be created in the script folder:
папка = "code" # @param {type:"string"}

# @markdown Code generation for the subsystem:
включить = false # @param {type:"boolean"}
if(enable)
    подсистема = "" # @param {type:"string"}
    engee.generate_code( "$(@__DIR__)/"*имя_модели*".engee", "$(@__DIR__)/"*папка;
                     subsystem_name = subsystem)
else
    engee.generate_code( "$(@__DIR__)/"*имя_модели*".engee", "$(@__DIR__)/"*папка)
end
The project with the model is assembled in the IDE VS Code+PlatformIO, the assembly process is similar to the process from the example MIC32: Sawtooth signal generator.
The only exception is that the compiled program is loaded not into the RAM of the controller, but into flash memory via the SPIFI interface. The configuration file is attached to configure PlatformIO in the example. platformio.ini. Let's move on to executing the code on the microcontroller.
Code execution on MIK 32
After successful assembly and compilation of the project, we will connect an oscilloscope to the P1.12 microcontroller channel and display the oscilloscope.
As can be seen from the waveform, the shape of the simulated output signal of the fuzzy controller under test is reproduced in the DAC channel.
Conclusion
In this example, we examined the structure of the fuzzy controller in the Engee model, simulated its testing, and tested the controller on the MIC32 Amur microcontroller after generating the code from the model. The simulation and test results on the controller are identical and correspond to the specified algorithm.