Code generation for Arduino (Flashing LED on finite state machines)
In this example, we will develop the simplest model in Engee for controlling the built-in LED of Arduino-compatible boards using the library Finite automata.
Introduction
The Engee Finite State Machine Library** serves as a useful and effective tool for developing control algorithms, including for target platforms. The representation of the algorithm as a graph with several defined states and conditional transitions between them makes it more intuitive and convenient for debugging and upgrading. This increases the speed of control program development and reduces the likelihood of error.
The purpose of this example is to show the process of creating a blinking LED control algorithm for Arduino-compatible platforms using a library of finite automata.
The example is, in fact, a variant of the demo example. arduino_blink and it includes a description and demonstration of how the model works. blink_chart. In this model, the LED status (on/off) and the amount of switching delay is determined by the unit chart.
Hardware support
You can use any Arduino-compatible platform to test the algorithm. The multiplatform nature of engee models is due to the fact that the generated C code is imported as plug-in C files, and the hardware configuration takes place in third-party software.
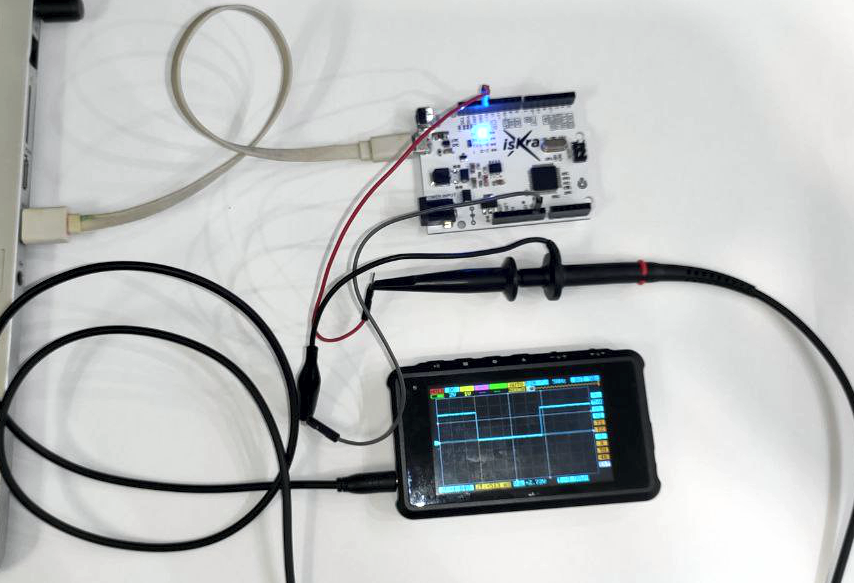
In this example, we use the Iskra Neo debugging board from Amperka. It connects to a PC via a USB-USB-micro cable. The [Arduino IDE] is used to compile the user program and upload it to the controller(https://www.arduino.cc/en/software /), and an interface chip driver is also required. A portable digital oscilloscope [DSO Quad Alloy Black from Seeed Studio] is used to demonstrate how the program works on hardware (https://amperka.ru/product/dso-quad-oscilloscope ).
Description of the model
The integrated LED control model of the Arduino board consists of one unit Chart reproducing the control algorithm, and two output contacts Outport: out_LED_BUILTIN and Сhart. The first signal as a variable is associated in the Arduino sketch with the output pin (GPIO) number 13, which is also the control contact of the built-in LED. The second signal displays the status of the internal counter of the unit Chart. Both signals are also used for logging in the model.
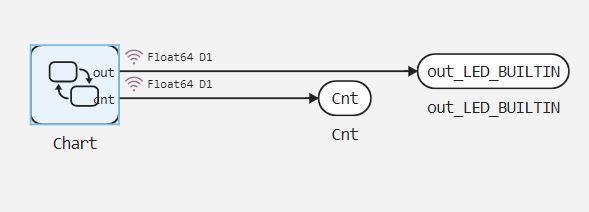
In the block chart Two output signals are used: out, the initial value is "true" and cnt
State diagram
State diagram (block content Chart) has 4 states:
init- the initial state of the algorithm, the initial value of the counter is set when entering the statecnt = 0;.increment- the main state of the algorithm, here the counter value is compared with the transition conditions (transitions numbered 1, 2, 3) and the counter value is increased when entering the statecnt = cnt + 1;. An increase in the counter value by "1" actually corresponds to an increase of 1 ms, since the calculation of the algorithm will take place in 1 ms, which will be defined further in the Arduino sketch code.ON- the state in which the counter increases if its value is less than 499 ms. When this condition is met, the output signal controlling the LED is set to "true".OFF- the state in which the counter increases if its value is greater than or equal to 499 ms. When this condition is met, the output signal controlling the LED is set to "false".
When the counter reaches a value greater than or equal to 998 ms, the diagram switches to the state init. The counter is limited to 998 ms due to the fact that it takes two more cycles of 2 ms to calculate the init state, which does not directly control the LED. Thus, the total duration of the LED flicker period is 1000 ms.
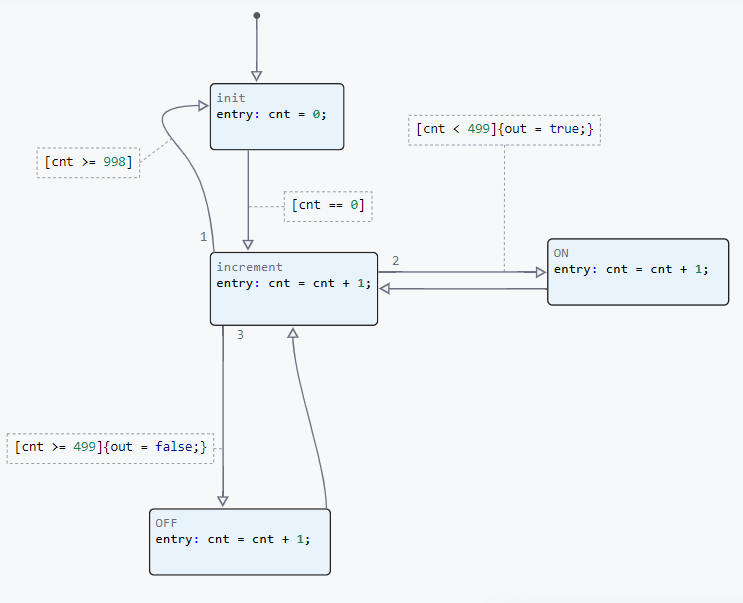
Another important point to consider when developing a model is the order in which transitions are executed. It is in this order that the conditions for the transition from a state to a conditional construction will be prescribed. if(){} elseif(){} ... else{} generated C file.
For example, in this model, the condition is the end of the period [cnt >= 998] it is checked first, although if its order was 3, then the successful fulfillment of the condition [cnt >= 499] it would prevent it from being checked and the period counter would not reset. On the other hand, checking the end condition of the period in each calculation cycle is not effective, and this transition should be assigned order 3 and the transition condition should be changed to the state OFF on [(cnt >= 499) && (cnt < 998)]
Simulation results
Let's load the described model:
if "blink_chart" in [m.name for m in engee.get_all_models()]
    m = engee.open( "blink_chart" );
else
    m = engee.load( "$(@__DIR__)/blink_chart.engee" );
end

data = engee.run(m);
From the obtained model data, we will plot the change in the counter value.:
using Plots
plot(data["Cnt"].time, data["Cnt"].value,
    label="Cnt", size=(900,300), lw=2)
xlims!(0.0,3.0)
As you can see, the value of the counter varies from 0 to 1000, with a frequency of 1000 ms. Now let's plot the signal graph out_LED_BUILTIN, which controls the built-in Arduino LED.
plot(data["out_LED_BUILTIN"].time, data["out_LED_BUILTIN"].value,
    label="out_LED_BUILTIN", size=(900,300), lw=2)
xlims!(0.0,3.0)
We have received a periodic rectangular signal with a period of 1000 ms and a fill factor of 50%.
Running the algorithm on Arduino
To transfer the developed model to the target device, we will generate a C code.:
engee.generate_code( "$(@__DIR__)/blink_chart.engee",
                     "$(@__DIR__)/sketch_blink_chart_custom/blink_chart_code" )
The plug-in files were generated in the specified directory. Also in the directory sketch_blink_chart_custom a pre-written Arduino sketch with the name of this directory has been posted. sketch_blink_chart_custom.ino. It connects the header file obtained during code generation, initializes the microcontroller's peripherals, and calls functions to control the LED. A detailed description of the sketch is given in the comments of its code.
To execute the code on Arduino, you need to download the directory sketch_blink_chart_custom and upload the sketch sketch_blink_chart_custom.ino from the Arduino IDE to the target device. In our case, as mentioned earlier, this is Iskra Neo from Amperka.
After the sketch is compiled, a message is displayed about the success of the operation and the size of the output file.:

Removing signals from the Arduino board
After loading the code into the Arduino, you can see a flashing LED on the debugging board. For clarity, in the description of the example, we will connect the measuring contact of the oscilloscope to pin 13 on the debugging board and remove the oscilloscope.
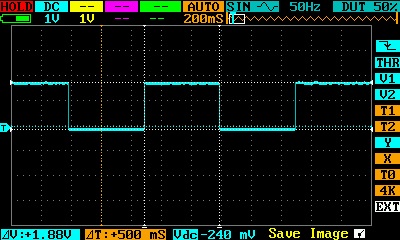
As can be seen from the removed waveform, a periodic rectangular signal with a fill time of 500 ms and a period of 1000 ms is formed on pin 13 of the debugging board.
Conclusion
In the considered example, a digital output control model was developed for Arduino-compatible platforms using the Engee finite state machine library, and the principles of correct and efficient operation during code generation are described.
A code was generated from the developed model and uploaded to the target device. The result of the program execution on the debugging board fully corresponds to the simulation results.