Control of pressure in the pipeline
The example demonstrates the Engee pipeline pressure control model, followed by the execution of the code generated from the model on an Arduino microcontroller.
Introduction
This example is the next stage in the development of the example "Pressure control modeling in трубопроводе". At the previous stage, the technological part of the facility was reviewed and the regulator was debugged to stabilize the set pressure. At the current stage, the control system has been expanded to automatically adjust the changing pressure in the pipeline and blocks. C Function for the interaction of the control algorithm with the microcontroller peripherals.
Management system model
The technological part of the model has the same representation as in the model of the previous stage of the project.
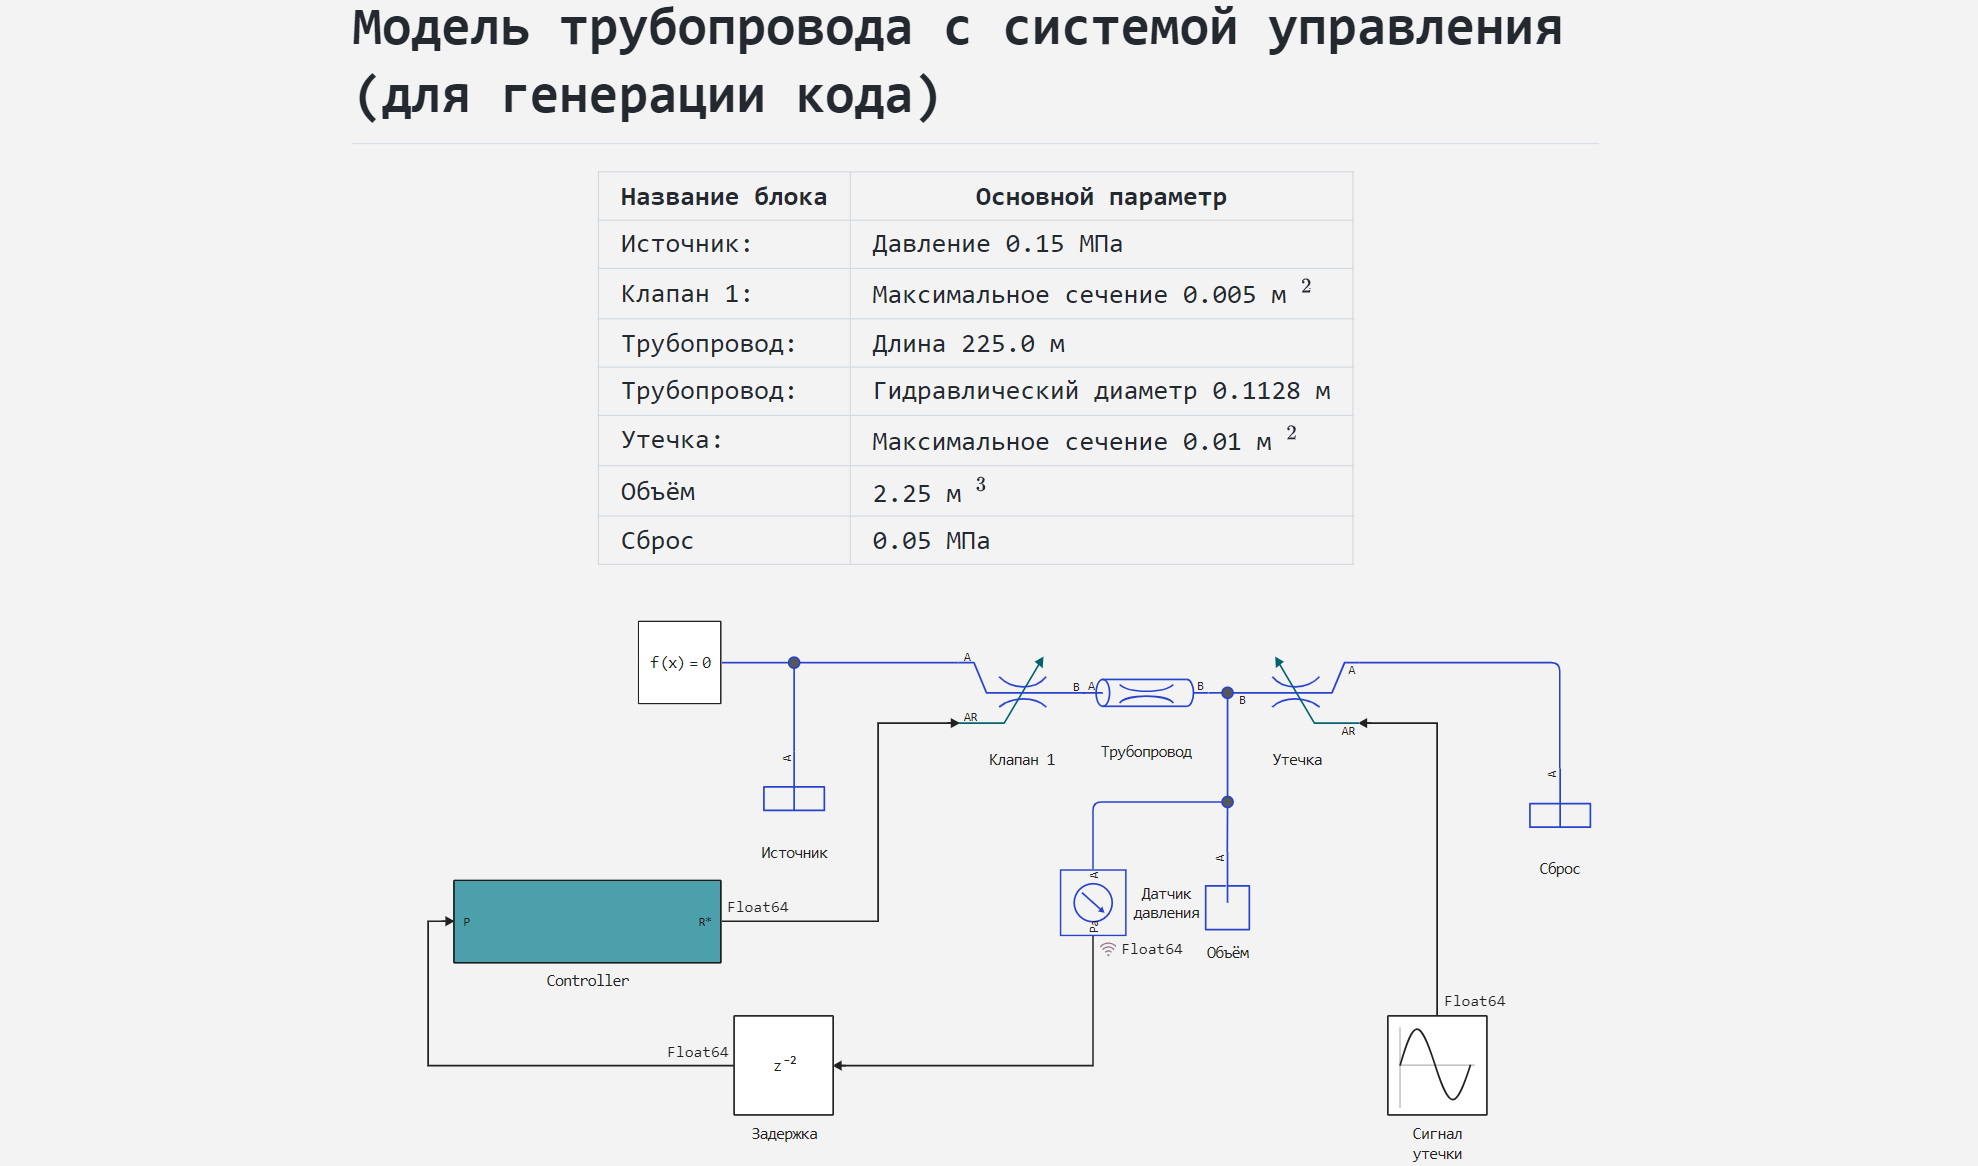
The pipeline management system is integrated into a subsystem Controller for subsequent code generation.
The following main functional parts can be distinguished in this subsystem:
- blocks
C Functioninteractions with the microcontroller peripherals, - block
Chartformation of the set pressure in the pipeline, - PI controller subsystem.
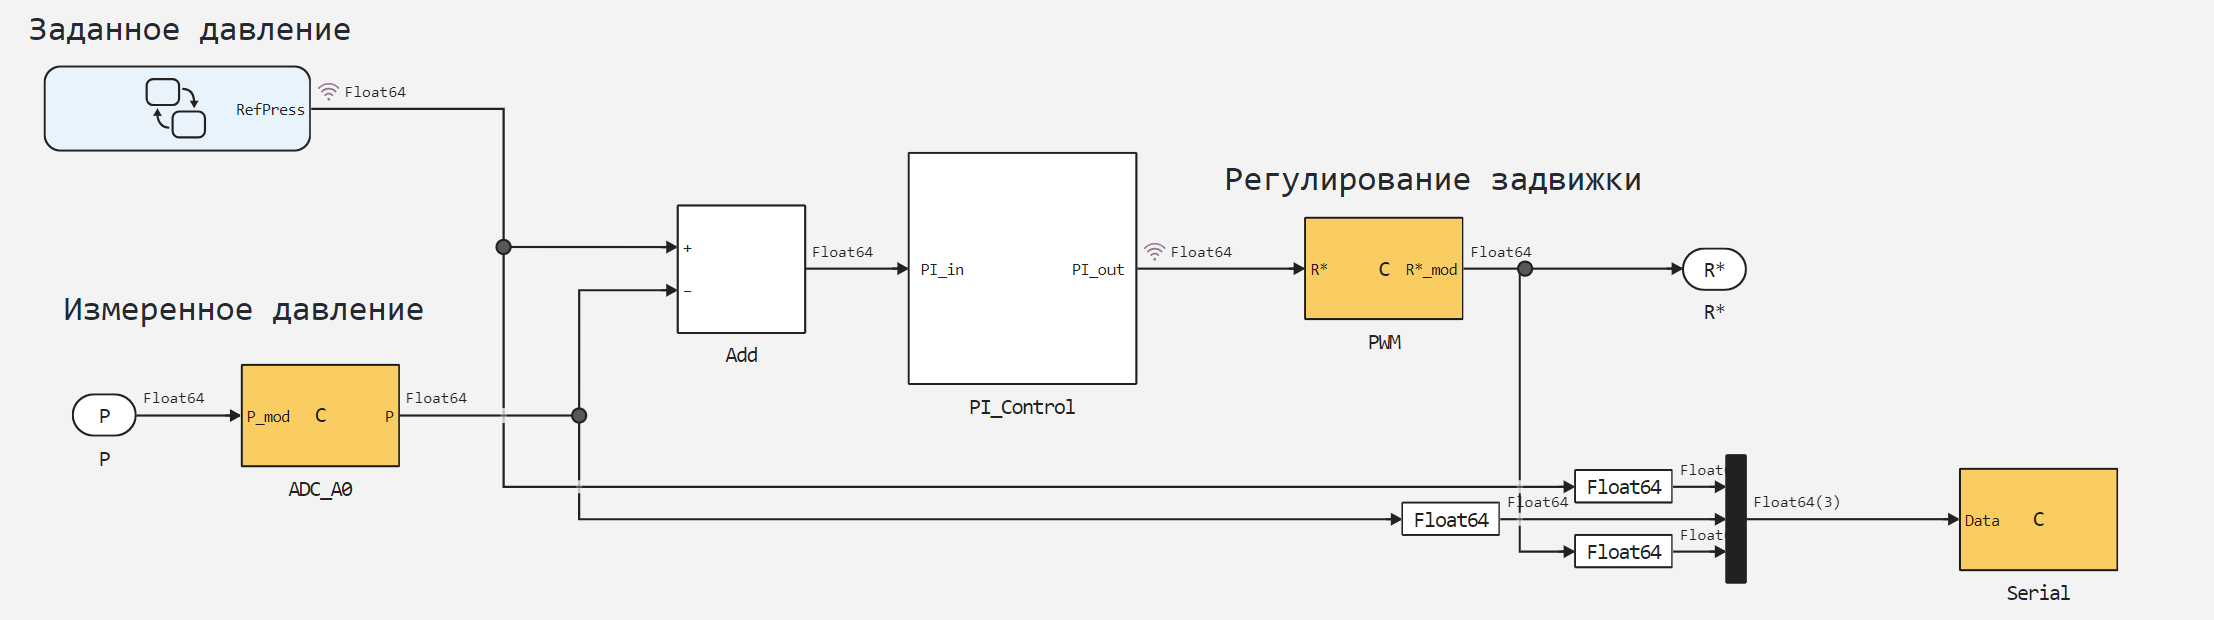
The peripheral interaction units have the following purpose:
ADC_A0- reading and scaling of the analog signal from the outputA0microcontroller Arduino,PWM- scaling the control signal and transmitting it to the PWM channel of the microcontroller to adjust the position of the gate valve,Serial- to output an array of values to the serial port: set and measured pressure, control signal.
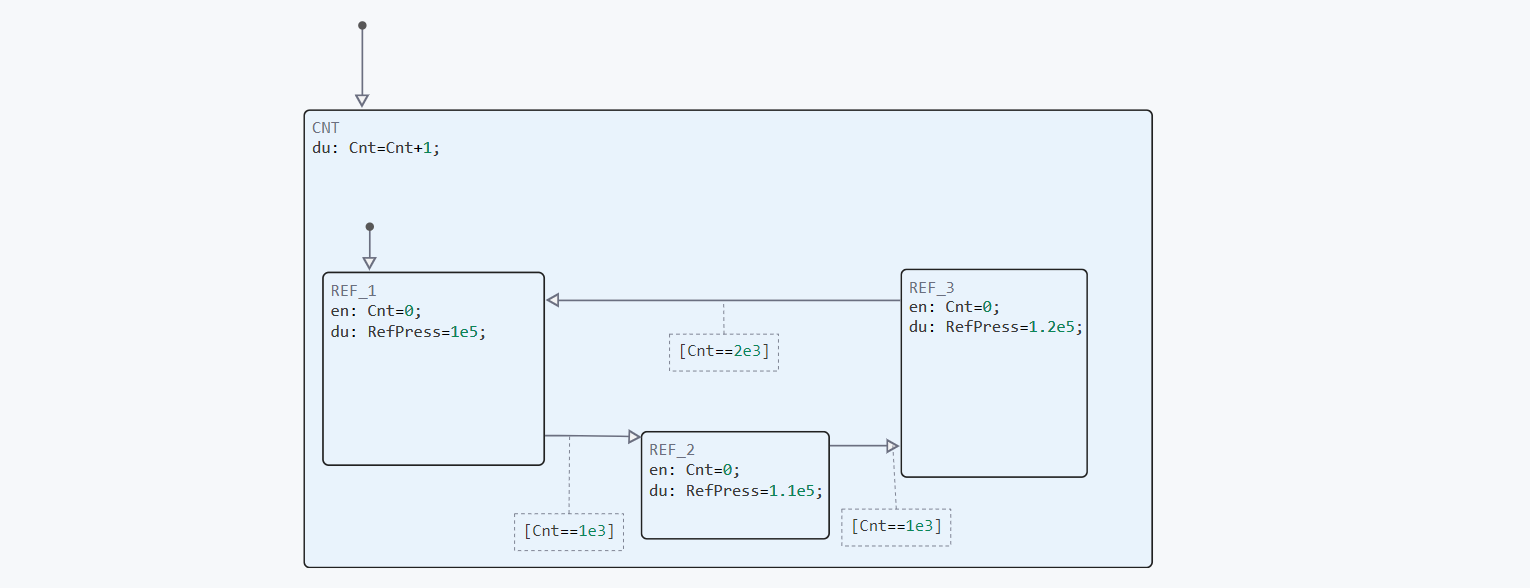
The PI controller is represented in discrete elements and has the following coefficients: . Pressure setting unit Chart It is a diagram with one parent and three child states, each of which generates its own pressure setting value. Switching between them takes place via an internal counter. Cnt.
Simulation of pressure regulation
To simulate the operation of the control system, we will load and run the model arduino_pressure_regulator.engee:
if "arduino_pressure_regulator" in [m.name for m in engee.get_all_models()]
    m = engee.open( "arduino_pressure_regulator" );
else
    m = engee.load( "$(@__DIR__)/arduino_pressure_regulator.engee" );
end

data = engee.run(m);
From the obtained simulation data, we will plot the signal graphs:
Chart.RefPress- set pressure in the pipeline,
Датчик давления.1- the measured pressure in the pipeline.
using Plots
plotlyjs()
plot(data["Chart.RefPress"].time,
     data["Chart.RefPress"].value,
     label="Set pressure",
     lw=2, size=(900,300), legend=:topright)
plot!(data["Pressure sensor.1"].time,
     data["Pressure sensor.1"].value,
     label="Measured pressure",
     lw=2)
As can be seen in the graphs, the control system automatically generates a changing pressure setting and regulates the current pressure in the pipeline.
Code generation
Generate the code from the subsystem Controller for the subsequent loading of the control algorithm into the microcontroller:
engee.generate_code( "$(@__DIR__)/arduino_pressure_regulator.engee",
                     "$(@__DIR__)/Controller_code";
                     subsystem_name="Controller" )
Received in the directory Controller_code files - arduino_pressure_regulator_Controller.h and arduino_pressure_regulator_Controller.c next, we will use it when connecting in the sketch. pressure_controller.ino. Let's move on to performing this sketch on a microcontroller.
Execution on the target device
To test the algorithm before debugging the Engee model for a real object in this example, we will use the Arduino MEGA2560 debugging board. In the Arduino IDE environment, we will compile and upload a sketch with connected C files generated from the model to the microcontroller. After booting, the following graphs can be observed in the serial port of the computer:
The graphs show how the control signal of the PI controller changes (third graph) when the current pressure in the pipeline changes (second graph, simulated signal).
Conclusion
In this demo example, we examined the development of a pipeline control model for automatically generating a preset pressure using a library. Engee finite automata, followed by code generation and testing of the implementation of the developed control model on the target device.