angle
Phase angle.
| Library |
|
Arguments
Input arguments
# z — input data
+
scalar | vector | the matrix | multidimensional array
Details
Input data specified as a scalar, vector, matrix, or multidimensional array. If the elements z — non-negative real numbers, then angle returns 0. If the elements z — negative real numbers, then angle returns π.
| Data types |
|
| Support for complex numbers |
Yes |
Output arguments
# theta — output phase angles
+
scalar | vector | the matrix | multidimensional array
Details
Output angles returned as a scalar, vector, matrix, or multidimensional array. Angles in theta such that z = abs(z).*exp(i*theta).
Examples
The modulus and phase of a complex number
Details
Create a complex number z and calculate its modulus r and the phase theta.
import EngeeDSP.Functions: angle
import EngeeDSP.Functions: abs

z = 2 * exp(im * 0.5)
r = abs(z)
theta = angle(z)

println("z=",z)
println("r=",r)
println("theta=",theta)
z=1.7551651237807455 + 0.958851077208406im
r=2.0
theta=0.5The FFT phase
Details
Let’s create a signal consisting of two sinusoids with frequencies 15 Hz and 40 Hz. The first sine wave has a phase −π/4, and the second — π/2. Sampling the signal with frequency 100 Hz for one second.
import EngeeDSP.Functions: angle, fft, fftshift
fs = 100
t = 0:1/fs:1-1/fs
x = cos.(2*pi*15*t .- pi/4) .- sin.(2*pi*40*t);
Calculate the Fourier transform of the signal. Let’s plot the dependence of the Fourier transform module on the frequency.
y = fft(x)
z = fftshift(y)

ly = length(y)
f = (-ly/2:ly/2-1)/ly*fs;

plot(f, abs(z), xlabel="Frequency (Hz)", ylabel="|y|")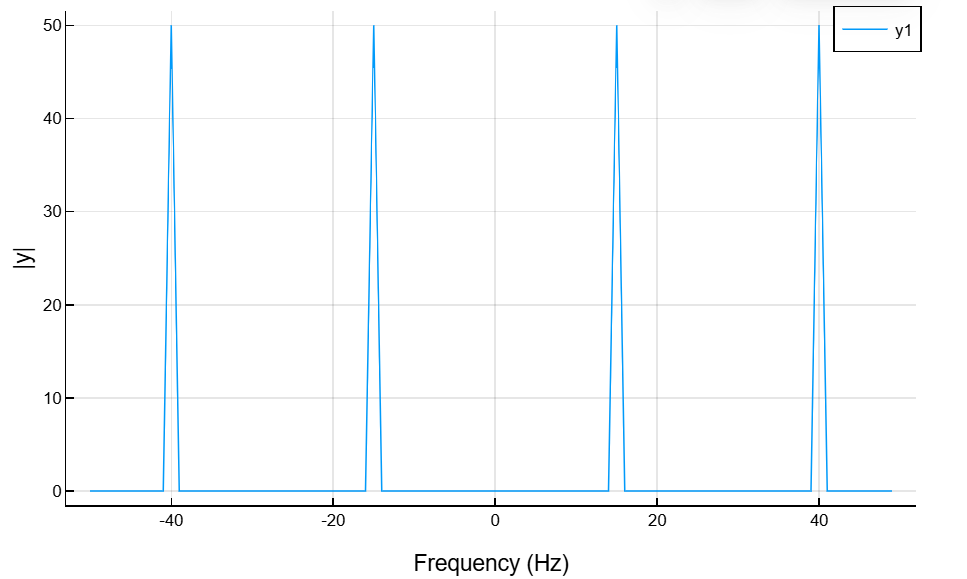
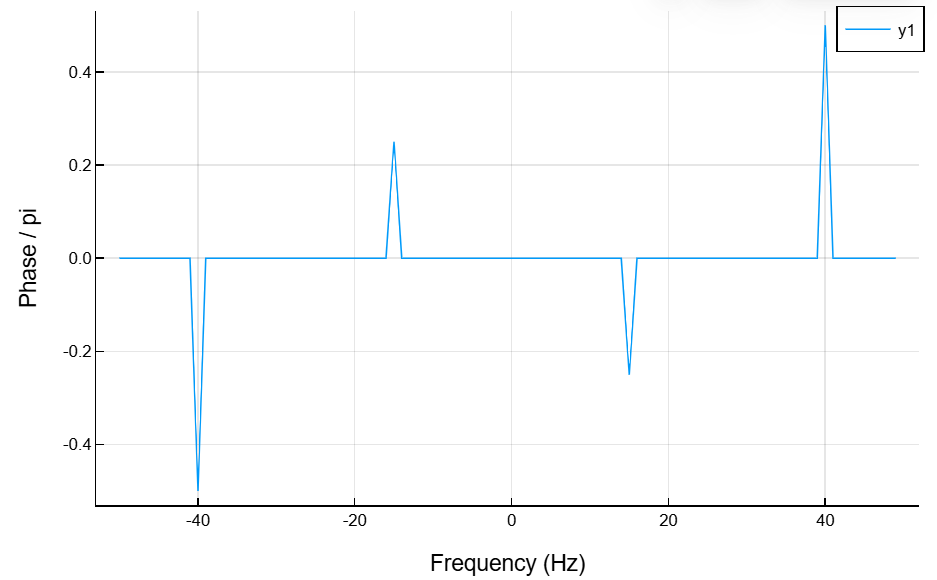
We calculate the phase of the Fourier transform by removing the values of the small amplitude transform. Let’s plot the phase dependence on frequency.
tol = 1e-6
z[abs(z) .< tol] .= 0

theta = angle(z)
plot(f, theta/pi, xlabel="Frequency (Hz)", ylabel="Phase / pi")