rpmfreqmap
A frequency-reversal map for analyzing orders.
| Library |
|
Syntax
Function call
-
map,freq,rpm,time,res = rpmfreqmap(x,fs,rpm)— returns the matrix of the frequency turnover cardmapobtained as a result of frequency analysis of the input vectorx, as well as vectors with frequenciesfreq, rotation speedsrpmand moments of timetimein which the frequency map is calculatedmap. The function also returns the resolution band used.res.Input argument
xIt is measured at a set speed value.rpmexpressed in rpm . Argumentfs— sampling rate in Hz. Each column of the matrixmapcontains RMS estimates of the amplitude of the spectral components for each valuerpm. Functionrpmfreqmapuses the short-term Fourier transform to analyze the spectral components of a signalx.
-
rpmfreqmap(___,out=:plot)— builds a frequency map as a function of rotation speed and time on an interactive graph. The graph is also known as the Campbell diagram.
Arguments
Input arguments
#
fs —
sampling
rate
scalar
Details
The sampling rate, set as a positive scalar, expressed in Hz.
# rpm — rotation speed
+
vector
Details
The rotation speed, set as a vector of positive values expressed in rpm. Length of the argument rpm must match the length of the argument. x.
-
If there is a pulse signal of the tachometer, use the function
tachorpmfor direct extractionrpm. -
If there is no pulse signal of the tachometer, use the function
rpmtrackto extractrpmfrom the vibration signal.
# res — resolution band
+
fs/128 (by default) | scalar
Details
The resolution band of the frequency-reversal card, set as a positive scalar. If the argument is res if not specified, then the function rpmfreqmap sets its value equal to the sampling frequency divided by 128. If the signal duration is insufficient, the function uses the entire length of the signal to calculate a single frequency estimate.
| Типы данных |
|
Input arguments «name-value»
Specify optional argument pairs as Name,Value, where Name — the name of the argument, and Value — the appropriate value. Type arguments «name-value» they should be placed after the other arguments, but the order of the pairs does not matter. You can specify multiple pairs «name-value».
Use commas to separate the name and value, and Name put it in quotation marks.
Example: rpmfreqmap(x, fs, rpm, "Scale", "dB", "Window", "hann") sets the frequency map rating scale in dB and uses the Hanna window.
# Amplitude — type of amplitude
+
"rms" (by default) | "peak" | "power"
Details
The type of amplitude of the frequency-reversal card, set by one of the following values:
-
"rms"— returns the RMS amplitude for each estimated frequency; -
"peak"— returns the peak amplitude for each estimated frequency; -
"power"— returns the power level for each estimated frequency.
# OverlapPercent — percentage of overlap between adjacent segments
+
50 (by default) | scalar
Details
The percentage of overlap between adjacent segments, given as a scalar of 0 before 100. Meaning 0 means that adjacent segments do not overlap. Meaning 100 means that adjacent segments are offset by one count. A higher percentage of overlap provides a smoother map, but increases calculation time. For more information, see Function description rpmordermap.
| Типы данных |
|
# Scale — the scale of the frequency-turnover card
+
"linear" (by default) | "dB"
Details
The scale of the frequency-reversal card, set by one of the following values:
-
"linear"— returns a map with a linear scale; -
"dB"— returns a map with a logarithmic scale, the values of which are expressed in dB.
# Window — The analysis window
+
"hann" (by default) | "chebwin" | "flattopwin" | "hamming" | "kaiser" | "rectwin"
Details
The analysis window, set to one of the following values:
-
"hann"— Hannah sets the window. For more information, see Function descriptionhann. -
"chebwin"— sets the Chebyshev window. Use the tuple to indicate the attenuation of the side lobes in dB. The weakening of the side lobes should be greater45dB. If the attenuation value is not set, the default value is100dB. For more information, see Function descriptionchebwin.Example:
rpmfreqmap(x, fs, rpm, "Amplitude", "peak", "Window", ("chebwin", 80))sets the peak amplitude and uses the Chebyshev window with attenuation of the side lobes80dB. -
"flattopwin"— sets a window with a flat top. For more information, see Function descriptionflattopwin. -
"hamming"— sets the Hamming window. For more information, see Function descriptionhamming. -
"kaiser"— sets the Kaiser window. Use a tuple to specify the form factor. . The form factor must be a positive scalar. If the value of the form parameter is not specified, it is used by default.0.5. For more information, see Function descriptionkaiser. -
"rectwin"— sets a rectangular window. For more information, see Function descriptionrectwin.
| Типы данных |
|
# out — type of output data
+
:data (default) | :plot
Details
Type of output data:
-
:data— the function returns data; -
:plot— the function returns a graph.
For this argument, the name and value are separated by an equal sign (=).
|
Output arguments
# map — frequency-turnover map
+
the matrix
Details
A map of the frequency versus the rotation speed, returned as a matrix.
Examples
Surface diagram of the frequency-turnover card
Details
We will generate a signal consisting of two linear and one quadratic chirps, all with a sampling frequency. 600 Hz during 15 seconds. The system generating the signal increases its rotation speed from 10 before 40 rpm during the testing period.
Let’s generate the tachometer readings.
fs = 600
t1 = 15
t = 0:1/fs:t1

f0 = 10
f1 = 40
rpm = collect(60 * range(f0, f1, length=length(t)))
Linear chirps have orders of magnitude 1 and 2.5. The component with the order 1 It has an amplitude equal to half the amplitude of the other component. A quadratic chirp starts with the order 6 and returns to this order at the end of the measurement. Its amplitude is 0.8. Let’s create a signal using this information.
o1 = 1
o2 = 2.5
o6 = 6

import EngeeDSP.Functions: chirp

x = 0.5 * chirp(t, o1 * f0, t1, o1 * f1) + chirp(t, o2 * f0, t1, o2 * f1) +
    0.8 * chirp(t, o6 * f0, t1, o6 * f1, "quadratic")
Let’s calculate a map of the dependence of the signal frequency on the rotation speed. We use the peak amplitude in each measuring cell. Specify the resolution 6 Hz. Let’s process the data using a flat-top window.
import EngeeDSP.Functions: rpmfreqmap

map, fr, rp = rpmfreqmap(x, fs, rpm, 6, "Amplitude", "peak", "Window", "flattopwin")
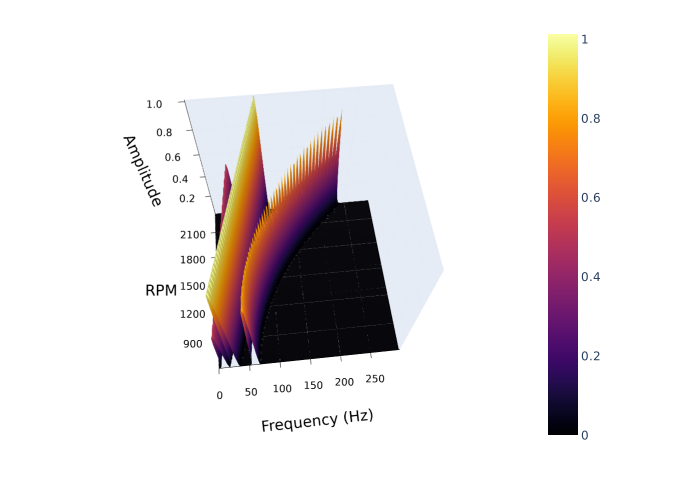
Let’s construct a frequency-turnover map in the form of a surface diagram.
FR = repeat(fr', length(rp), 1)
RP = repeat(rp, 1, length(fr))

surface(FR, RP, map';
        camera = (-6, 60),
        xlabel = "Frequency (Hz)",
        ylabel = "RPM",
        zlabel = "Amplitude")