Demonstration of the presentation generator capabilities
This file shows all the features of the slide generator: headings, text,
code, output, graphs, and two-column slides.
To run the example, call slides_compile(имя_файла.ngscript)
In [ ]:
# SKIP
gr(fmt=:png, size=(400,400))
Out[0]:
If there is an image in the slide, it becomes the only element.

This text will not be included in the presentation.
And these are images and text.
.png)
Engee is a Russian platform for mathematical calculations and dynamic modeling
First section: text and formulas
Plain text with bold and italics and кодом inside the string.
Formulas are displayed in a simplified way:
As well as linear formulas:
A bit of code
In [ ]:
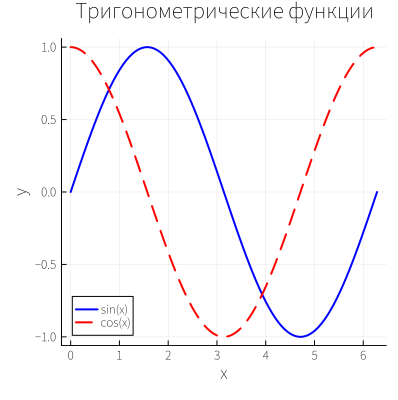
x = range(0, 2π, length=100)
plot(x, sin.(x), label="sin(x)", lw=2, c=:blue)
plot!(x, cos.(x), label="cos(x)", lw=2, c=:red, ls=:dash)
title!("Trigonometric functions")
xlabel!("x")
ylabel!("y")
Out[0]:
The second section: tables and code
In [ ]:
using DataFrames
df = DataFrame(
    Метод = ["Euler", "Runge Kutta 2", "Runge Kutta 4"],
    Accuracy = [1e-2, 1e-4, 1e-8],
    Time = [0.01, 0.05, 0.15]
)
print(df)
Another option for displaying tables
In [ ]:
using DataFrames
df = DataFrame(
    Метод = ["Euler", "Runge Kutta 2", "Runge Kutta 4"],
    Accuracy = [1e-2, 1e-4, 1e-8],
    Time = [0.01, 0.05, 0.15]
)
df
Out[0]:
Third section: two-column slides
Advantages of the method:
- High precision
- Fast convergence
- Sustainability
Disadvantages of the method:
- Complexity of implementation
- Memory requirements
- Sensitivity to noise
Fourth section: code only
In [ ]:
# A simple example of the algorithm
function bubble_sort!(a)
    n = length(a)
    for i in 1:n-1
        for j in 1:n-i
            if a[j] > a[j+1]
                a[j], a[j+1] = a[j+1], a[j]
            end
        end
    end
    return a
end

data = [5, 2, 8, 1, 9]
bubble_sort!(copy(data))
Out[0]:
The fifth section: the image with the code
In [ ]:
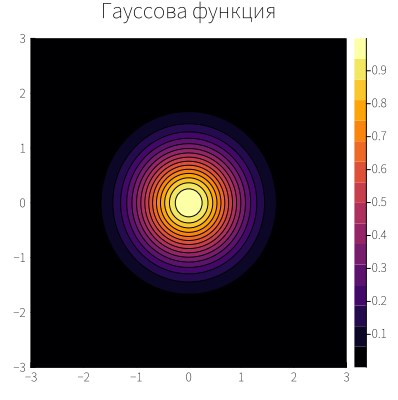
# On the left is the code for building a heat map, on the right is the graph itself.
# This is an example of how you can place the code and the result side by side.

x = range(-3, 3, length=100)
y = range(-3, 3, length=100)
f(x,y) = exp(-(x^2 + y^2))
contour(x, y, f, fill=true, title="The Gaussian function")
Out[0]:
Slide with the image in the center
In [ ]:
# CODE_SKIP
x = range(-3, 3, length=100)
y = range(-3, 3, length=100)
f(x,y) = exp(-(x^2 + y^2))
contour(x, y, f, fill=true, title="The Gaussian function")
Out[0]:
And the same goes for the text after the image.
In [ ]:
# CODE_SKIP
x = range(-3, 3, length=100)
y = range(-3, 3, length=100)
f(x,y) = exp(-(x^2 + y^2))
contour(x, y, f, fill=true, title="The Gaussian function")
Out[0]:
On the left is the code for building a heat map, on the right is the graph itself.
This is an example of how you can place the code and the result side by side.
Conclusion
The generator supports:
- Three-level headings
- Text with formatting
- LaTeX formulas (inline and display)
- Code cells with output
- Graphs with captions
- Tables with names
- Two-column slides
- Hiding the code (#CODE_SKIP)
- Skipping cells (#SKIP)
and many other designs!