Calculation of power grid modes
Calculation of power grid modes ![]() — This is an Engee application designed for calculating and analyzing steady-state modes of electric power systems.
— This is an Engee application designed for calculating and analyzing steady-state modes of electric power systems.
To open the application, go to the Engee workspace and in the upper-left corner in the section Engee Applications ![]() select Calculation of power grid modes
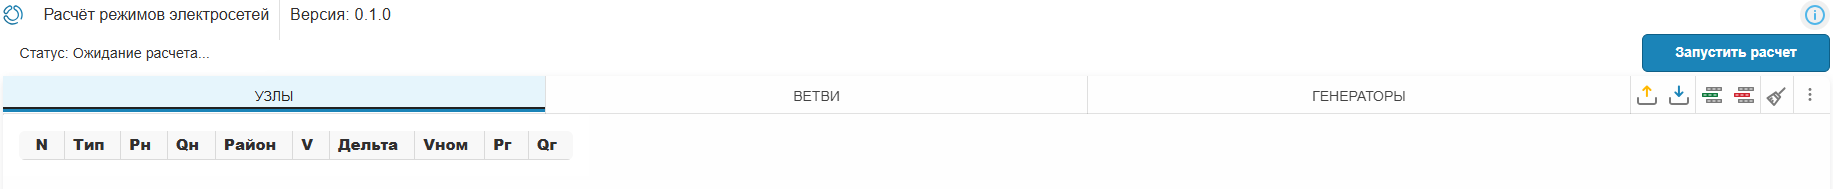
select Calculation of power grid modes ![]() . The application works in a separate browser tab and by default looks like this:
. The application works in a separate browser tab and by default looks like this:
Working with the app
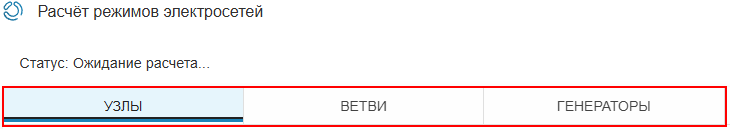
Three tabs with tables are used to work with the application.:
_ nOdes_
Nodes |
||
Column |
Units of measurement |
Explanation |
N |
- |
The node number must be unique |
Type |
- |
Node type (for more information, see Node type) |
Ph |
MW |
Active load in the node |
Qh |
Mvar |
Reactive load in the node |
Gw |
mkSm |
Active shunt conduction in the node |
Bw |
mkSm |
Reactive conduction of the shunt in the node (for more information, see Reactive conductivity of the shunt in the node and in the branch) |
District |
- |
District number |
V |
sq |
The voltage module in the node |
Delta |
Degrees |
Voltage angle at the node |
Vnumber |
sq |
Rated voltage in the node |
Vmax |
sq |
Maximum allowable voltage in the node |
Vmin |
sq |
Minimum allowable voltage in the node |
Pr |
MW |
Active generation capacity in the node |
Qr |
Mvar |
The power of reactive generation in the node |
Pw |
MW |
Active power released at the shunt in the node |
Qw |
Mvar |
Reactive power released at the shunt in the node |
Iinjection |
But |
Total generation and load current in the node |
_ Branches_
Branches |
||
Column |
Units of measurement |
Explanation |
N |
- |
The branch number must be unique |
Nstart |
- |
The number of the branch start node |
Ncon |
- |
Node number of the branch end |
R |
Om |
Active branch resistance |
X |
Om |
Reactivity of the branch |
G |
mkSm |
Active transverse branch conductivity |
B |
mkSm |
Reactive transverse conductivity of the branch (for more information, see Reactive conductivity of the shunt in the node and in the branch) |
Ct |
kV/kV |
The module of the transformation coefficient (for more information, see Transformation coefficient) |
Status |
- |
Enabled or disabled branch status |
Imax start |
But |
Permissible maximum branch start current |
Imax_con |
But |
Permissible maximum current of the branch end |
Istart |
But |
Estimated current of the beginning of the branch |
Icon |
But |
Estimated current of the branch end |
Pstart |
MW |
Estimated active capacity of the beginning of the branch |
Qstart |
Mvar |
Estimated reactive power of the beginning of the branch |
Pcon |
MW |
Estimated active capacity of the branch end |
Qcon |
Mvar |
Estimated reactive power of the branch end |
dP |
MW |
Loss of active power in the branch |
dQ |
Mvar |
Reactive power losses in the branch |
Pw |
MW |
Loss of active power in the branch shunt |
Qw |
Mvar |
Reactive power losses in the branch shunt |
Generators
Generators |
||
Column |
Units of measurement |
Explanation |
N |
- |
Generator number |
Nnodes |
- |
Number of the generator installation unit |
Type |
- |
The node type after calculating the mode (for more information, see Node type) |
Pr |
MW |
Setting the active power generation |
Qr |
Mvar |
Setting the reactive power generation (ignored if node type = "Gene") |
Qmax |
Mvar |
The maximum allowable value of reactive power generation |
Qmin |
Mvar |
Minimum allowable value of reactive power generation |
Vzd |
sq |
Preset voltage (ignored if node type = "Heat") |
Status |
- |
The on or off state of the generator |
Node type
-
"Nagr"— load mode (generation can be set via , ); -
"The Gene"— generator mode (generation is set via , ); -
The "Base"— balancing; -
"Gen+"— generator mode (generation is set via , ), and has reached the maximum limit for permissible reactive power; -
"The gene−"— generator mode (generation is set via , ), and has reached the minimum limit for permissible reactive power.
| The node type can only be set in the "Nodes" table, the column is not editable in the "Generators" table. |
Reactive conductivity of the shunt in the node and in the branch
The inductive conductivity is negative. The capacitive conductivity is positive.
Transformation coefficient
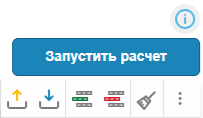
The following buttons are used to work with tables:
-
 Download file with mode — Downloads files from PC via File Browser
  . Available formats: Matpower (.m), HDF5 (.h5).
 -
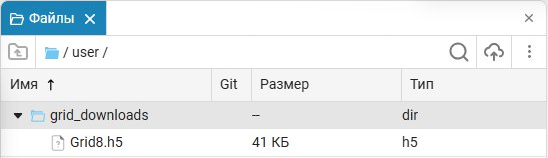
 Save Mode file — Saves the edited mode file in the application. File Browser . In the root folder
 /userthe grid_downloads folder is created, in which a file with the HDF5 format mode is saved, named Grid$number of nodes in the $.h5 model, for example Grid14.h5.It is recommended to rename the file so that it is not overwritten by the next save in the application. -
 Add Row — Adds a row to the end of the current table.
 -
 Delete Row — Deletes the active row from the current table. To make the line active, left-click on it.
 -
 Clear All — clears the contents of all tables.
 -
 Setting visible columns — shows/hides columns of the selected table. The displayed columns are highlighted in bold, while the hidden ones are in plain text.:
-
 — performs verification and verification of the entered data. Then performs the calculation of the mode and fills in the columns with the calculation results.
 -
 — link to this article in the documentation.
Power system model
The branches are modeled by a U-shaped substitution scheme:

The load can be modeled with a fixed power or a shunt. Generation can be modeled by a PV or PQ model.
An example of working with the application
In the application, you can set the initial schematic data in two ways:
-
Enter the data manually.
-
Upload data in the format
.h5or.m. The test 14-node scheme can be downloaded at link.- To enter the initial data according to the scheme, you must follow the following rules
-
-
Draw a diagram showing all the nodes and branches.
-
Number all nodes of the electrical network, including all intermediate nodes.
-
For example, an electric station can be represented by two nodes — generator voltage buses and buses behind a transformer.
-
The node in the program source data corresponds to the electrical busbars.
-
The node number must be a unique positive number, end-to-end numbering is not required.
-
For ease of orientation in the diagram, it is advisable to give similar numbers to nodes belonging to the same object (3, 13, 103, 1003, etc.).
-
The selected node numbers should be applied to the network diagram.
-
-
For each node, determine its rated voltage and apply it to the circuit.
-
Determine the active and reactive power consumption for each load node.
-
If the initial data is set by the active power and , then calculate the reactive power: .
-
-
If there are shunts to the ground in the node — batteries of static capacitors (BSC) or shunt reactors (SR) — determine their conductivity (in microsimences) and apply the following rule to the circuit:
-
The capacitive conductivity is positive.
-
The inductive conductivity is negative.
-
-
For power transmission lines:
-
Set a unique branch number.
-
Specify the beginning node and the end node of the branch.
-
Determine the longitudinal resistance and ground conductivity (the conductivity is set in microsimes, the capacitive character is reflected by a plus sign).
-
-
For transformers, define:
-
Resistance: brought to the high voltage side.
-
Conduction of the shunt to the ground: .
-
The transformation coefficient is equal to the ratio of the rated voltage of the end of the branch to the rated voltage of the beginning of the branch (it is assumed that the transformation coefficient is less than one). In order to obtain this, it is necessary to accept the highest voltage node as the initial node of the transformer branch.
-
-
Autotransformers and three-winding transformers are represented according to the "star" scheme with an intermediate node and three branches, two of which have transformation coefficients.
-
Determine the number of the balancing node from those with generation and its voltage module.
-
For nodes with synchronous machines (generators, compensators):
-
In the Nodes tab, set the Gen type.
-
In the Generators tab, set:
-
The unique number of the generator.
-
The number of the node where it is installed.
-
Active generation capacity.
-
Limits of reactive power regulation ( ).
-
A preset (fixed) voltage modulus (Vdc).
-
-
-
The specifics of setting the initial data for such nodes are explained by the action of the excitation regulators of synchronous machines (SEE). Typically, the SM maintains the voltage modulus on the high-voltage busbars (behind the transformer) or on the generator voltage buses unchanged by regulating the reactive power output by the SM.
During the calculation of the mode, the reactive power is monitored, and in case of violation of one of the specified limits:
-
The reactive power is fixed at its value.
-
The voltage module is released.
You can also specify a generator with a fixed reactive power generation. For this:
-
In the Nodes tab, you need to set the Heat type.
-
In the Generators tab, set the parameters: Rg, Qg.
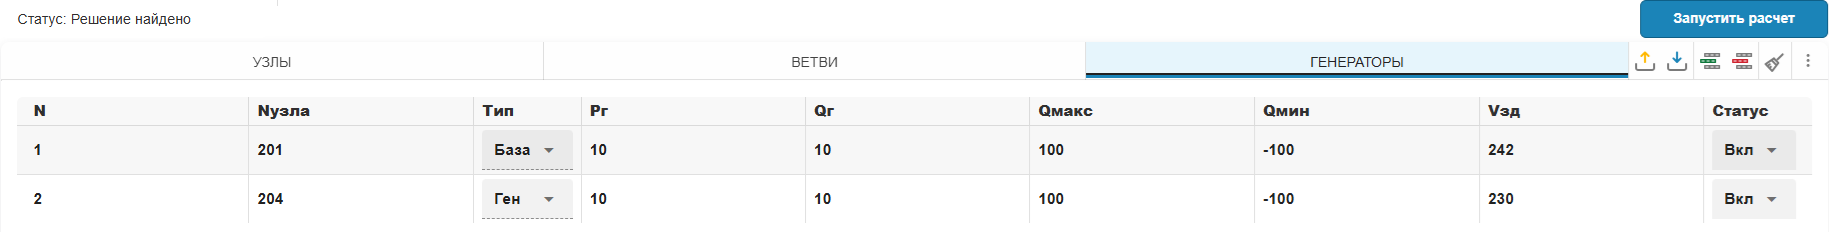
An example of the prepared scheme is given below. In it:
-
Knot
201— balancing. -
Nodes
201and204they represent power plants. -
The loads in the nodes are set.
-
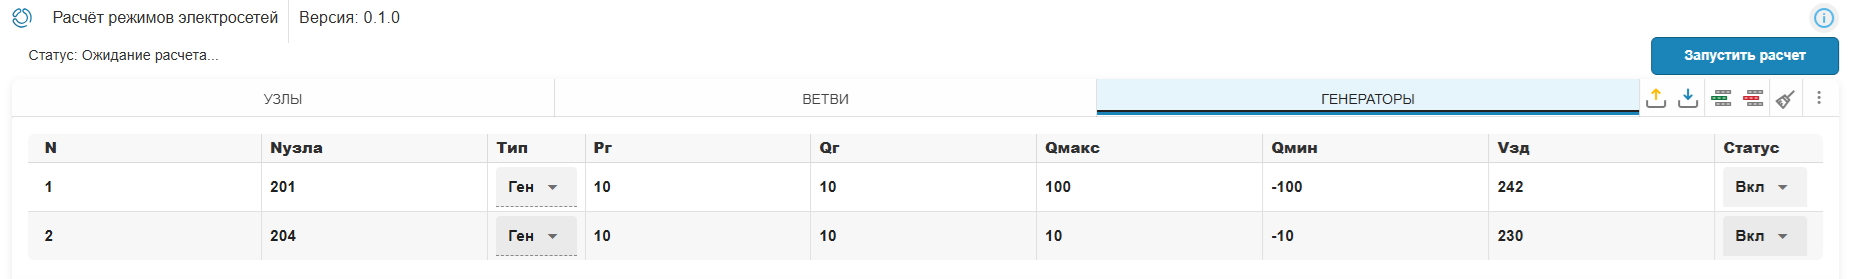
The generator in the node
204generates10 MW.

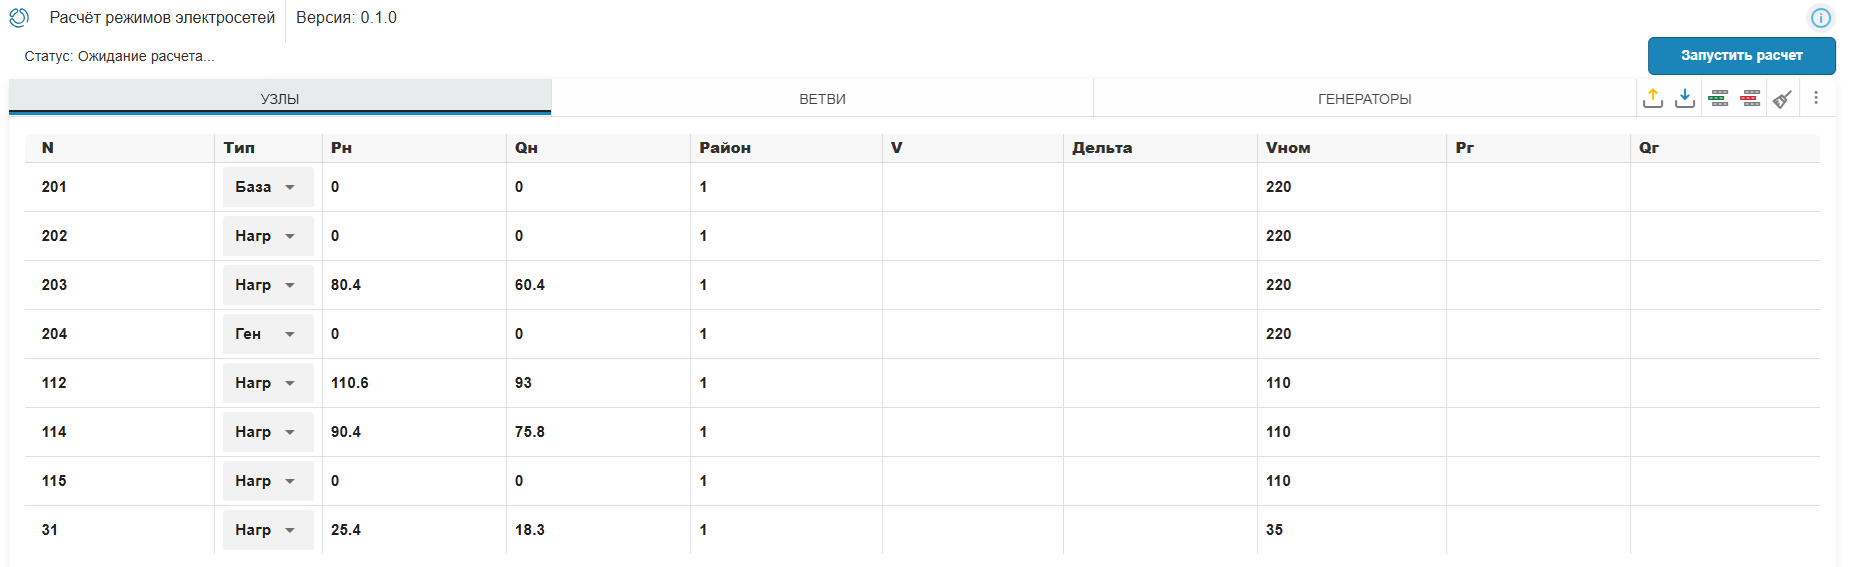
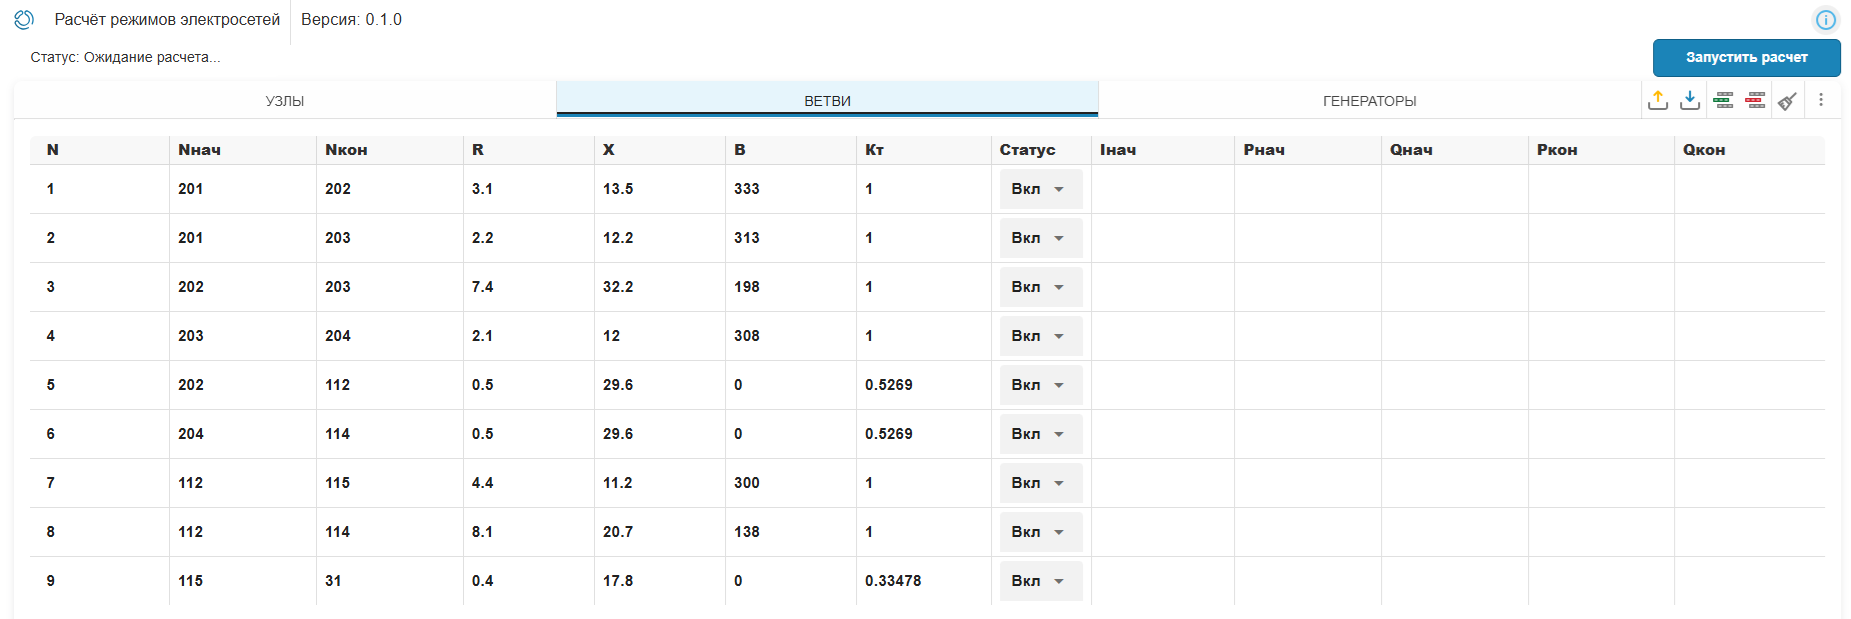
Fill in the tables to prepare for the calculations as follows:
For the node table:
For the branch table:
For the generator table:
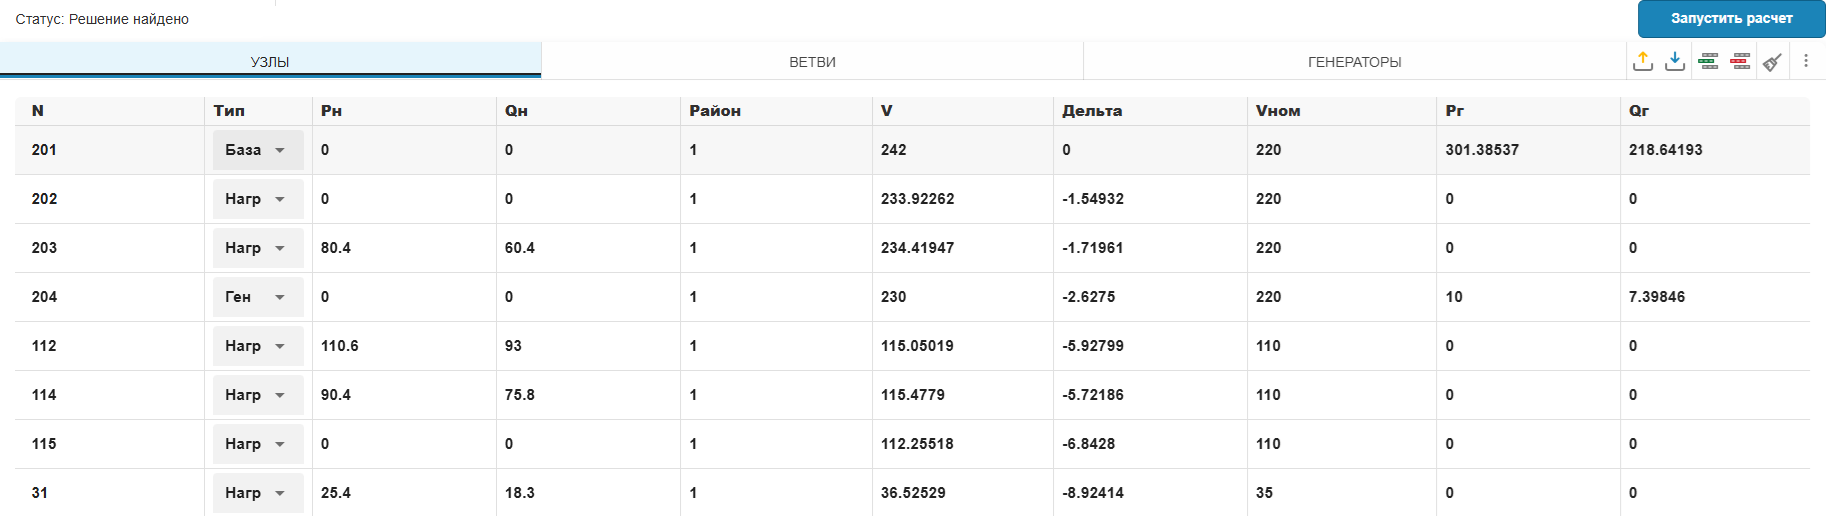
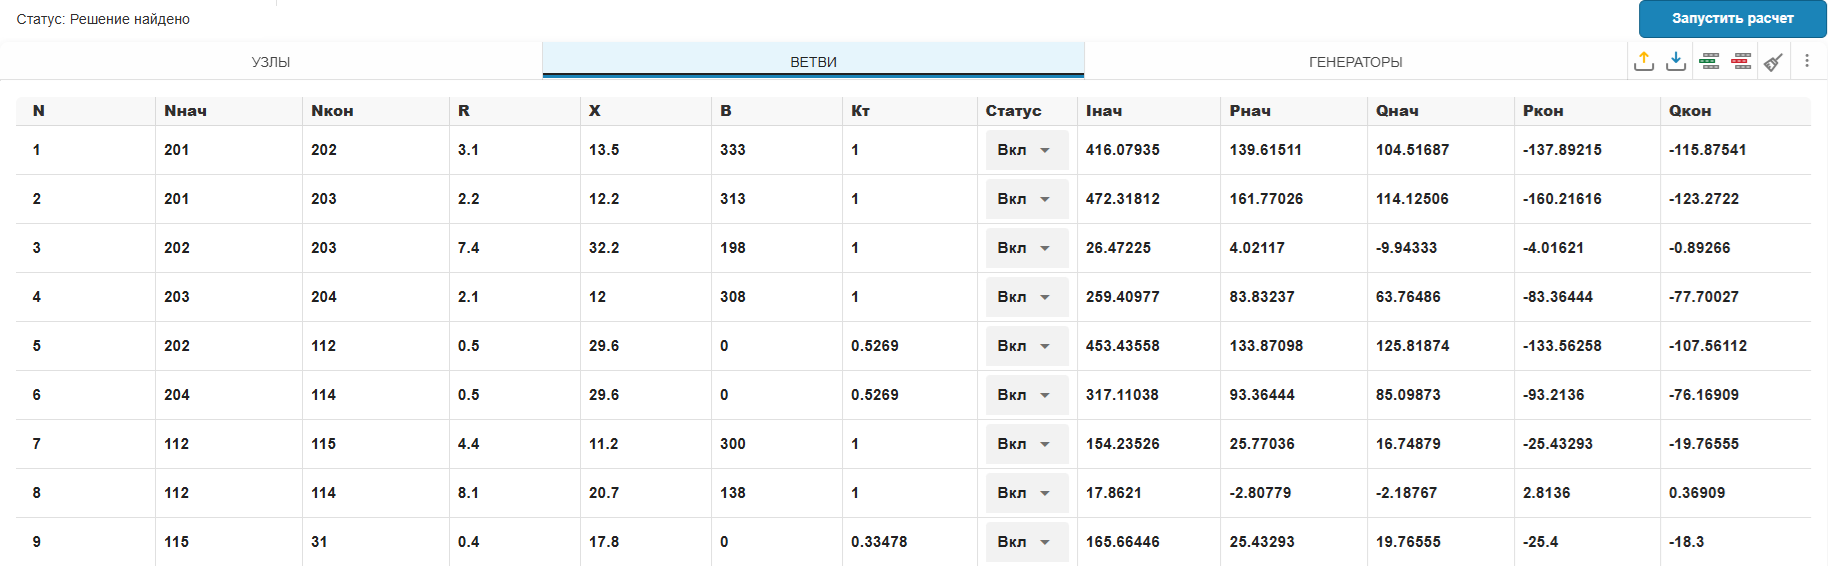
As a result, the calculation will be obtained:
For the node table:
For the branch table:
For the generator table:
The calculation results are plotted on the diagram:

Next, save the calculation results using the button Save the file with the mode.
A directory with the saved mode file has appeared in the Engee file browser:
In order to upload this file to the Calculation of Power Grid Modes application again, download it to your PC and download it again via the button Upload a file with the mode.