A system of redundant sensors
In this demo example, let's look at how to create a model of a duplicate sensor system using the Chart block of the finite state machine library.
Redundant sensors increase the reliability of the system due to redundancy: if one sensor fails, it is replaced by others, which is critical in aviation, industry and robotics. Modeling of such a system makes it possible to analyze fault tolerance, optimize data processing algorithms, and determine the minimum required number of sensors for stable operation. The use of redundant sensors reduces the risk of accidents and improves measurement accuracy in critical systems.
Description of the model
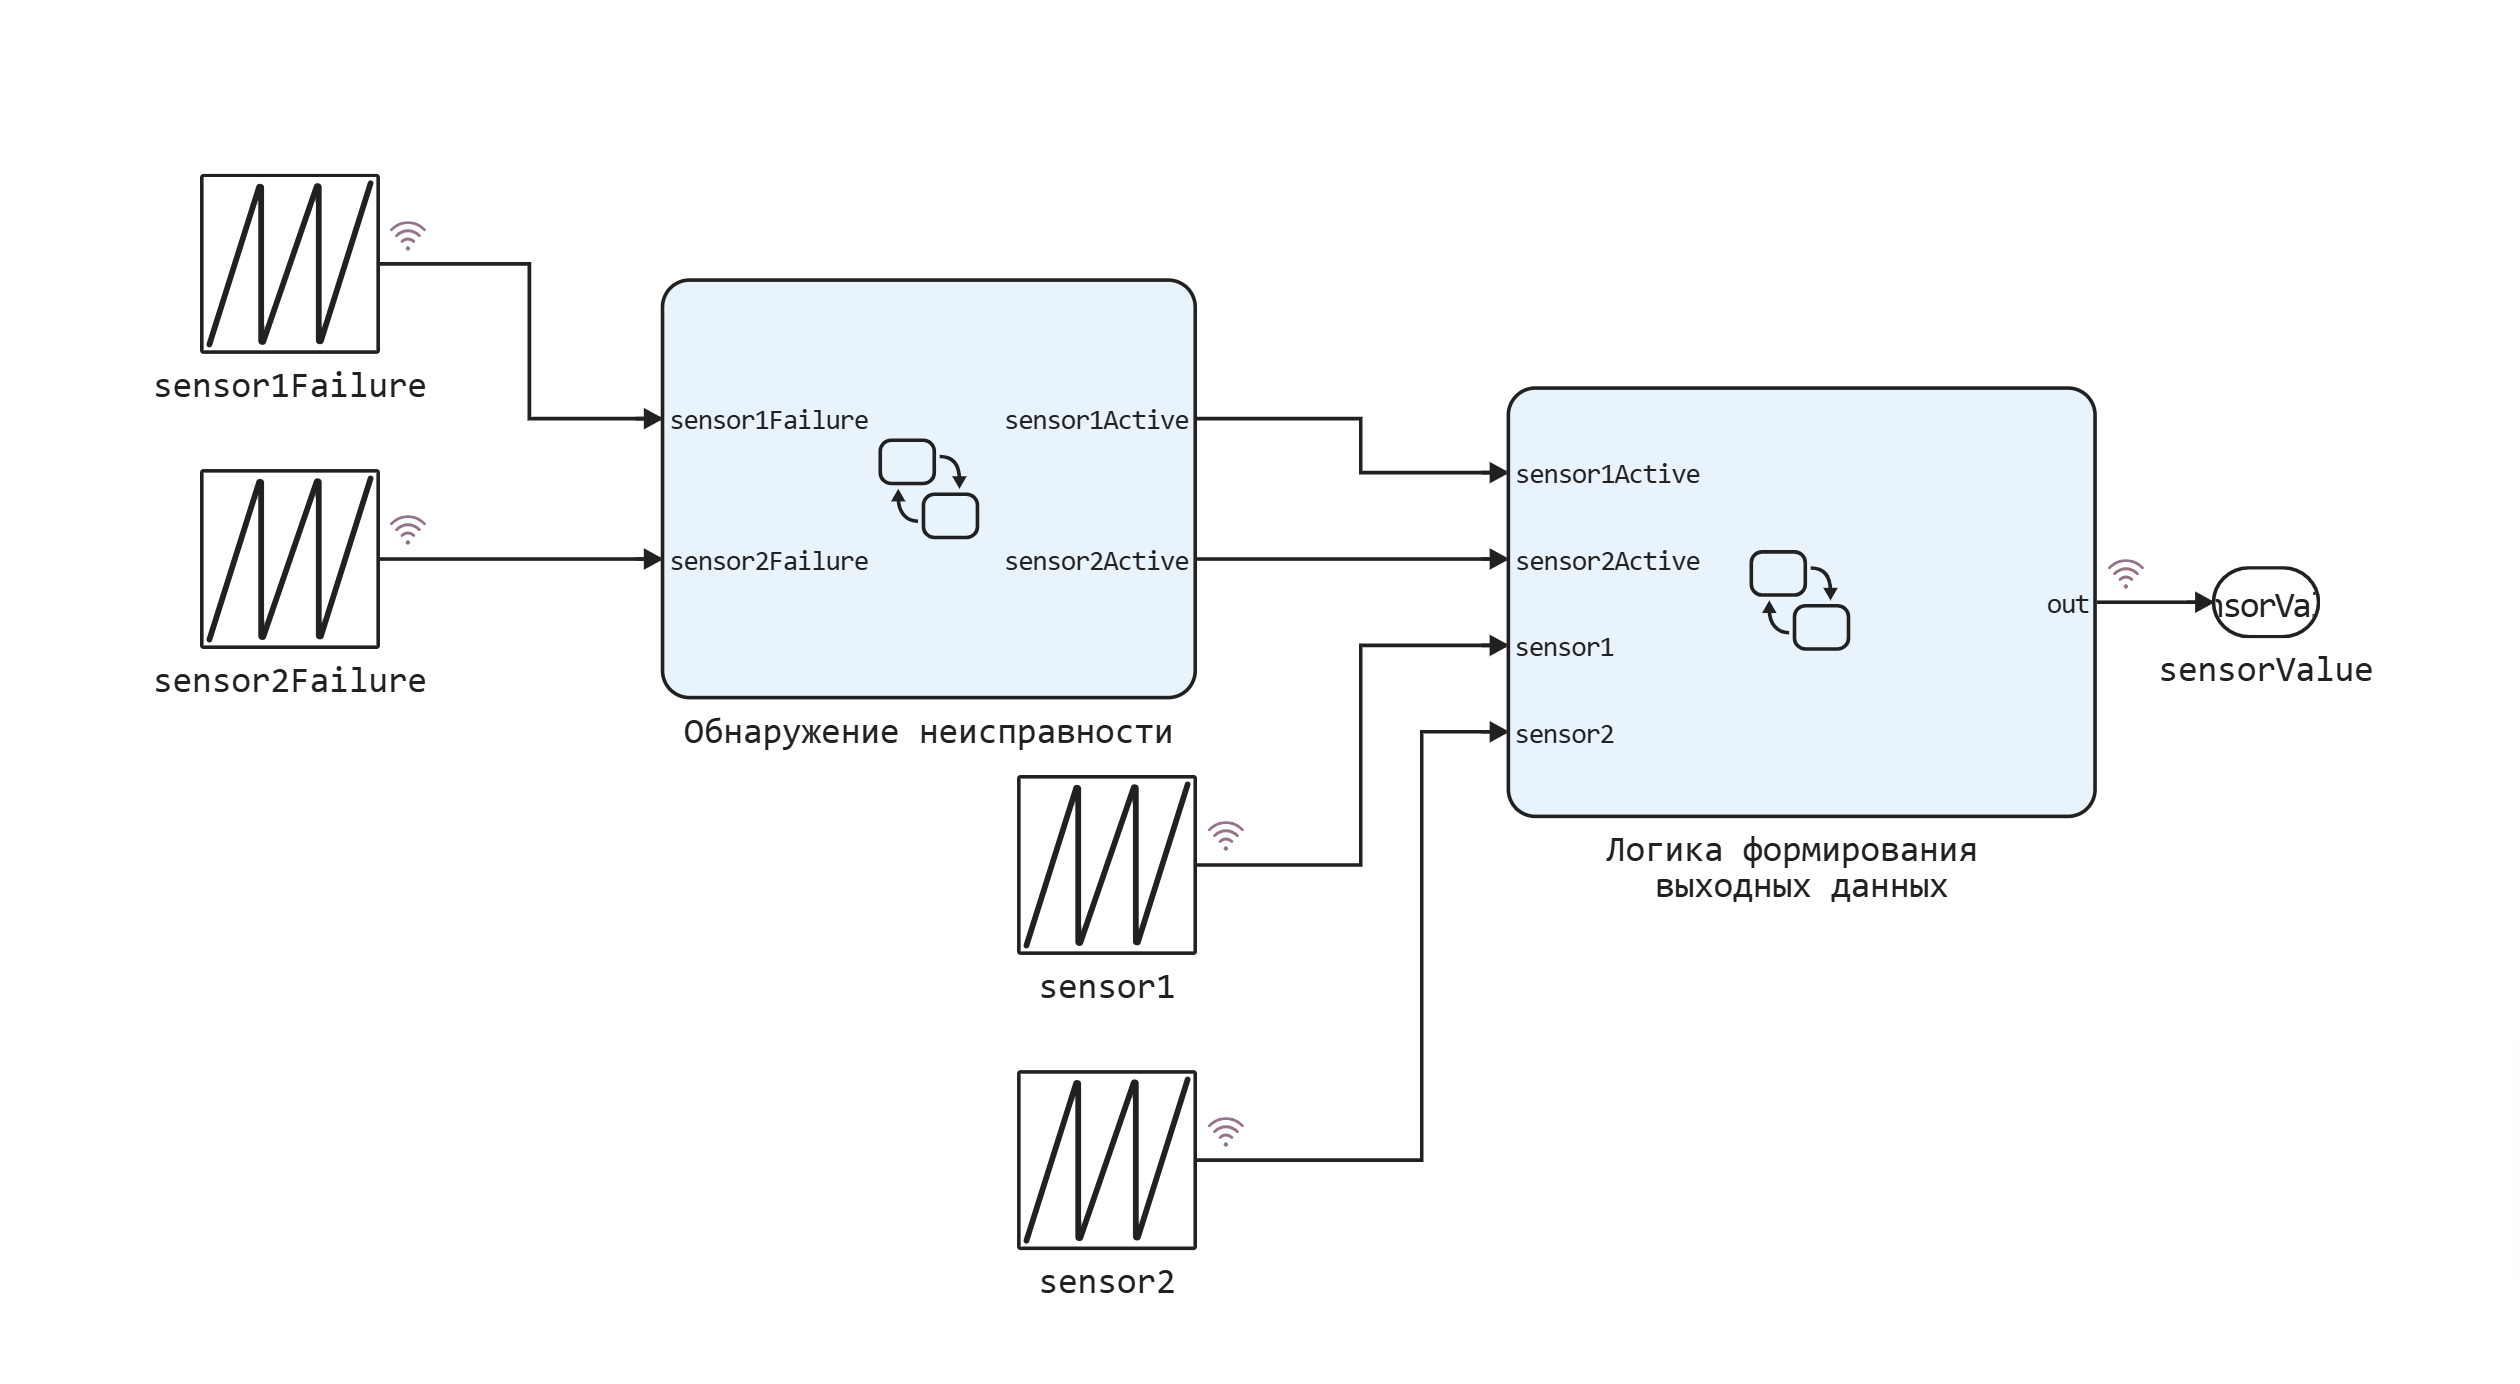
The model contains two Chart blocks that simulate sensor fault detection and the logic of generating output data from sensors. The input signals are: sensor data and fault signals.
Fault detection
The sensors are modeled using two parallel states in the Chart block.
Let's analyze the fault detection algorithm using the example of sensor No. 1. By default, the sensor is active. However, if the input signal is sensor1Failure If it is greater than 0, the sensor becomes inactive. Sensor No. 1 remains inactive for 5 simulation steps. But at each step, the input signal is tested. sensor1Failure. If the signal is still zero, the 5-step countdown will start again. During this time period, the output data is generated only from the data received from sensor No. 2, if it is active.
The logic of forming the actual output signal
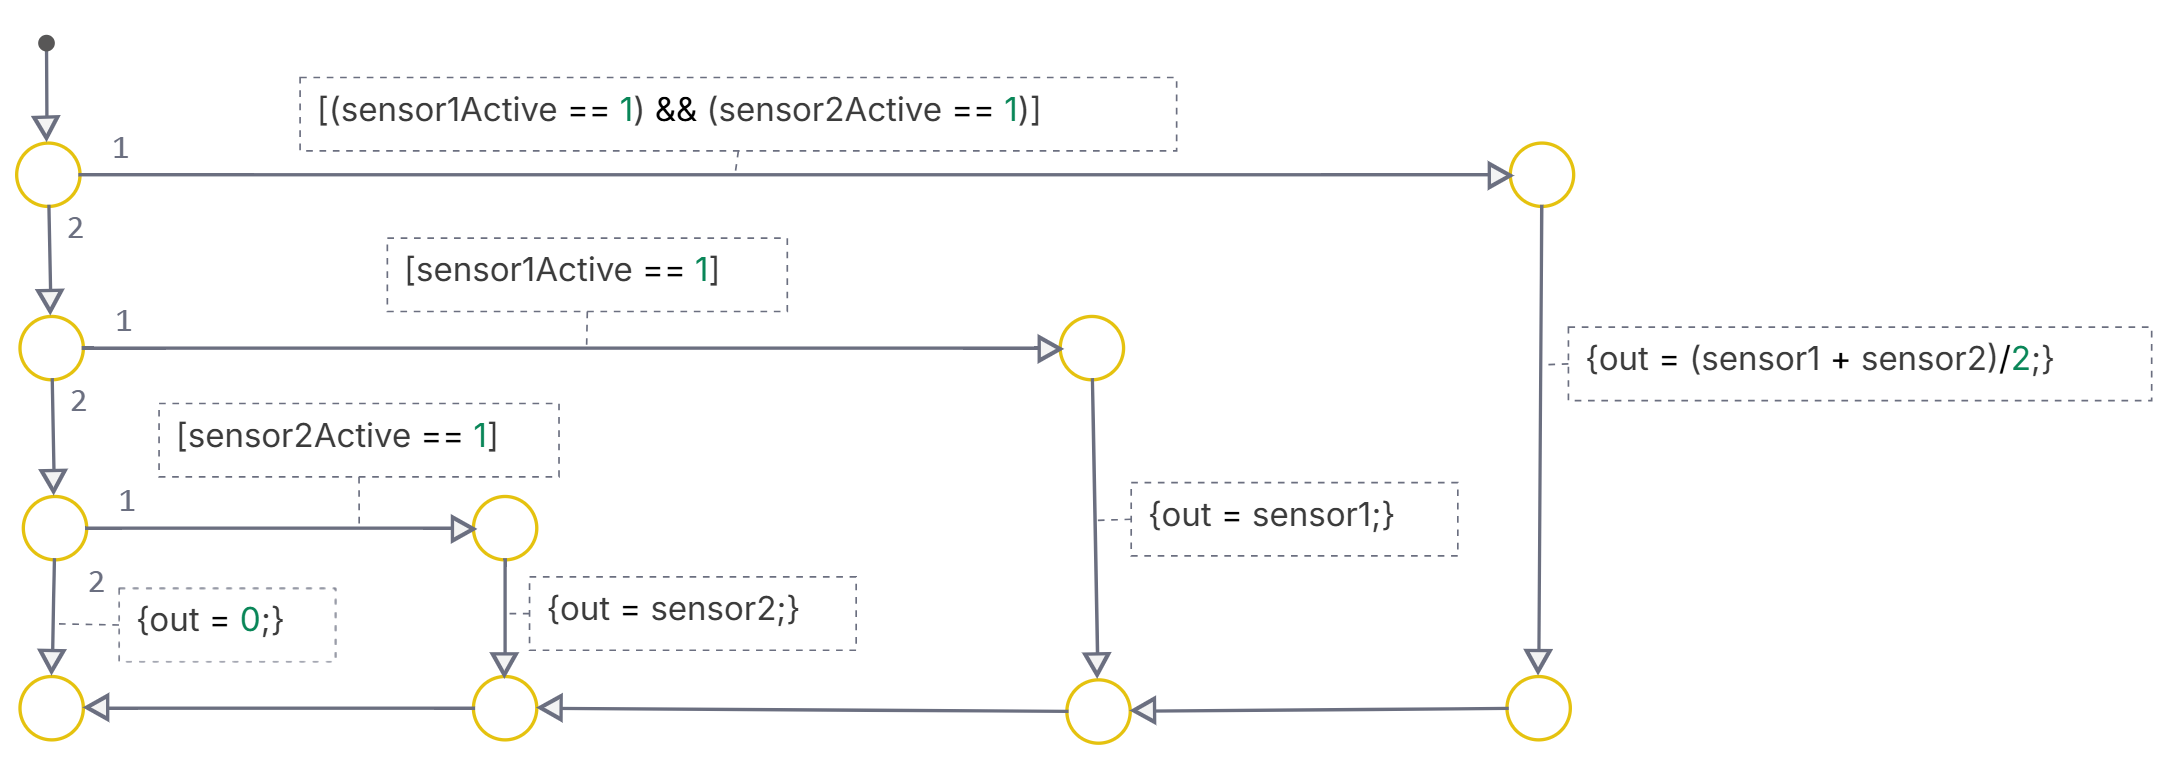
The output signal is generated using a transition graph. And it is determined using the following logic.
The actual value of the output signal is obtained by averaging the two sensor signals in order to reduce measurement noise. If both sensors are active, the output is the average value of the sum of sensor1 and sensor2. If one of the sensors is not active, that is, data from it is not being sent, data from the second sensor is being sent to the output. If both sensors are inactive, the output will be 0.
.png)
Simulation of the model
Run the script with the system parameters definition.
engee.script.run("/user/start/examples/state_machines/dual_sensors/_set_params.ngscript");
function start_model_engee()
    try
        engee.close("dual_sensors", force=true) # closing the model
        catch err # if there is no model to close and engee.close() is not executed, it will be loaded after catch.
            m = engee.load("$(@__DIR__)/dual_sensors.engee") # loading the model
        end;

    try
        engee.run(m) # launching the model
        catch err # if the model is not loaded and engee.run() is not executed, the bottom two lines after catch will be executed.
            m = engee.load("$(@__DIR__)/dual_sensors.engee") # loading the model
            engee.run(m) # launching the model
        end
end
Download and run the model to get the modeling data from the variable simout.
start_model_engee();
result = collect( simout )
Plot the data graphs from sensor No. 1 and sensor No. 2.
plot(
    plot(result[3].time, result[3].value, lab = "Data from sensor No. 1"),
    plot(result[4].time, result[4].value, lab = "Data from sensor No. 2", c = "red"),
    layout = (1,2)
)
We will display signals about sensor failures.
plot(result[2].time, [result[2].value result[1].value], lab = ["Sensor failure No. 1" "Sensor failure No. 2"])
The resulting measurement signal of the two sensors.
plot(result[5].time, result[5].value, lab = "Sensor data")
Conclusion
As a result, we got a graph of the measurement of a certain signal. Individual signals from the first and second sensors have missing values due to sensor failures. The resulting value of the measured signal has one zero value for about 7 seconds. This is due to the fact that both sensors were inactive at this point in time.