Modeling Lissajous figures using the Genie app
Introduction
Lissajous figures represent closed trajectories that occur when two mutually perpendicular harmonic waves are added together. They were first described by the French physicist Jules Antoine Lissajous in 1855 during experiments on wave processes.
Mathematically, these curves are described by parametric equations:
where and — frequencies, — phase shift, and — amplitudes. In our example .
The shape configuration is determined by the frequency ratio and the phase difference . With a rational frequency ratio, the trajectory turns out to be closed, taking on a characteristic shape — from a straight line segment and an ellipse to complex multi-lobed structures. This property is used in measuring technology to compare the frequencies and phase shifts of electrical signals.
The presented application implements a computational model of a two-channel oscilloscope connected to two harmonic signal generators. By changing the parameters a, b and φ through interactive sliders, you can observe the transformation of the resulting curve in real time, which allows you to trace the analytical dependence of the shape of the trajectory on the input parameters of the signals.
The application script
Consider the application script lissajous.jl.
using GenieFramework, Stipple, PlotlyBase
@genietools
@app begin
    @in a = 1.0
    @in b = 1.0
    @in φ = 0.0
    @out график = PlotlyBase.Plot(PlotlyBase.scatter(x=[0], y=[0], line=PlotlyBase.attr(color="blue")))
    @out layout = PlotlyBase.Layout(
        title = "Фигуры Лиссажу",
        xaxis = PlotlyBase.attr(title="x", showgrid=true),
        yaxis = PlotlyBase.attr(title="y", showgrid=true),
        width = 800,
        height = 550)
    @onchange a, b, φ begin
        t = collect(-100.0:0.01:100.0)
        new_plot = PlotlyBase.Plot(PlotlyBase.scatter(
            x = sin.(a[] * t .+ φ[]),
            y = sin.(b[] * t),
            line = PlotlyBase.attr(color="blue", width=2),
            mode = "lines",
            name = "Фигуры Лиссажу"))
        график = new_plot
    end
end

function ui()
    row([
        column([
            h6("x = sin({{a}}t + {{φ}})", style="margin-bottom: -10px"),
            slider(0.0:0.1:9, :a, color="purple", style="margin-bottom: 20px; width: 100%;"),
            h6("y = sin({{b}}t)", style="margin-bottom: -10px"),
            slider(0.0:0.1:9, :b, color="orange", style="margin-bottom: 20px; width: 100%;"),
            h6("φ = {{φ}}", style="margin-bottom: -10px"),
            slider(-2π:0.01:2π, :φ, color="green", style="margin-bottom: 20px; width: 100%;"),
        ], style="width: 30%; padding: 20px;"),
        column([
            plotly(:график, layout=:layout)
        ], style="width: 70%; padding: 20px; background-color: #f9f9f9; border-radius: 10px;")
    ])
end
@page("/", ui)
Launching the app
Let's launch the application right inside this interactive script.
genie_app = engee.genie.start("$(@__DIR__)/lissajous.jl")
display(MIME("text/html"), """<iframe src="$(string(genie_app.url))" width="1280" height="800" style="border: none;"></iframe>""";)
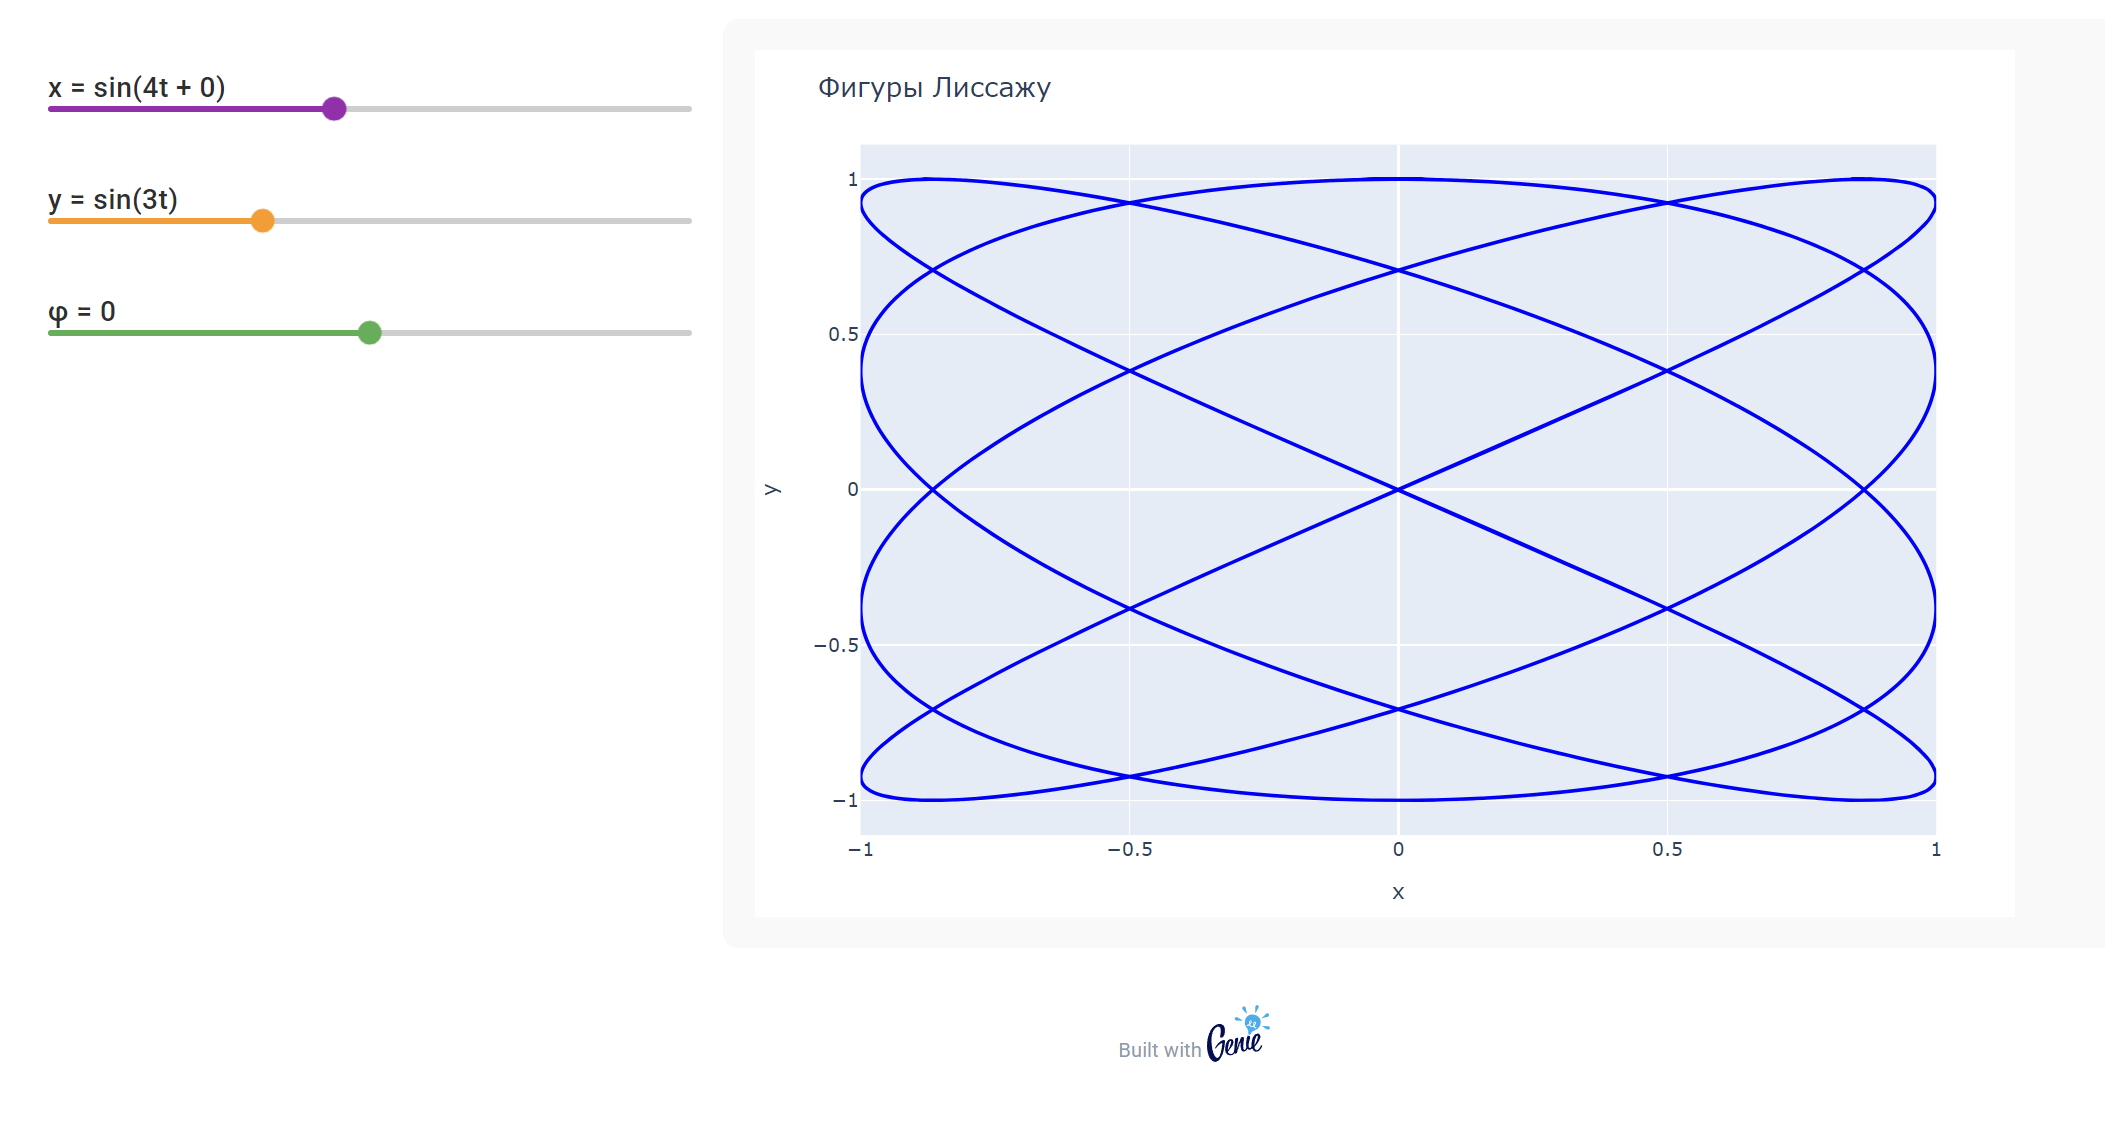
This application is a digital model of two signal generators and an oscilloscope. By moving the sliders, you control the parameters of the input signals.:
- The frequency of the signal applied to input X (horizontal scan).
- The frequency of the signal applied to input Y (vertical scan).
- Phase shift between these signals.
Watch as the change in the ratio of frequencies and phase difference instantly transforms the image on the screen — from a simple line and circle to intricate closed curves.
For convenience, you can open the application in a new tab.
display("text/html", """<a href="$(string(genie_app.url))" target="_blank">Open in a new tab</a>""")
After completing the work with the application, we will close it.
engee.genie.stop("$(@__DIR__)/lissajous.jl");
Conclusion
This application is a digital twin of a laboratory setup with two signal generators and an oscilloscope. Virtual laboratory work of this type is accessible from anywhere in the world, does not require physical equipment and provides instant visualization of results. By simulating frequencies and phase shifts, the user experimentally studies the dependence of the shape of Lissajous figures on signal parameters. The application can serve as a textbook on radiophysics and electrical engineering, it will also be useful for studying frequency comparison methods, and the combination of Engee and Genie opens up opportunities for creating interactive educational materials that complement the traditional laboratory base.