[医]条形图
|
该页面正在翻译中。 |
#
<无翻译>*麦琪[医]条形图*-Function
barplot(positions, heights; kwargs...)绘制条形图。
绘图类型
绘图类型别名 [医]条形图 功能是 [医]条形图.
例子:
using CairoMakie
f = Figure()
Axis(f[1, 1])

xs = 1:0.2:10
ys = 0.5 .* sin.(xs)

barplot!(xs, ys, color = :red, strokecolor = :black, strokewidth = 1)
barplot!(xs, ys .- 1, fillto = -1, color = xs, strokecolor = :black, strokewidth = 1)

f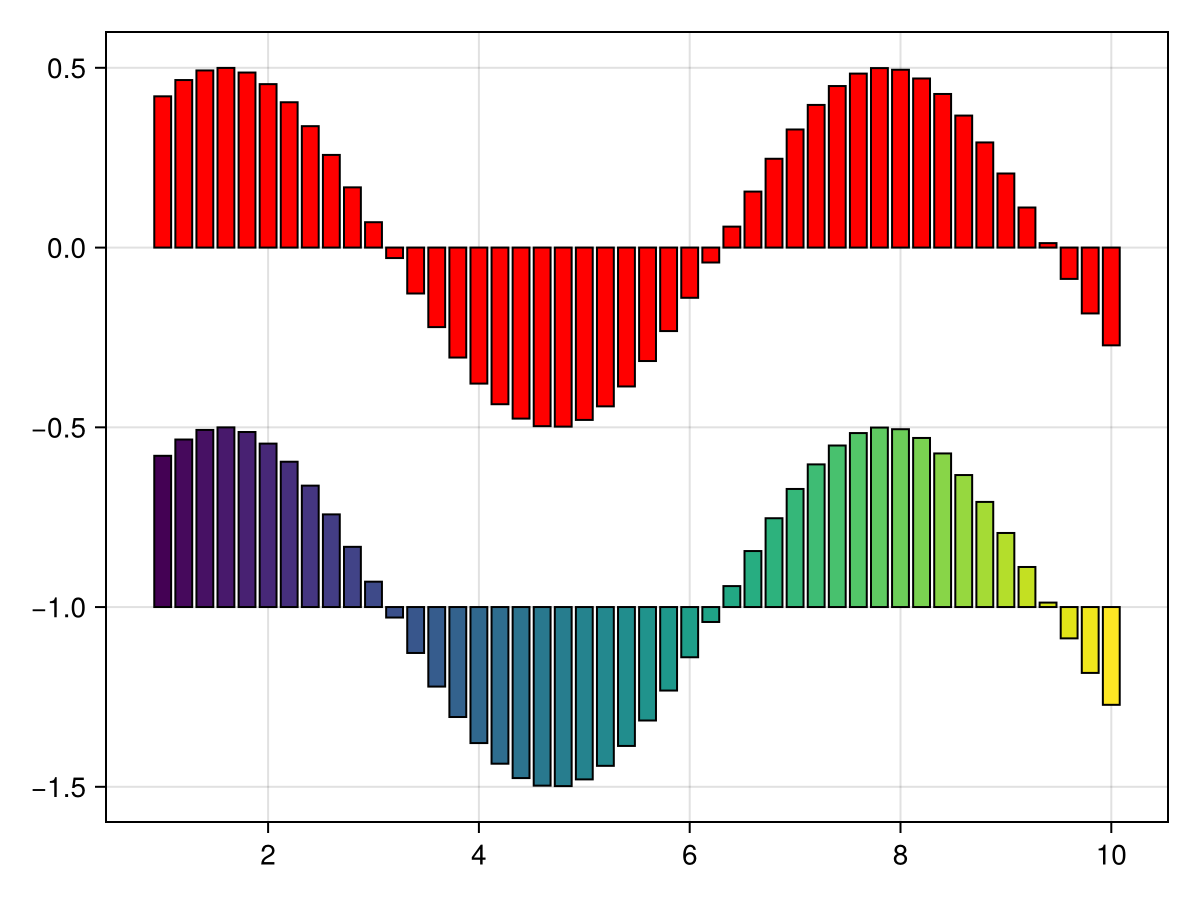
using CairoMakie
xs = 1:0.2:10
ys = 0.5 .* sin.(xs)

barplot(xs, ys, gap = 0, color = :gray85, strokecolor = :black, strokewidth = 1)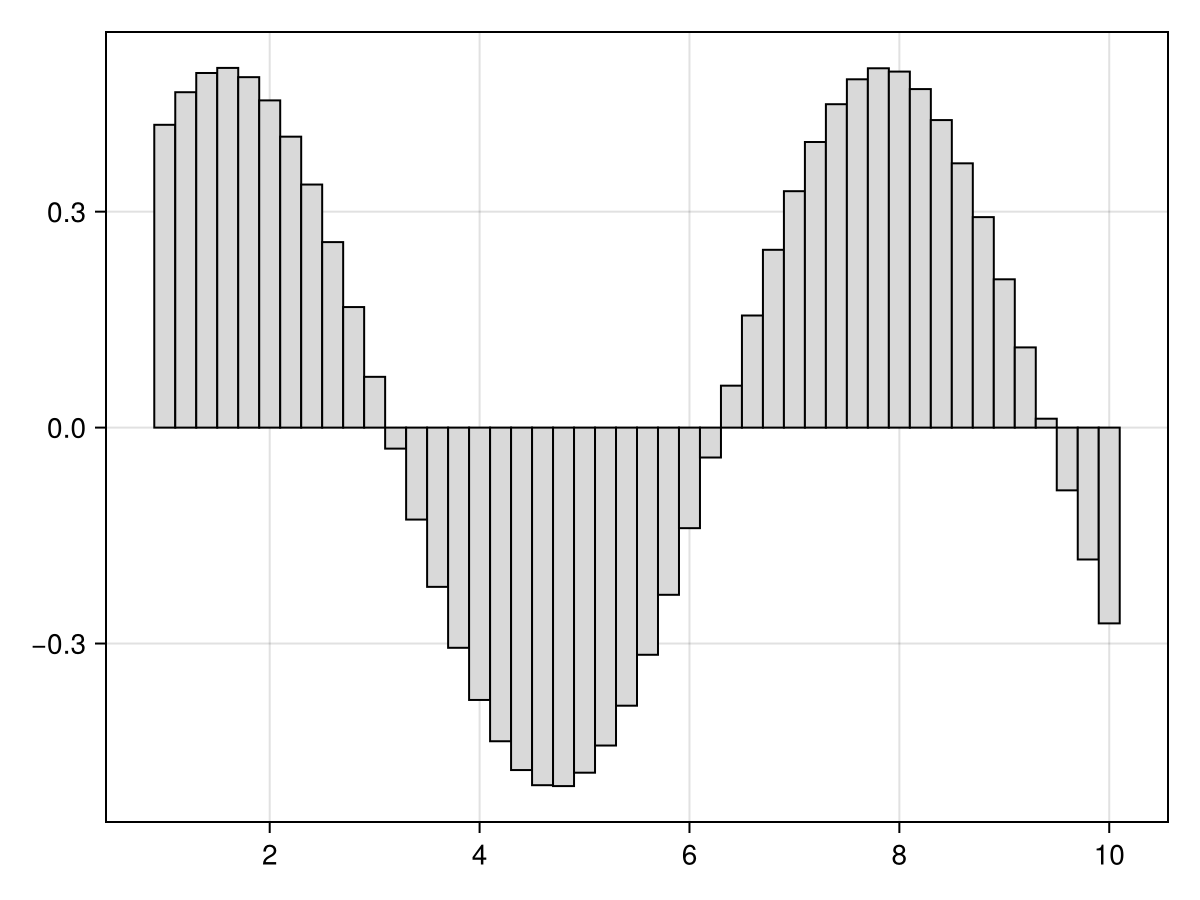
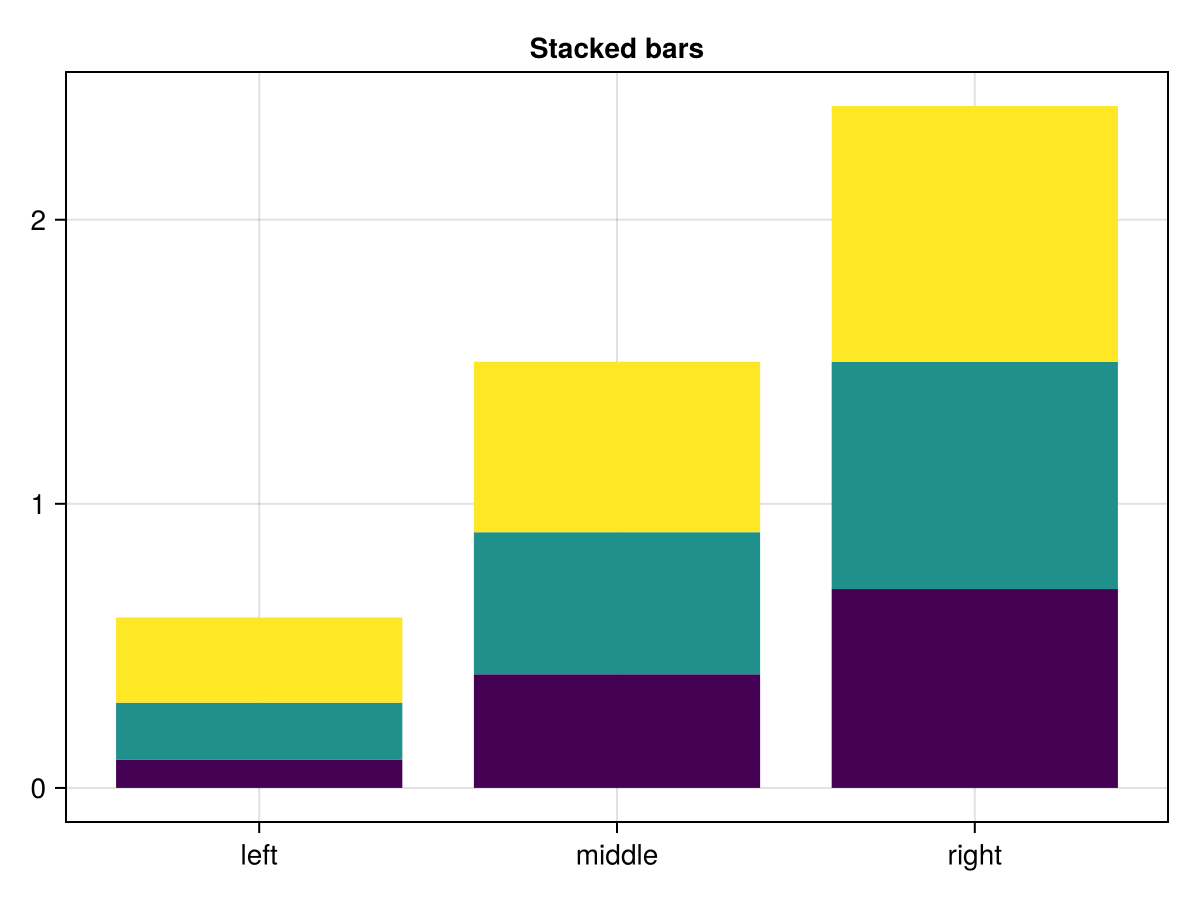
using CairoMakie
tbl = (cat = [1, 1, 1, 2, 2, 2, 3, 3, 3],
       height = 0.1:0.1:0.9,
       grp = [1, 2, 3, 1, 2, 3, 1, 2, 3],
       grp1 = [1, 2, 2, 1, 1, 2, 1, 1, 2],
       grp2 = [1, 1, 2, 1, 2, 1, 1, 2, 1]
       )

barplot(tbl.cat, tbl.height,
        stack = tbl.grp,
        color = tbl.grp,
        axis = (xticks = (1:3, ["left", "middle", "right"]),
                title = "Stacked bars"),
        )
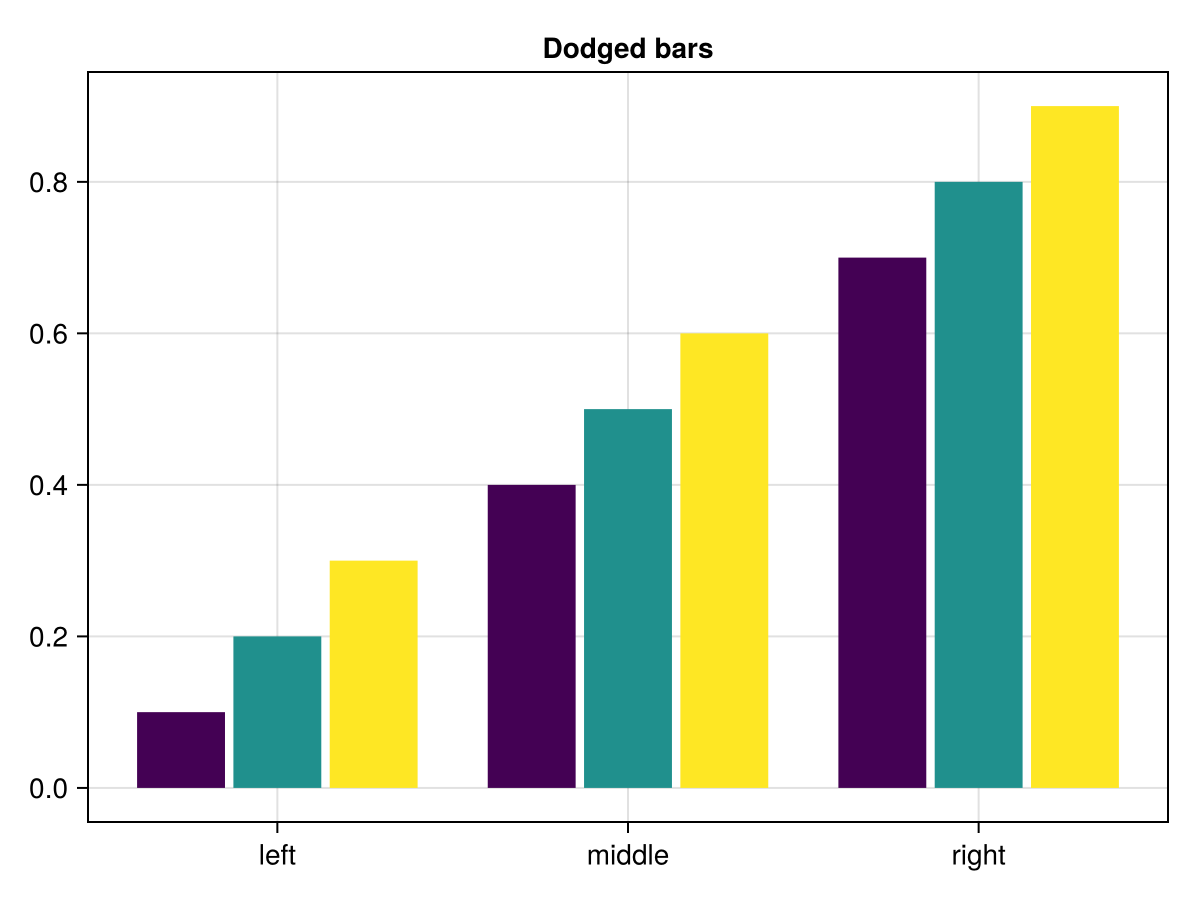
barplot(tbl.cat, tbl.height,
        dodge = tbl.grp,
        color = tbl.grp,
        axis = (xticks = (1:3, ["left", "middle", "right"]),
                title = "Dodged bars"),
        )
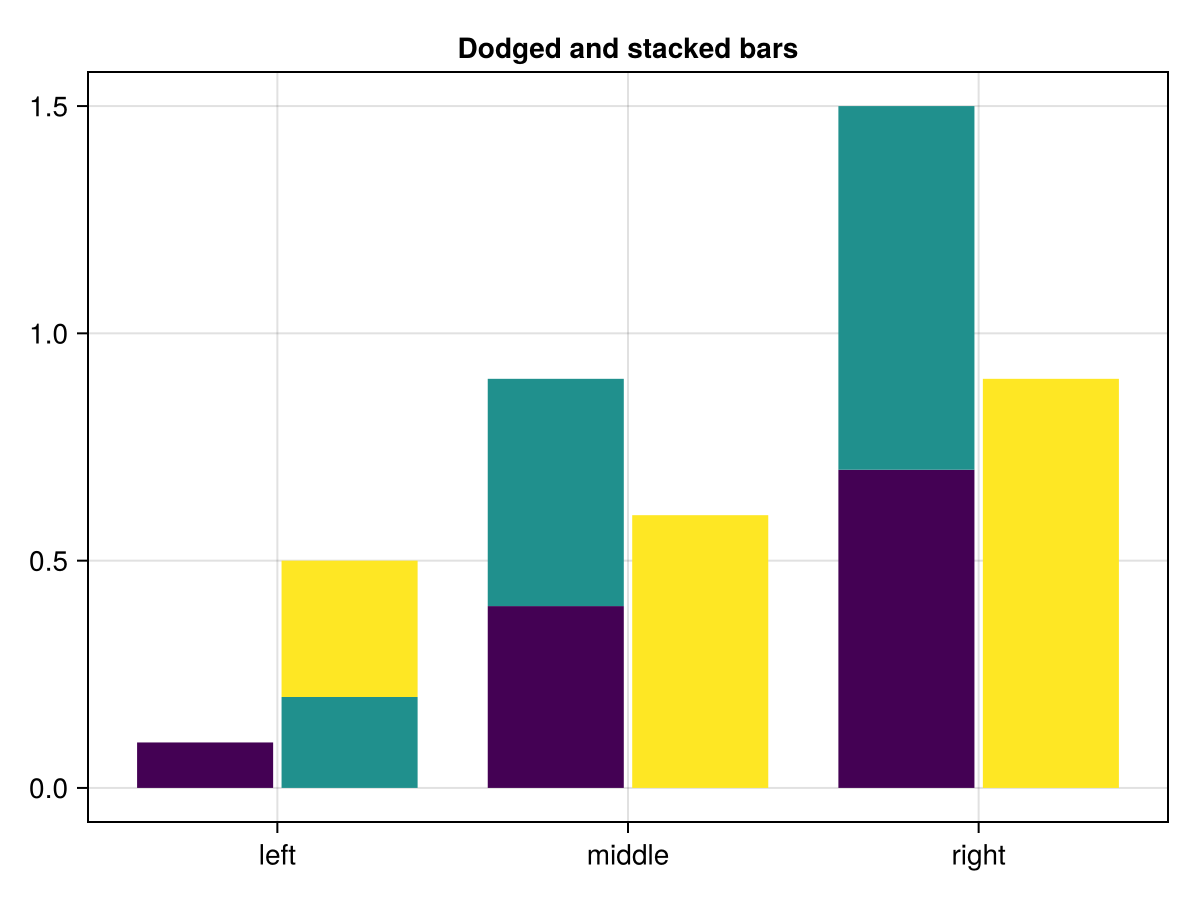
barplot(tbl.cat, tbl.height,
        dodge = tbl.grp1,
        stack = tbl.grp2,
        color = tbl.grp,
        axis = (xticks = (1:3, ["left", "middle", "right"]),
                title = "Dodged and stacked bars"),
        )
colors = Makie.wong_colors()

#图和轴
图=图()
ax=Axis(图[1,1],xticks=(1:3,["左","中","右"]),
        标题="躲避酒吧与传奇")

#剧情
巴普洛!(斧,tbl.cat,tbl。身高,
        道奇=tbl。grp,
        颜色=颜色[tbl。grp])

#传奇
标签=["第1组"、"第2组"、"第3组"]
elements=[PolyElement(polycolor=colors[i])for i in1:length(labels)]
标题="组"

图例(图[1,2],元素,标签,标题)

无花果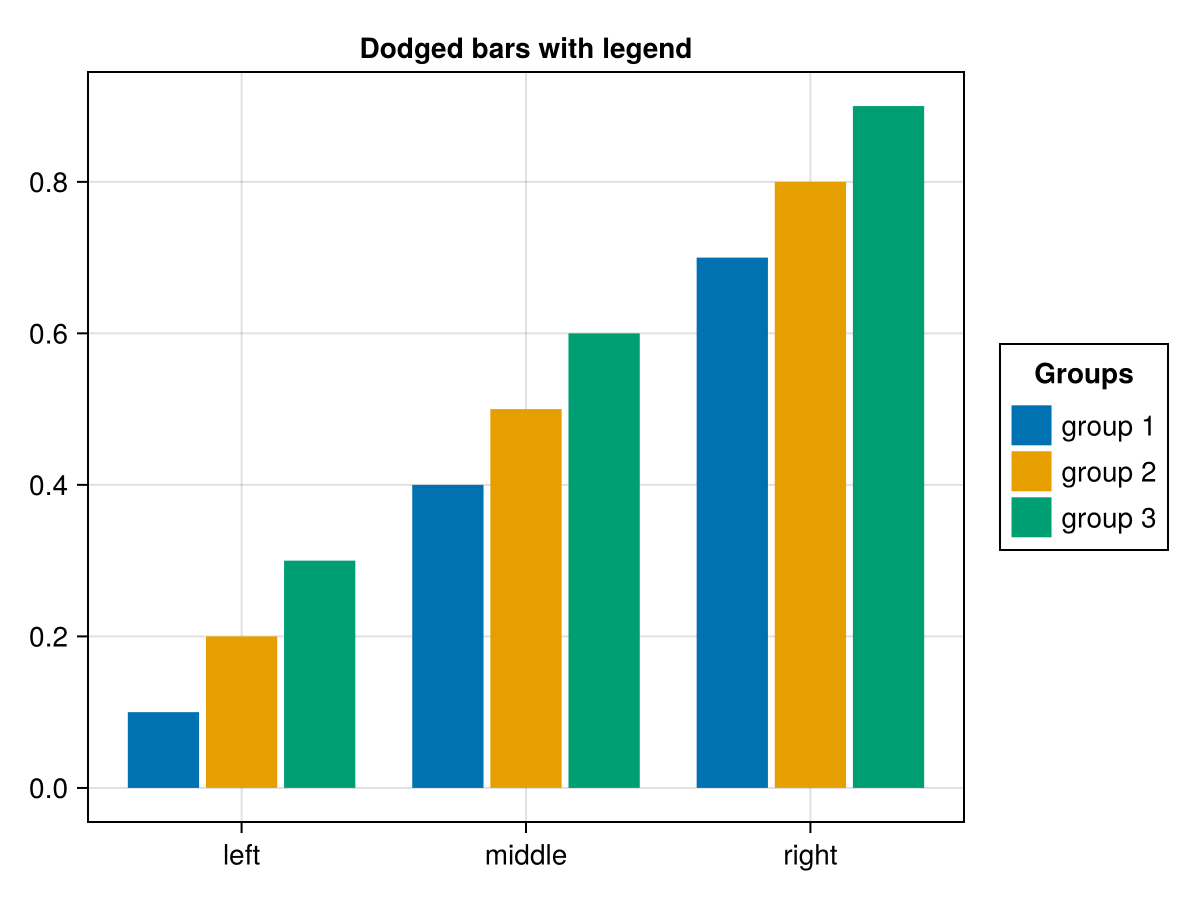
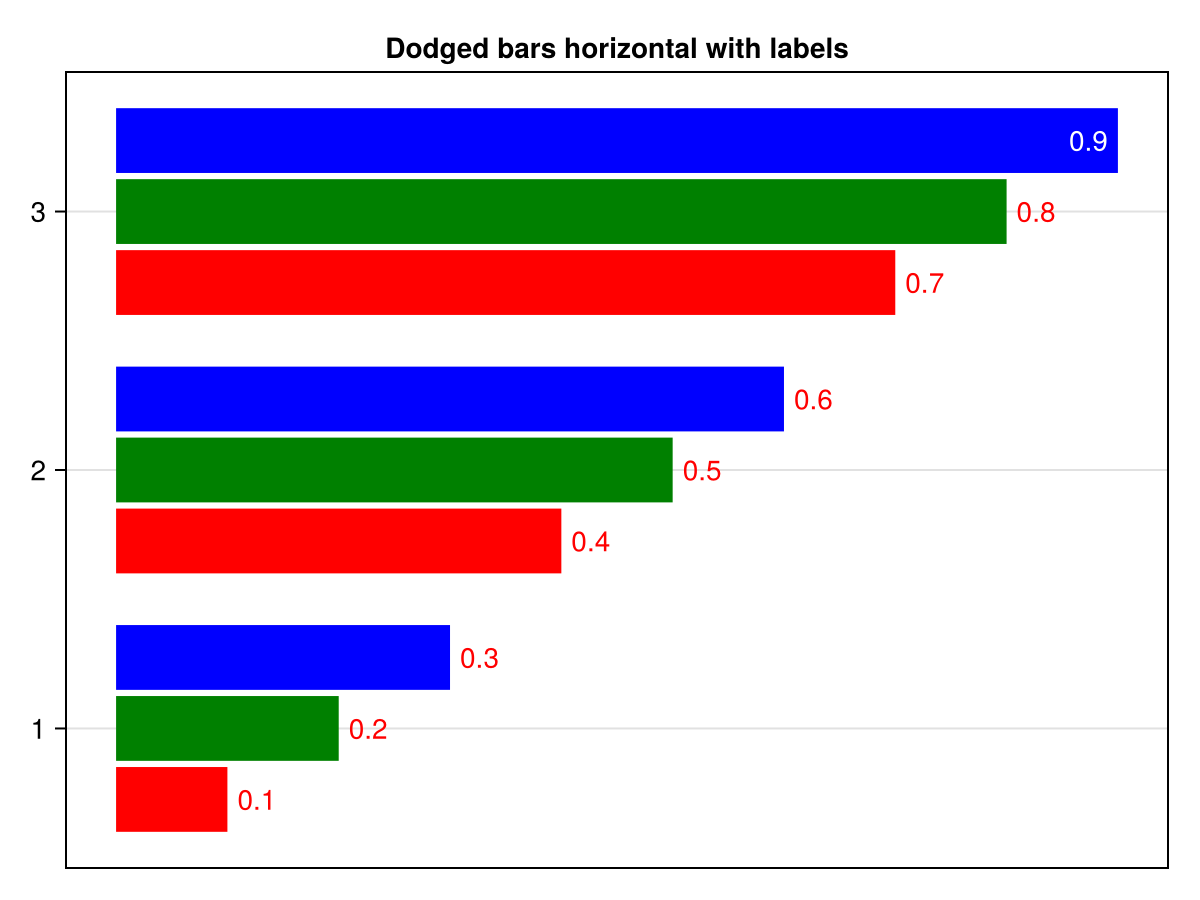
barplot(
    tbl.cat, tbl.height,
    dodge = tbl.grp,
    color = tbl.grp,
    bar_labels = :y,
    axis = (xticks = (1:3, ["left", "middle", "right"]),
            title = "Dodged bars horizontal with labels"),
    colormap = [:red, :green, :blue],
    color_over_background=:red,
    color_over_bar=:white,
    flip_labels_at=0.85,
    direction=:x,
)
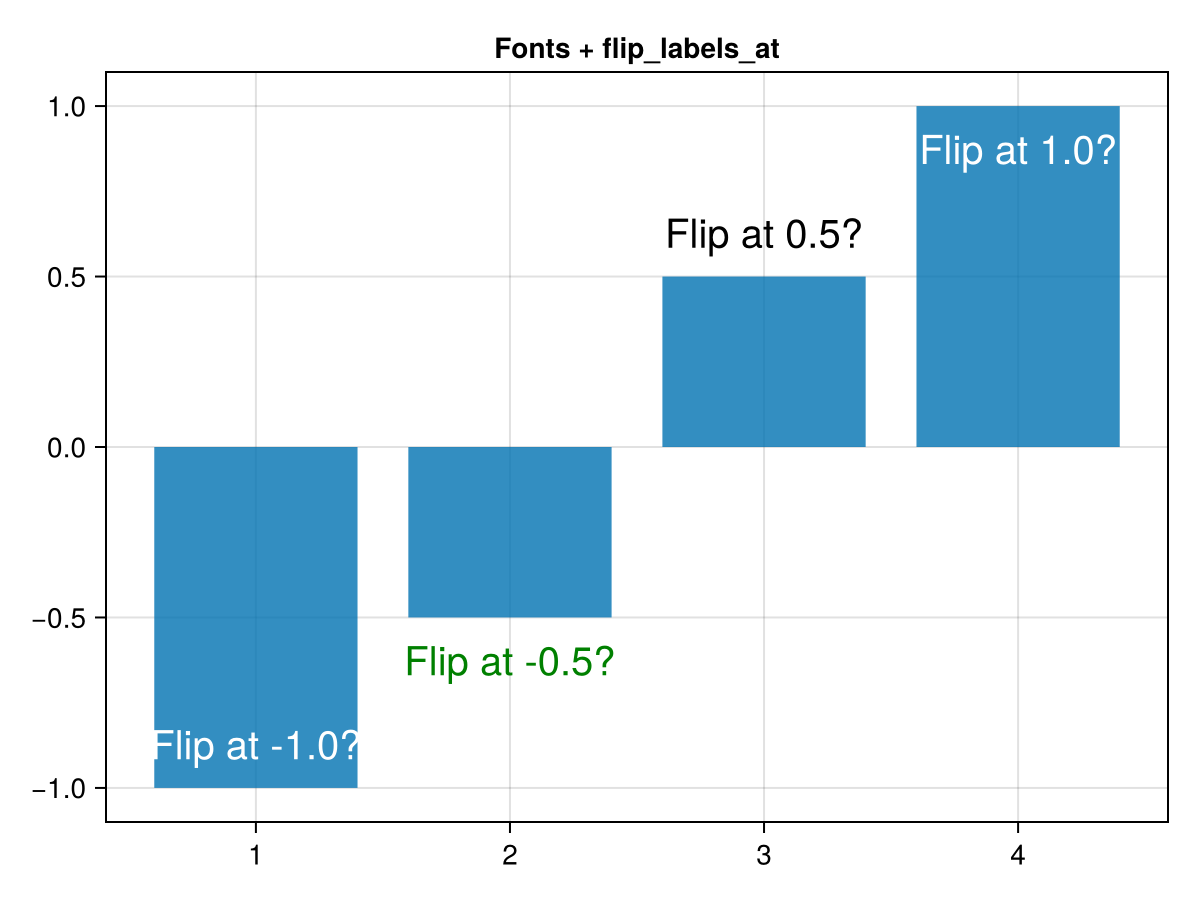
using CairoMakie
barplot([-1, -0.5, 0.5, 1],
    bar_labels = :y,
    axis = (title="Fonts + flip_labels_at",),
    label_size = 20,
    flip_labels_at=(-0.8, 0.8),
    label_color=[:white, :green, :black, :white],
    label_formatter = x-> "Flip at $(x)?",
    label_offset = 10
)
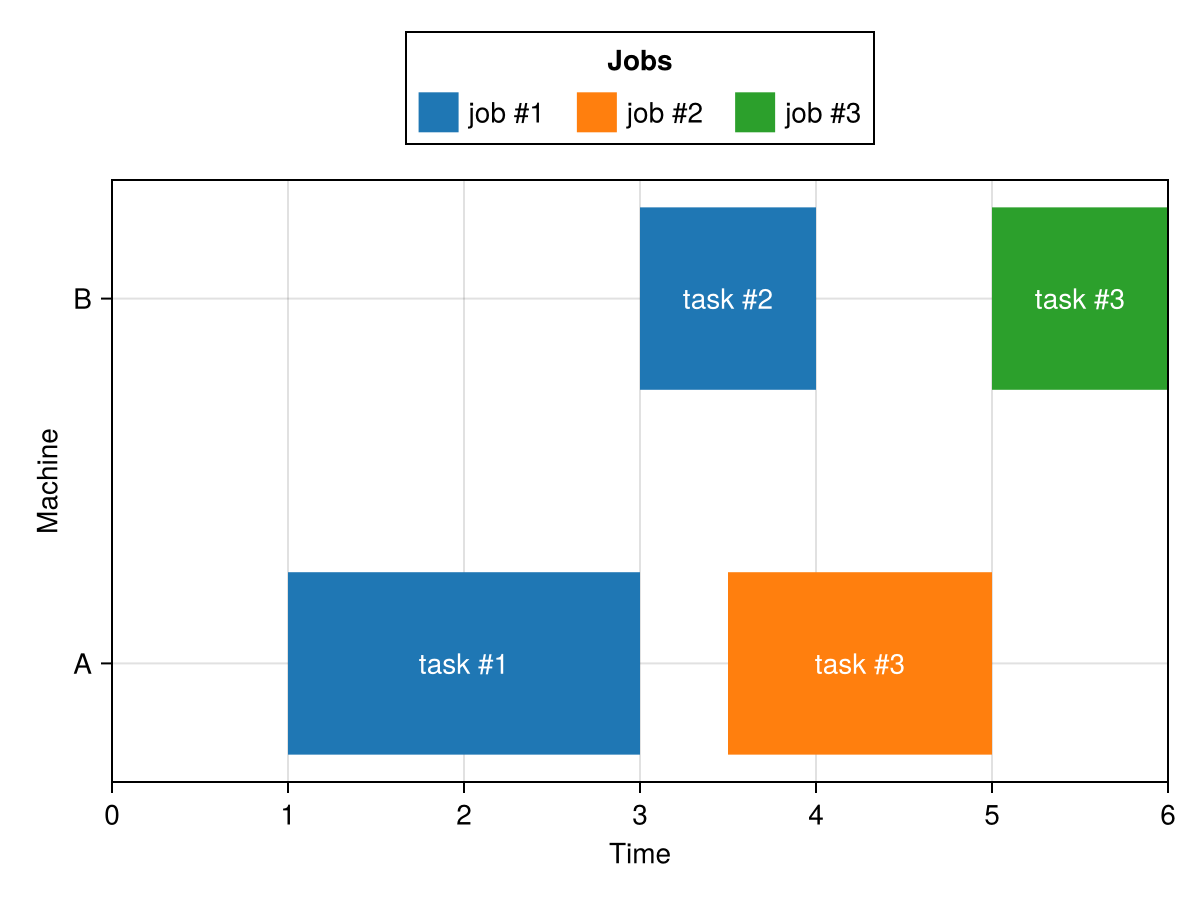
using CairoMakie
gantt = (
    machine = [1, 2, 1, 2],
    job = [1, 1, 2, 3],
    task = [1, 2, 3, 3],
    start = [1, 3, 3.5, 5],
    stop = [3, 4, 5, 6]
)

fig = Figure()
ax = Axis(
    fig[2,1],
    yticks = (1:2, ["A","B"]),
    ylabel = "Machine",
    xlabel = "Time"
)
xlims!(ax, 0, maximum(gantt.stop))

cmap = Makie.to_colormap(:tab10)

barplot!(
    gantt.machine,
    gantt.stop,
    fillto = gantt.start,
    direction = :x,
    color = gantt.job,
    colormap = cmap,
    colorrange = (1, length(cmap)),
    gap = 0.5,
    bar_labels = ["task #$i" for i in gantt.task],
    label_position = :center,
    label_color = :white,
    label = ["job #$i" => (; color = i) for i in unique(gantt.job)]
)

Legend(fig[1,1], ax, "Jobs", orientation=:horizontal, tellwidth = false, tellheight = true)

fig