hist
|
该页面正在翻译中。 |
例子:
using GLMakie
data = randn(1000)

f = Figure()
hist(f[1, 1], data, bins = 10)
hist(f[1, 2], data, bins = 20, color = :red, strokewidth = 1, strokecolor = :black)
hist(f[2, 1], data, bins = [-5, -2, -1, 0, 1, 2, 5], color = :gray)
hist(f[2, 2], data, normalization = :pdf)
f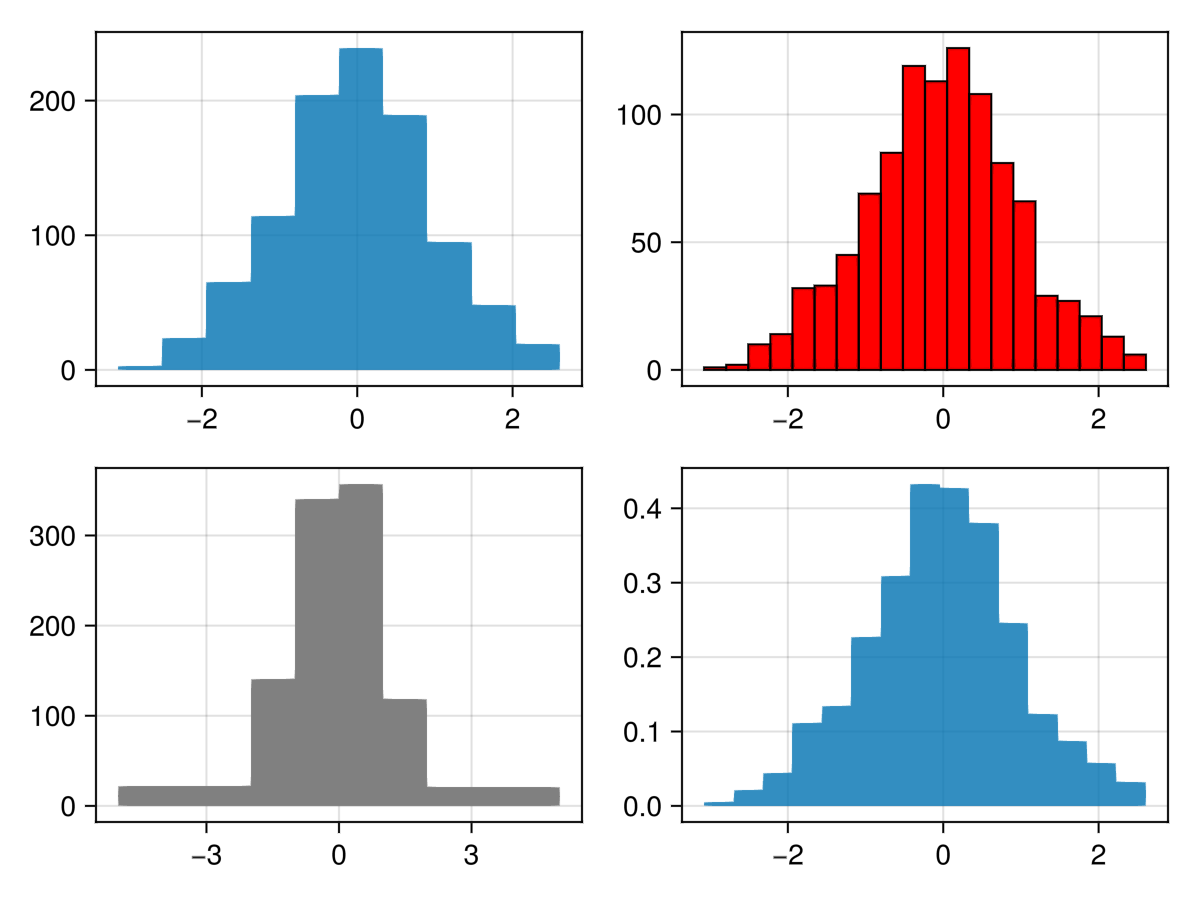
带标签的直方图
你可以使用所有相同的参数 [医条形图]:
</无翻译>
using CairoMakie
data = randn(1000)

hist(data, normalization = :pdf, bar_labels = :values,
     label_formatter=x-> round(x, digits=2), label_size = 15,
     strokewidth = 0.5, strokecolor = (:black, 0.5), color = :values)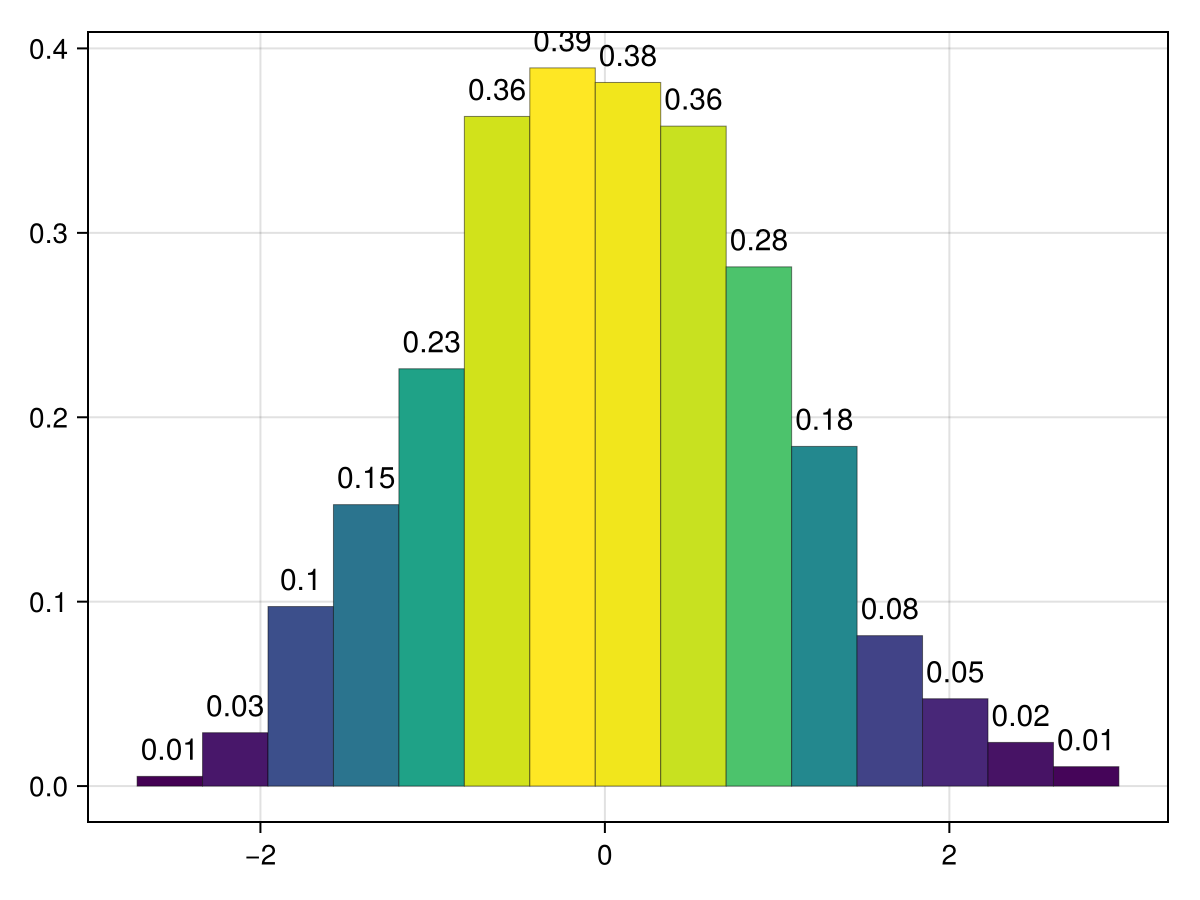
移动直方图
与 标量,标量,而 偏移量,可以将多个直方图放入同一个图中。 请注意,偏移量会自动设置fillto,以移动整个条形图。 此外,可以使用负 标量,标量 量翻转直方图,或 scale_to=:翻转 在不改变酒吧高度的情况下翻转酒吧的方向。
</无翻译>
using CairoMakie
fig = Figure()
ax = Axis(fig[1, 1])
for i in 1:5
     hist!(ax, randn(1000), scale_to=-0.6, offset=i, direction=:x)
end
fig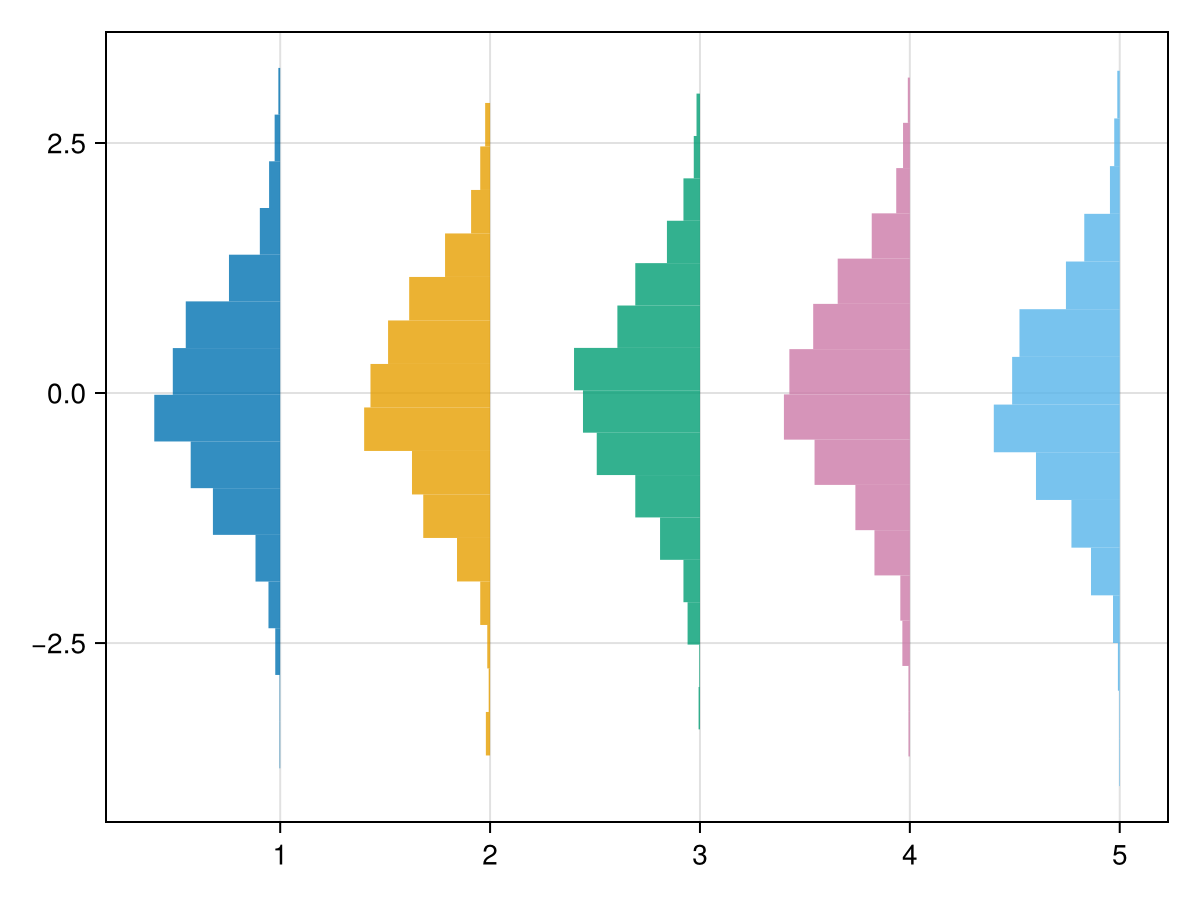
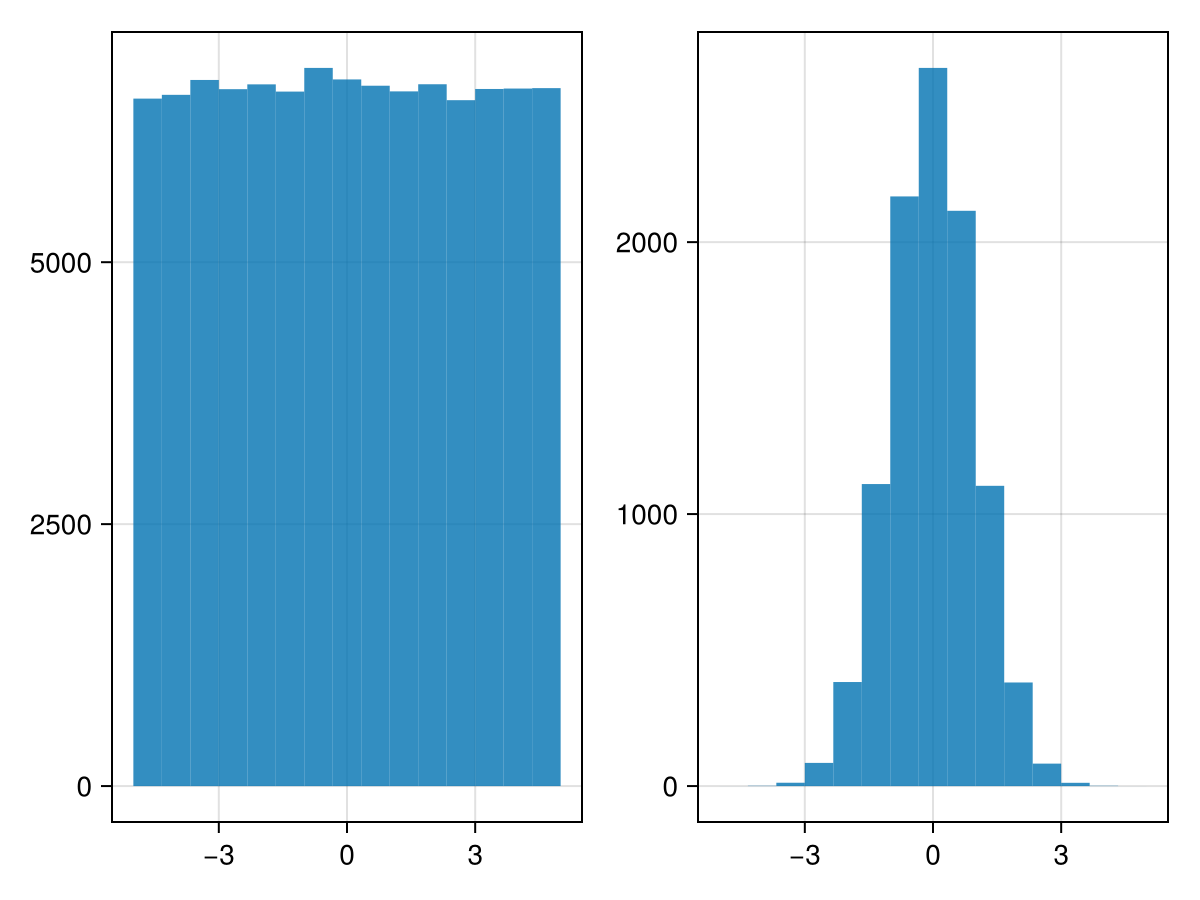
使用统计权重
using CairoMakie
using Distributions


N = 100_000
x = rand(Uniform(-5, 5), N)

w = pdf.(Normal(), x)

fig = Figure()
hist(fig[1,1], x)
hist(fig[1,2], x, weights = w)

fig