箱线图
|
该页面正在翻译中。 |
#
<无翻译>*麦琪箱线图*-Function
boxplot(x, y; kwargs...)绘制Tukey风格的箱线图。 箱线图有3个组件:
-
a
横杆,横杆跨越四分位间(IQR)范围,中线标记中位数 -
一个
错误,错误谁的胡须跨度范围*iqr -
标记异常值的点,即晶须之外的数据
论点
-
x:类别的位置 -
y:框内的变量
地块类型
绘图类型别名 箱线图 功能是 箱线图.
例子:
using CairoMakie
categories = rand(1:3, 1000)
values = randn(1000)

boxplot(categories, values)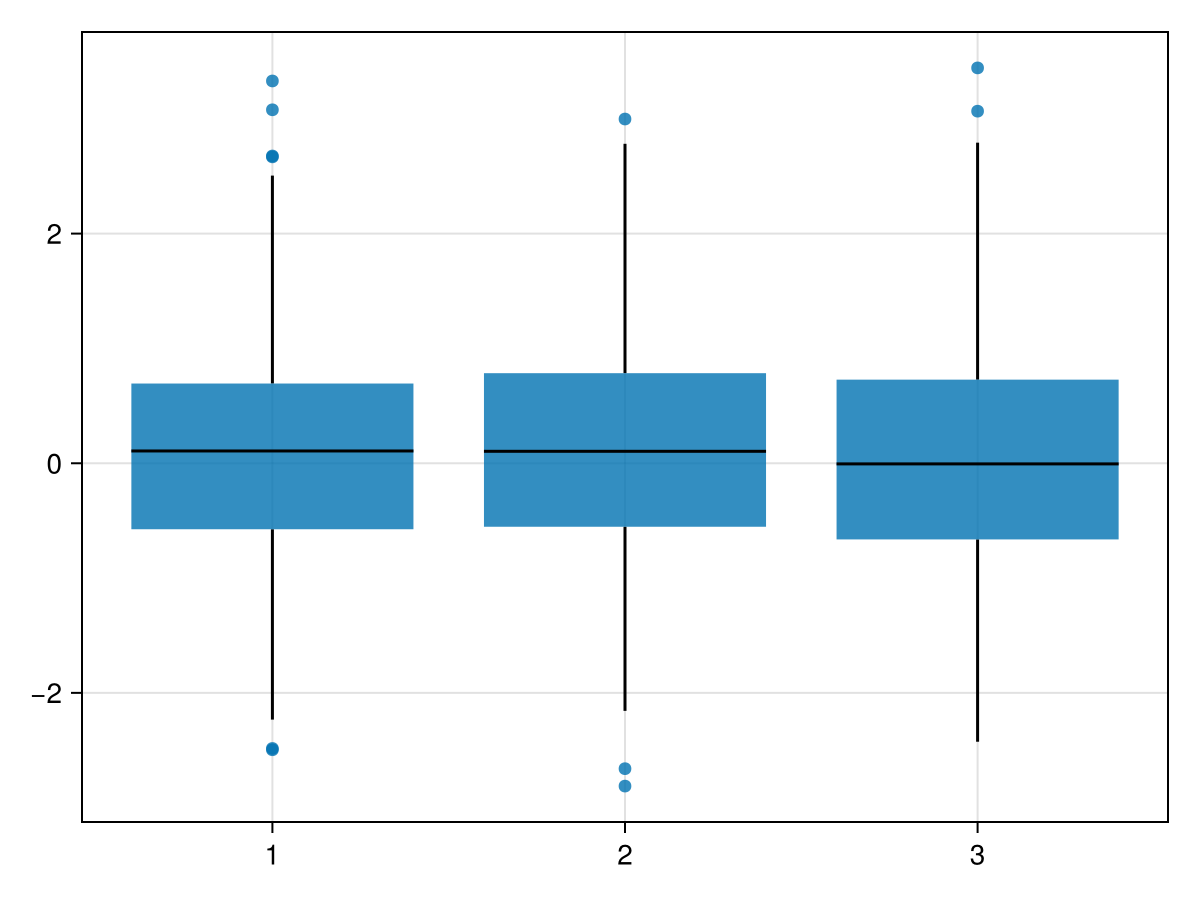
using CairoMakie
categories = rand(1:3, 1000)
values = randn(1000)
dodge = rand(1:2, 1000)

boxplot(categories, values, dodge = dodge, show_notch = true, color = dodge)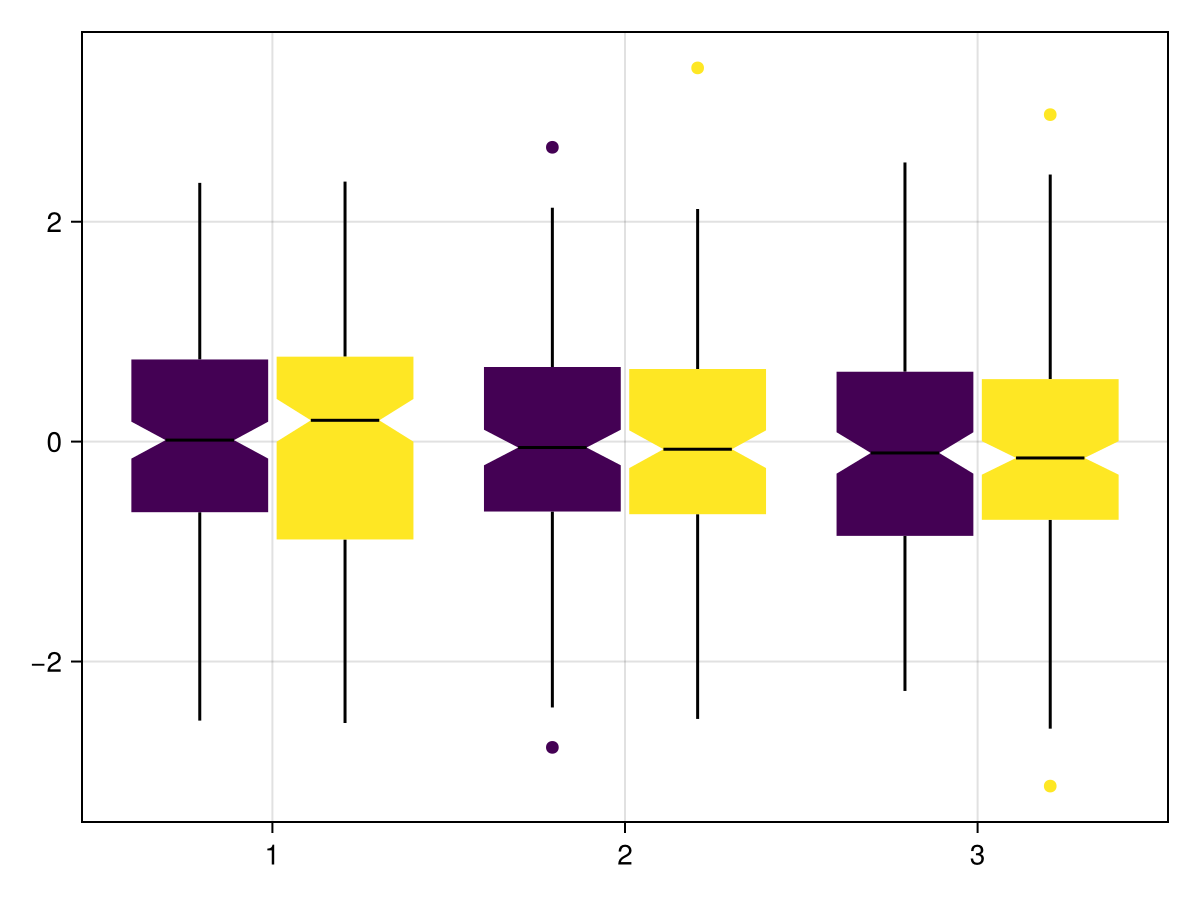
颜色是可定制的。 该 颜色 属性是指框的颜色,而 异常颜色 指异常值的颜色。 如果不是标量(例如 :红色),这些属性必须具有数据的长度。 如果 异常颜色 不提供,异常值将具有与它们的框相同的颜色,如上所示。
|
同一框内对应点的所有索引的注释, |
using CairoMakie
categories = rand(1:3, 1000)
values = randn(1000)
dodge = rand(1:2, 1000)

boxplot(categories, values, dodge = dodge, show_notch = true, color = map(d->d==1 ? :blue : :red, dodge) , outliercolor = rand([:red, :green, :blue, :black, :yellow], 1000))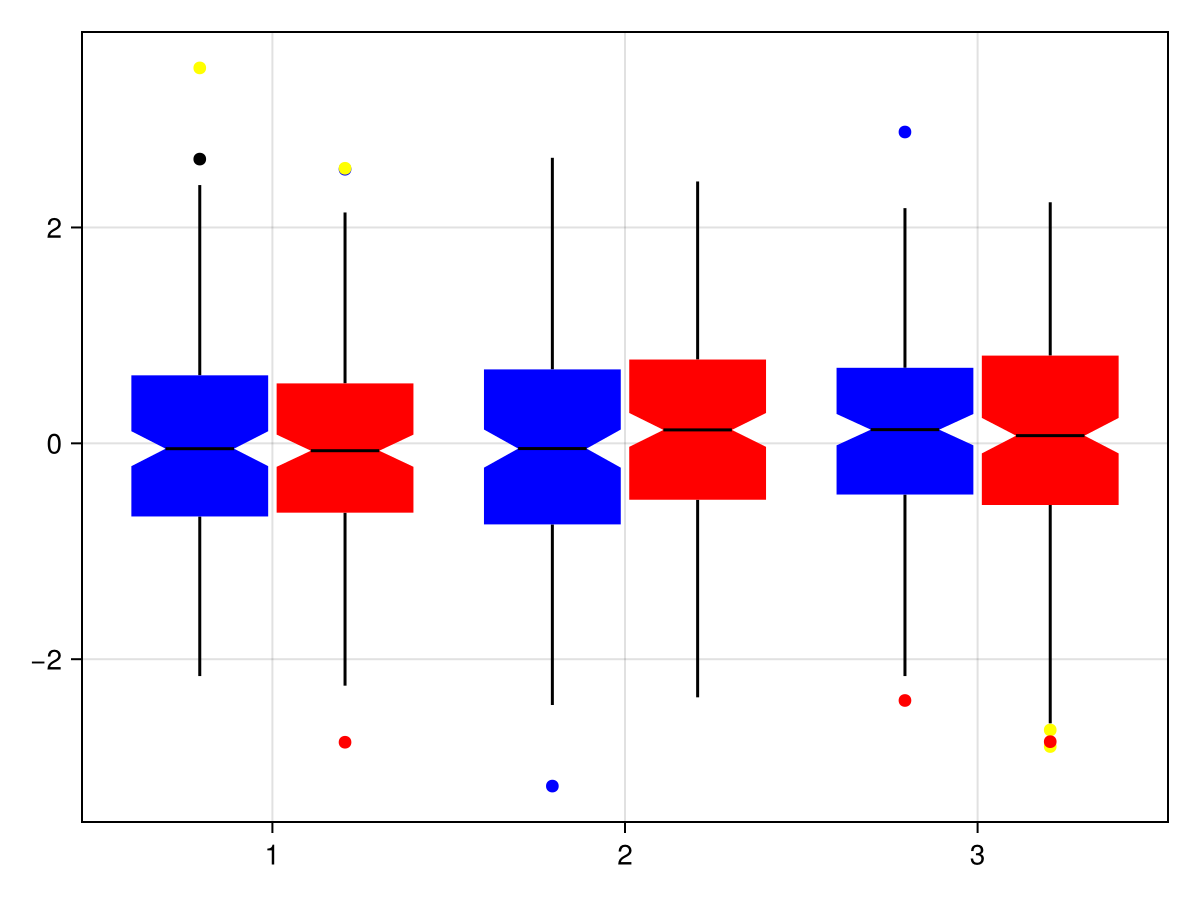
使用统计权重
using CairoMakie
using Distributions

N = 100_000
x = rand(1:3, N)
y = rand(Uniform(-1, 5), N)

w = pdf.(Normal(), x .- y)

图=图()

箱线图(图[1,1],x,y)
箱线图(图[1,2],x,y,权重=w)

无花果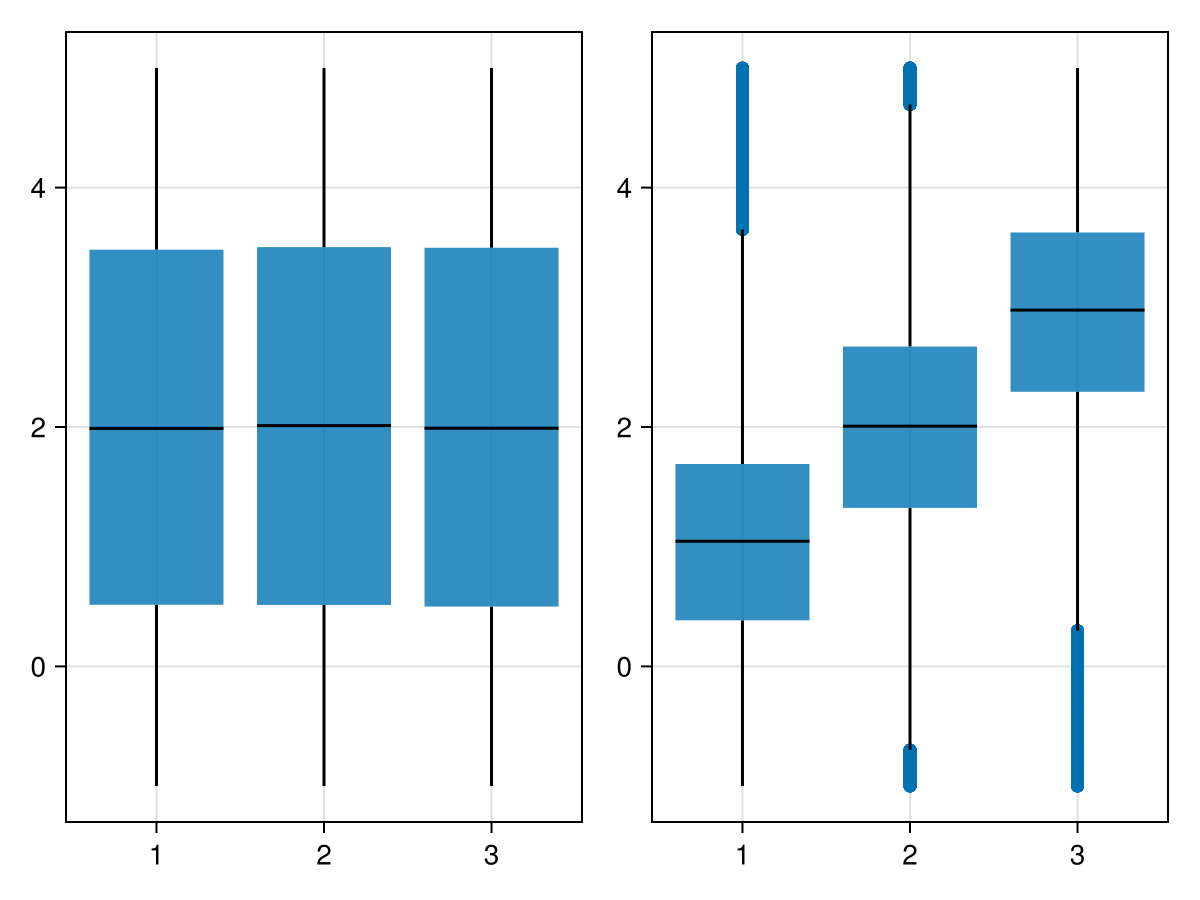
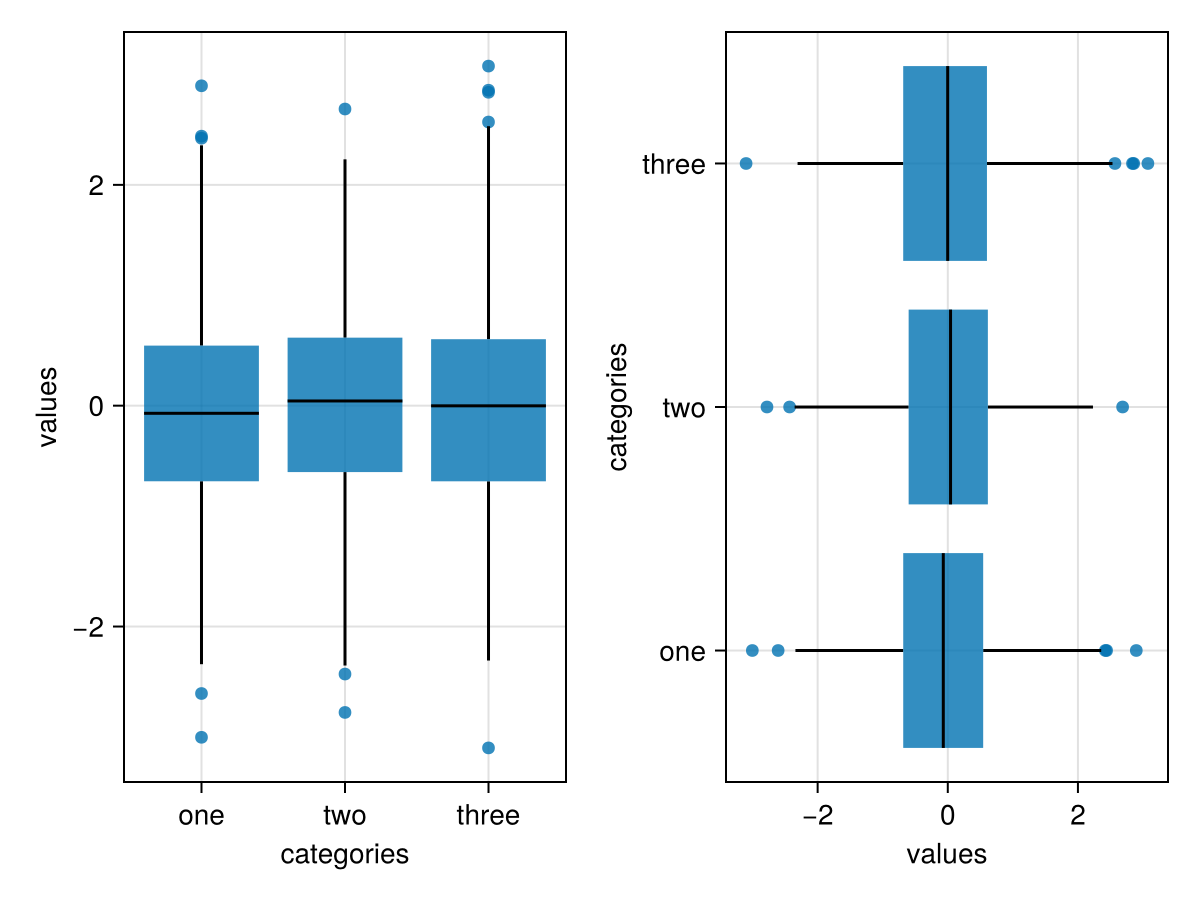
水平轴
using CairoMakie
fig = Figure()

categories = rand(1:3, 1000)
values = randn(1000)

ax_vert = Axis(fig[1,1];
    xlabel = "categories",
    ylabel = "values",
    xticks = (1:3, ["one", "two", "three"])
)
ax_horiz = Axis(fig[1,2];
    xlabel="values", # note that x/y still correspond to horizontal/vertical axes respectively
    ylabel="categories",
    yticks=(1:3, ["one", "two", "three"])
)

# Note: same order of category/value, despite different axes
boxplot!(ax_vert, categories, values) # `orientation=:vertical` is default
boxplot!(ax_horiz, categories, values; orientation=:horizontal)

fig