等高线
|
该页面正在翻译中。 |
#
<无翻译>*麦琪等高线*-Function
contour(x, y, z)
contour(z::Matrix)
创建跨越平面的等值线图 x::向量, y::向量, z::矩阵. 如果只 z::矩阵 提供了元素的索引 z 将作为 x 和 y 绘制轮廓时的位置。
绘图类型
绘图类型别名 等高线 功能是 等高线.
例子:
using CairoMakie
f = Figure()
Axis(f[1, 1])

xs = LinRange(0, 10, 100)
ys = LinRange(0, 15, 100)
zs = [cos(x) * sin(y) for x in xs, y in ys]

contour!(xs, ys, zs)

f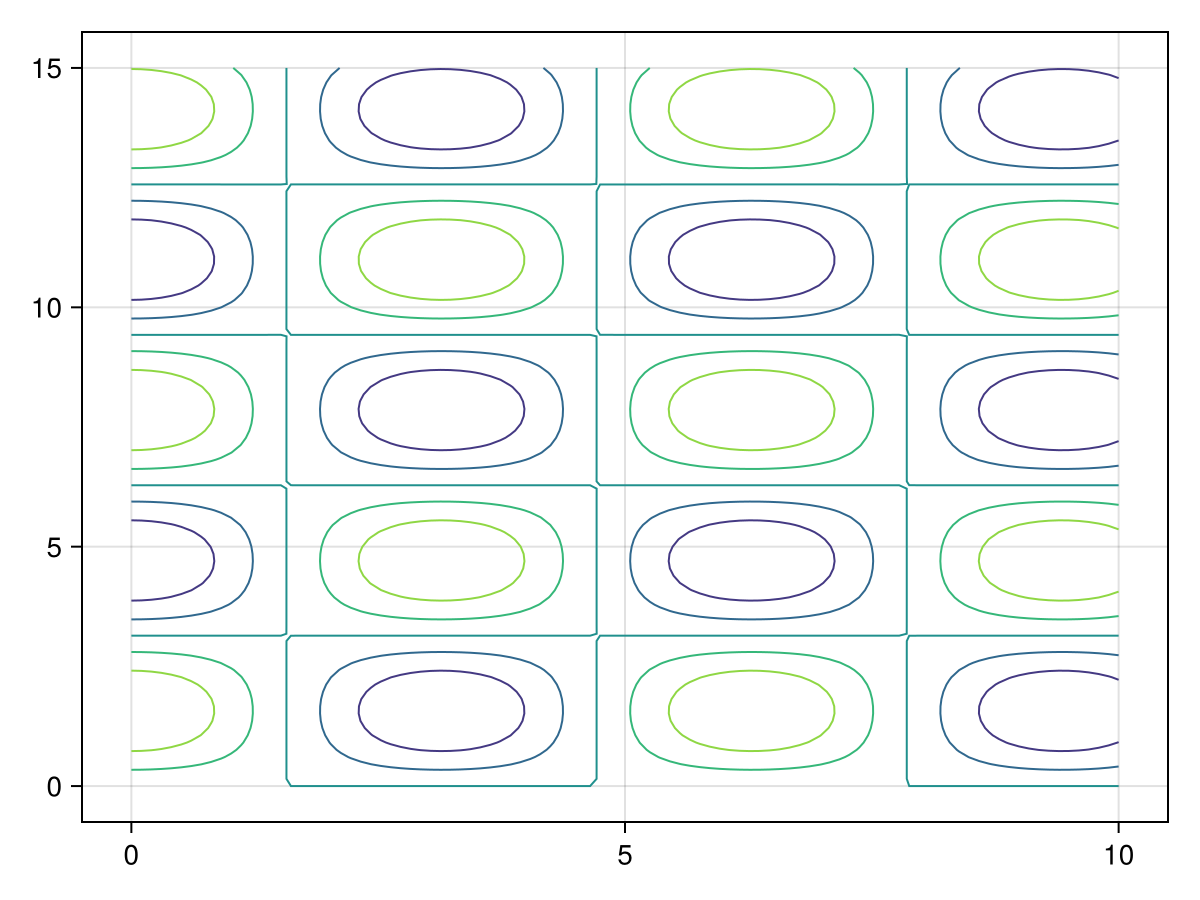
using CairoMakie
f = Figure()
Axis(f[1, 1])

xs = LinRange(0, 10, 100)
ys = LinRange(0, 15, 100)
zs = [cos(x) * sin(y) for x in xs, y in ys]

contour!(zs,levels=-1:0.1:1)

f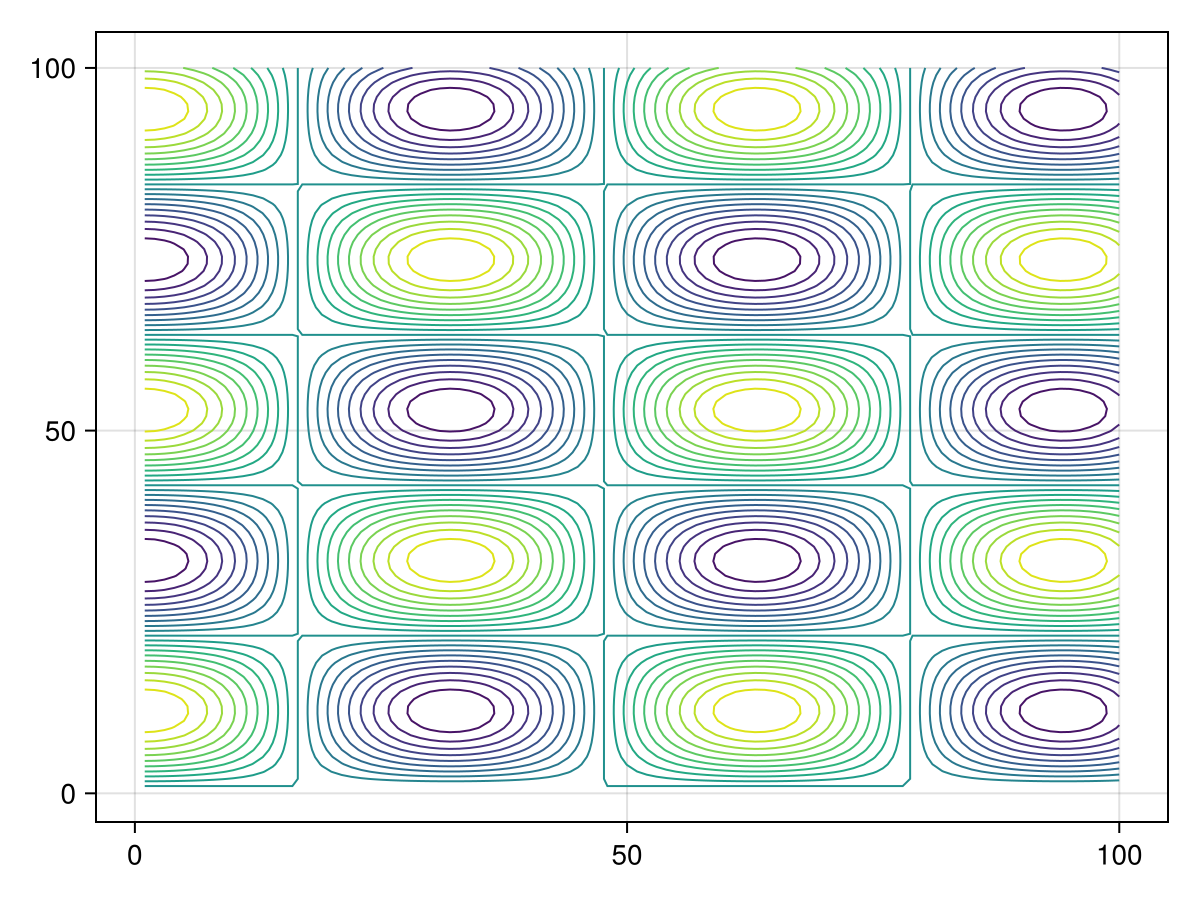
using CairoMakie
himmelblau(x, y) = (x^2 + y - 11)^2 + (x + y^2 - 7)^2
x = y = range(-6, 6; length=100)
z = himmelblau.(x, y')

levels = 10.0.^range(0.3, 3.5; length=10)
colorscale = ReversibleScale(x -> x^(1 / 10), x -> x^10)
f, ax, ct = contour(x, y, z; labels=true, levels, colormap=:hsv, colorscale)
f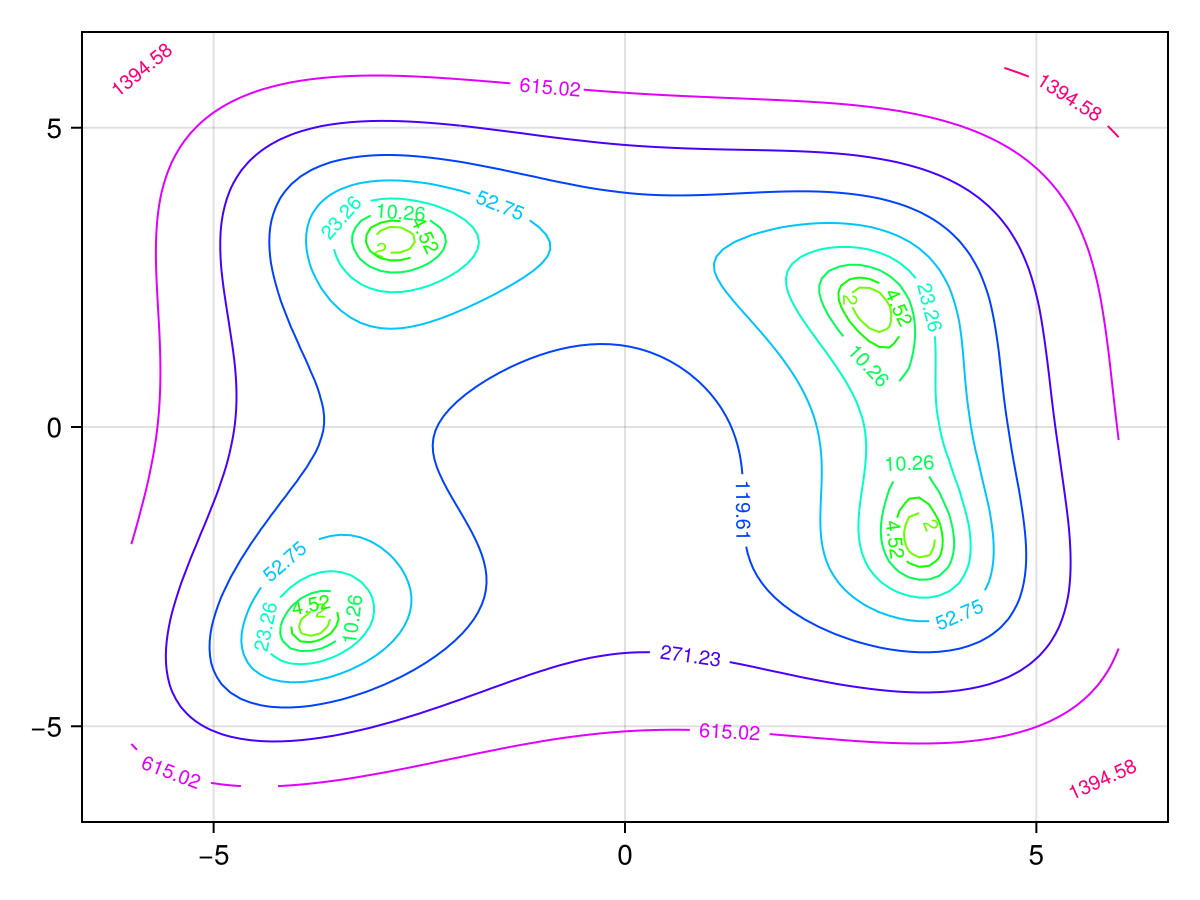
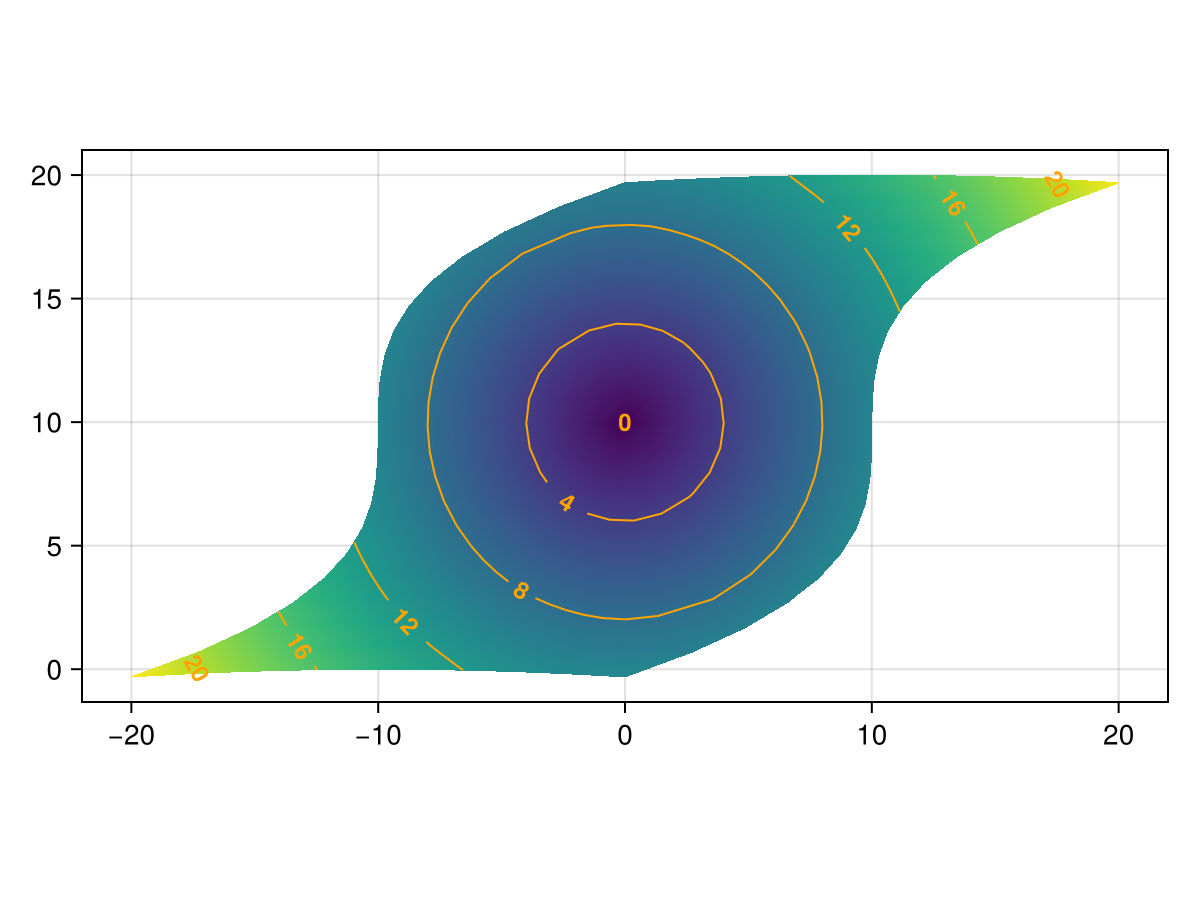
曲线网格
等高线 还支持_curvilinear_网格,其中 x 和 y 两个矩阵的大小都与 z. 这类似于输入 表面接受。
using CairoMakie
x = -10:10
y = -10:10
# The curvilinear grid:
xs = [x + 0.01y^3 for x in x, y in y]
ys = [y + 10cos(x/40) for x in x, y in y]

# Now, for simplicity, we calculate the `zs` values to be
# the radius from the center of the grid (0, 10).
zs = sqrt.(xs .^ 2 .+ (ys .- 10) .^ 2)

# We can use Makie's tick finders to get some nice looking contour levels:
levels = Makie.get_tickvalues(Makie.LinearTicks(7), extrema(zs)...)

 现在,我们策划!
fig,ax,srf=surface(xs,ys,fill(0f0,size(zs));color=zs,shading=NoShading,axis=(;type=Axis,aspect=DataAspect()))
ctr=轮廓!(ax,xs,ys,zs;color=:orange,levels=levels,labels=true,labelfont=:bold,labelsize=12)

无花果