热图
|
该页面正在翻译中。 |
#
<无翻译>*马基科。热图*-Function
heatmap(x, y, matrix)
heatmap(x, y, func)
heatmap(matrix)
heatmap(xvector, yvector, zvector)
将热图绘制为矩形的集合。 x 和 y 可以是长度 i 和 j 哪里 (i,j) 是 尺寸(矩阵),在这种情况下,矩形将像voronoi单元格一样放置在这些网格点周围。 请注意,对于不规则间隔 x 和 y,它们指定的点不在生成的矩形内居中。
x 和 y 也可以是长度 我+1 和 j+1,在这种情况下,它们被解释为矩形的边缘。
矩形的颜色是从 矩阵[i,j]. 第三个参数也可以是一个 功能 (i,j)->v然后在跨越的网格上进行评估 x 和 y.
另一种允许的形式是使用三个向量 xvector,xvector, 伊维克托 和 zvector,zvector. 在这种情况下,假设没有一对元素 x 和 y 存在两次。 从生成的网格中缺少的对将被视为 zvector,zvector 有一个 南 元件在该位置处。
如果 x 和 y 用矩阵参数省略,它们默认为 x,y=轴(矩阵).
请注意 热图 渲染速度比 图像 所以 图像 应优选大的、规则间隔的网格。
绘图类型
绘图类型别名 热图 功能是 热图.
例子:
两个向量和一个矩阵
using CairoMakie
f = Figure()
ax = Axis(f[1, 1])

centers_x = 1:5
centers_y = 6:10
data = reshape(1:25, 5, 5)

heatmap!(ax, centers_x, centers_y, data)

scatter!(ax, [(x, y) for x in centers_x for y in centers_y], color=:white, strokecolor=:black, strokewidth=1)

f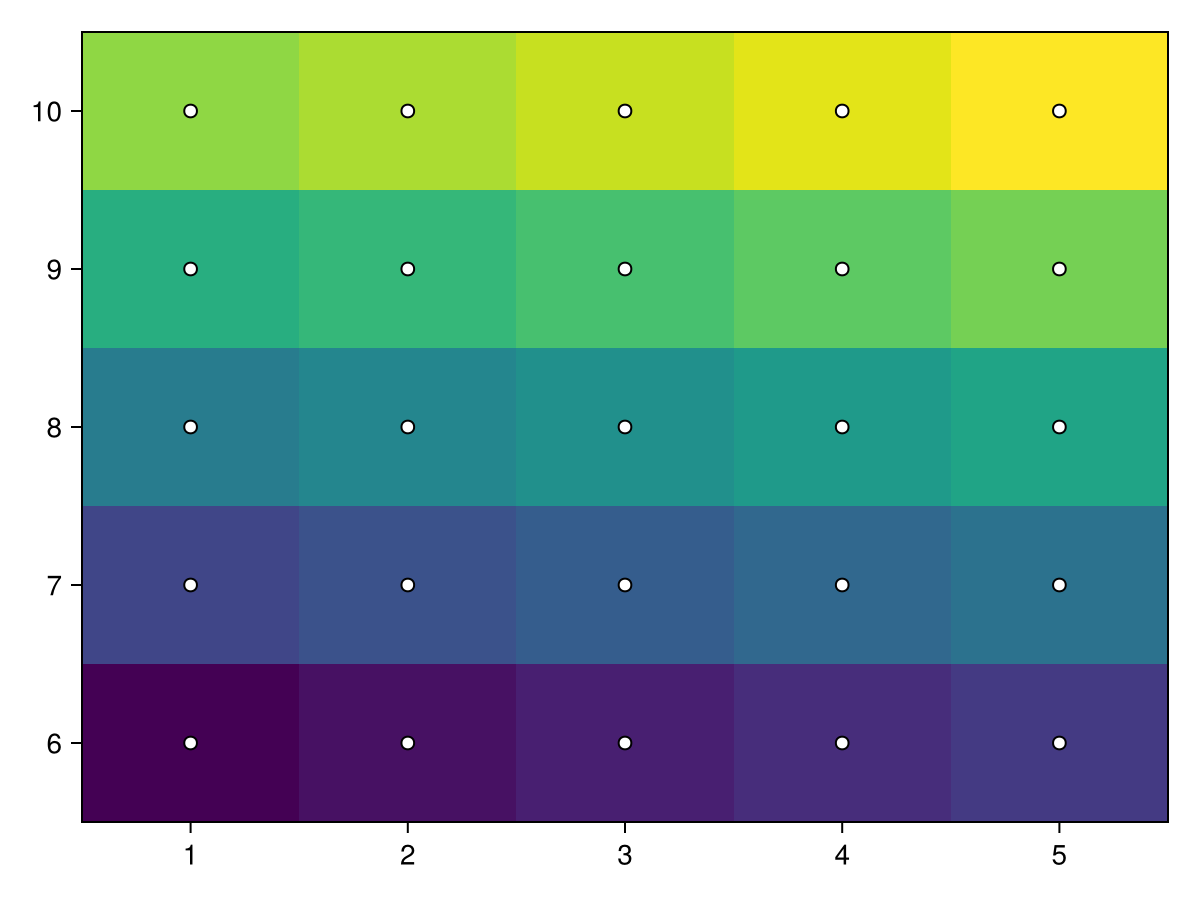
using CairoMakie
f = Figure()
ax = Axis(f[1, 1])

centers_x = [1, 2, 4, 7, 11]
centers_y = [6, 7, 9, 12, 16]
data = reshape(1:25, 5, 5)

heatmap!(ax, centers_x, centers_y, data)

scatter!(ax, [(x, y) for x in centers_x for y in centers_y], color=:white, strokecolor=:black, strokewidth=1)
f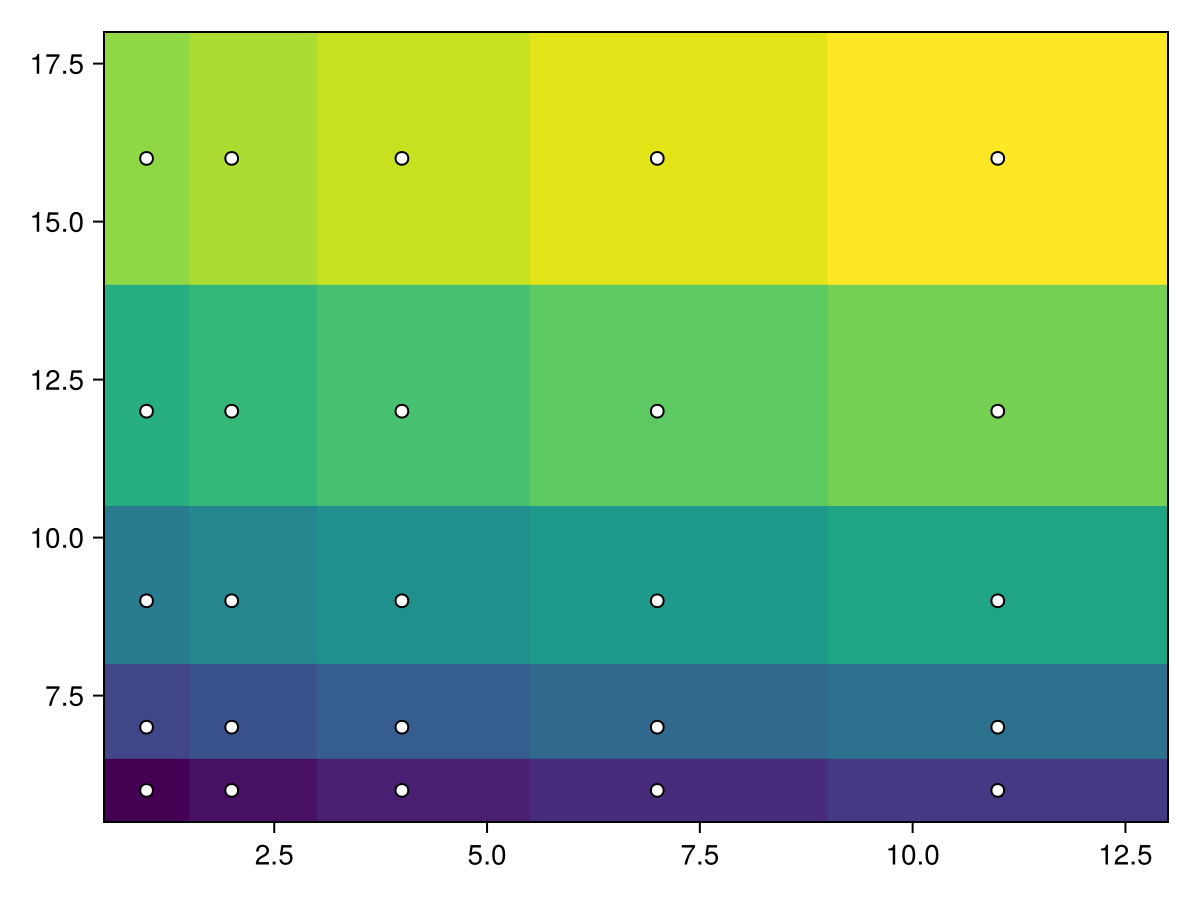
using CairoMakie
f = Figure()
ax = Axis(f[1, 1])

edges_x = 1:6
edges_y = 7:12
data = reshape(1:25, 5, 5)

热图!(ax,edges_x,edges_y,data)

散开!(ax,[(x,y)for x in edges_x for y in edges_y],color=:white,strokecolor=:black,strokewidth=1)
f
using CairoMakie
f = Figure()
ax = Axis(f[1, 1])

borders_x = [1, 2, 4, 7, 11, 16]
borders_y = [6, 7, 9, 12, 16, 21]
data = reshape(1:25, 5, 5)

heatmap!(ax, borders_x, borders_y, data)
scatter!(ax, [(x, y) for x in borders_x for y in borders_y], color=:white, strokecolor=:black, strokewidth=1)
f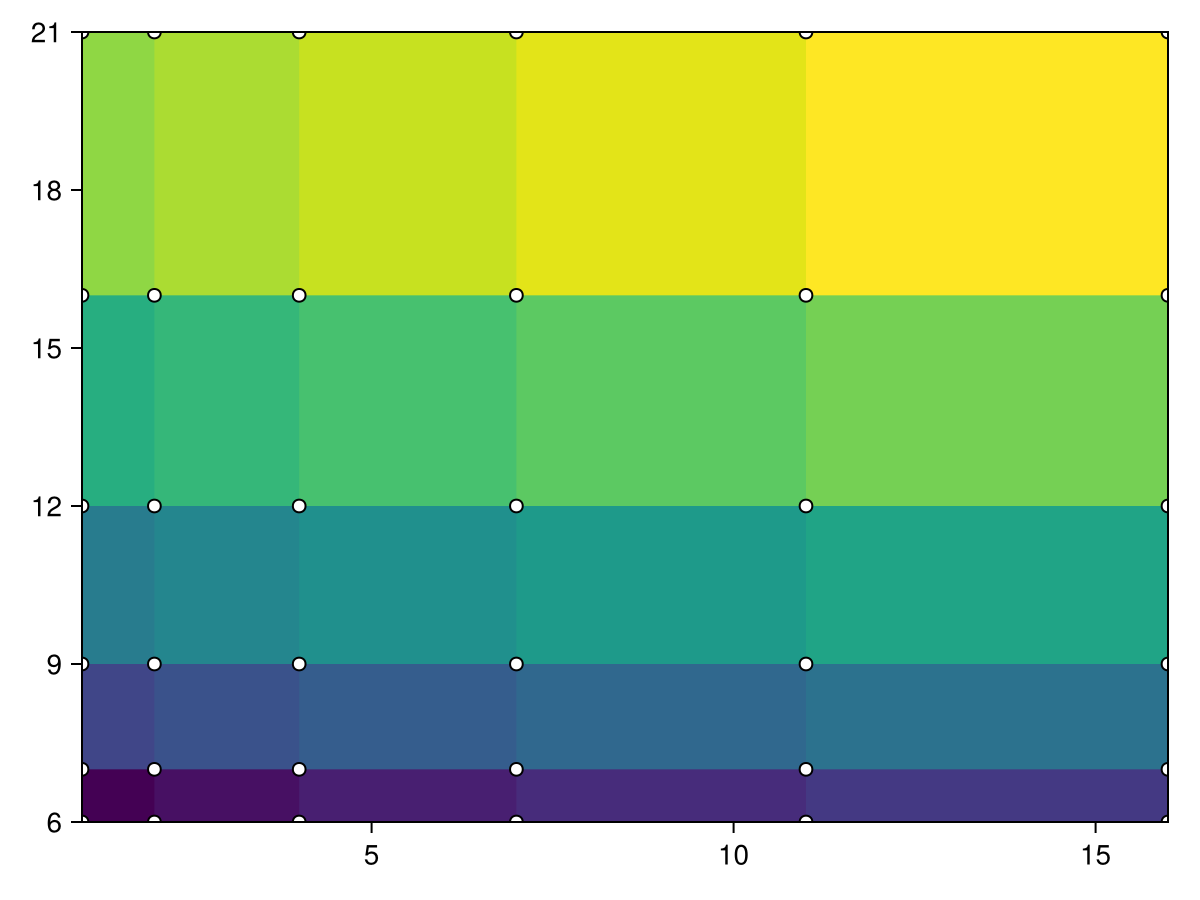
使用 功能 而不是一个 矩阵
using CairoMakie
function mandelbrot(x, y)
    z = c = x + y*im
    for i in 1:30.0; abs(z) > 2 && return i; z = z^2 + c; end; 0
end

heatmap(-2:0.001:1, -1.1:0.001:1.1, mandelbrot,
    colormap = Reverse(:deep))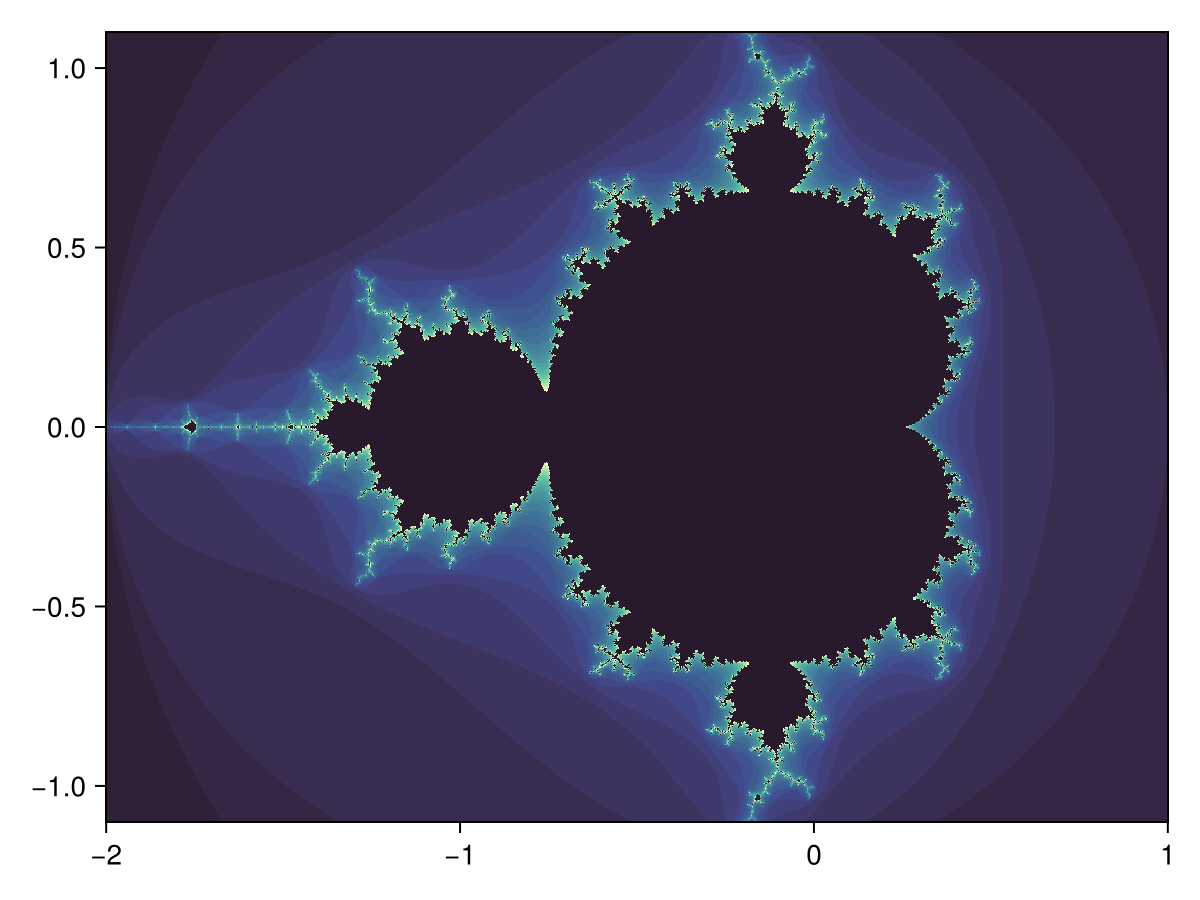
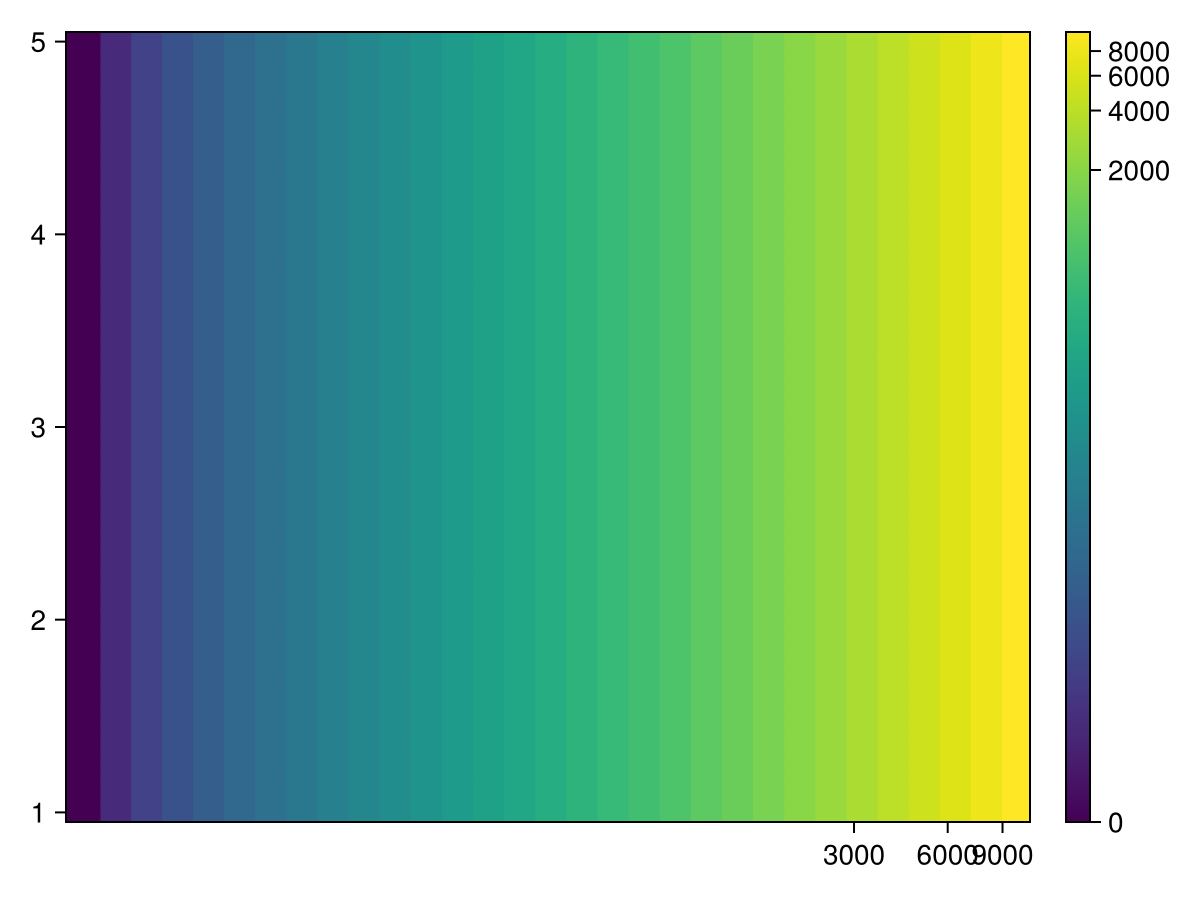
三个向量
using CairoMakie
xs = [1, 2, 3, 1, 2, 3, 1, 2, 3]
ys = [1, 1, 1, 2, 2, 2, 3, 3, 3]
zs = [1, 2, 3, 4, 5, 6, 7, 8, NaN]

heatmap(xs, ys, zs)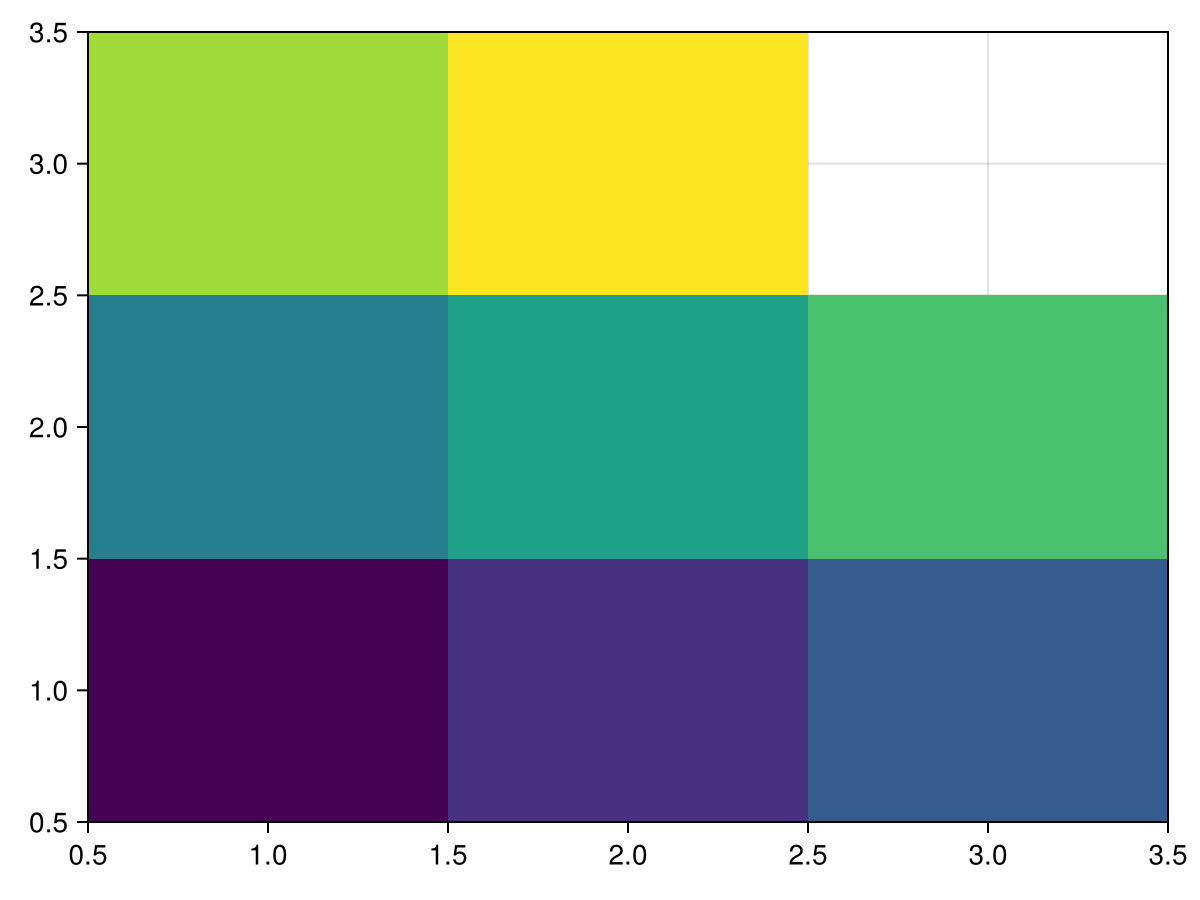
单张热图的彩色条
using CairoMakie
xs = range(0, 2π, length=100)
ys = range(0, 2π, length=100)
zs = [sin(x*y) for x in xs, y in ys]

fig, ax, hm = heatmap(xs, ys, zs)
Colorbar(fig[:, end+1], hm)

fig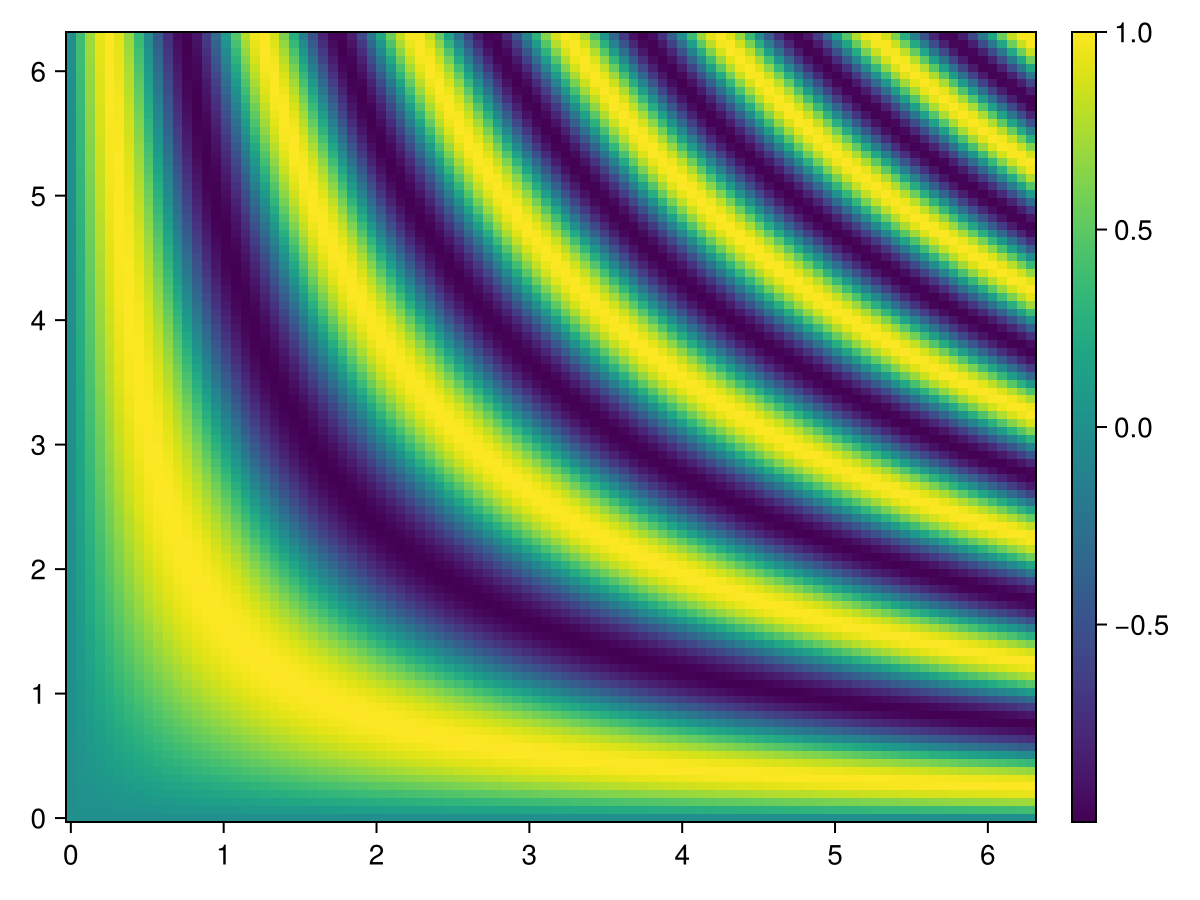
用于多个热图的Colorbar
当单个图形中有多个热图时,使用单个colorbar表示所有热图可能会很有用。 重要的是,然后有同步的比例和颜色映射的热图和颜色栏。 这是通过显式设置colorrange来完成的,以便它独立于该特定热图显示的数据。
由于下面示例中的热图具有相同的colorrange和colormap,因此它们中的任何一个都可以传递给 颜色栏 为colorbar赋予相同的属性。 或者,可以显式设置colorbar属性。
</无翻译>
using CairoMakie
xs = range(0, 2π, length=100)
ys = range(0, 2π, length=100)
zs1 = [sin(x*y) for x in xs, y in ys]
zs2 = [2sin(x*y) for x in xs, y in ys]

joint_limits = (-2, 2)  # here we pick the limits manually for simplicity instead of computing them

fig, ax1, hm1 = heatmap(xs, ys, zs1,  colorrange = joint_limits)
ax2, hm2 = heatmap(fig[1, end+1], xs, ys, zs2, colorrange = joint_limits)

Colorbar(fig[:, end+1], hm1)                     # These three
Colorbar(fig[:, end+1], hm2)                     # colorbars are
Colorbar(fig[:, end+1], colorrange = joint_limits)  # equivalent

fig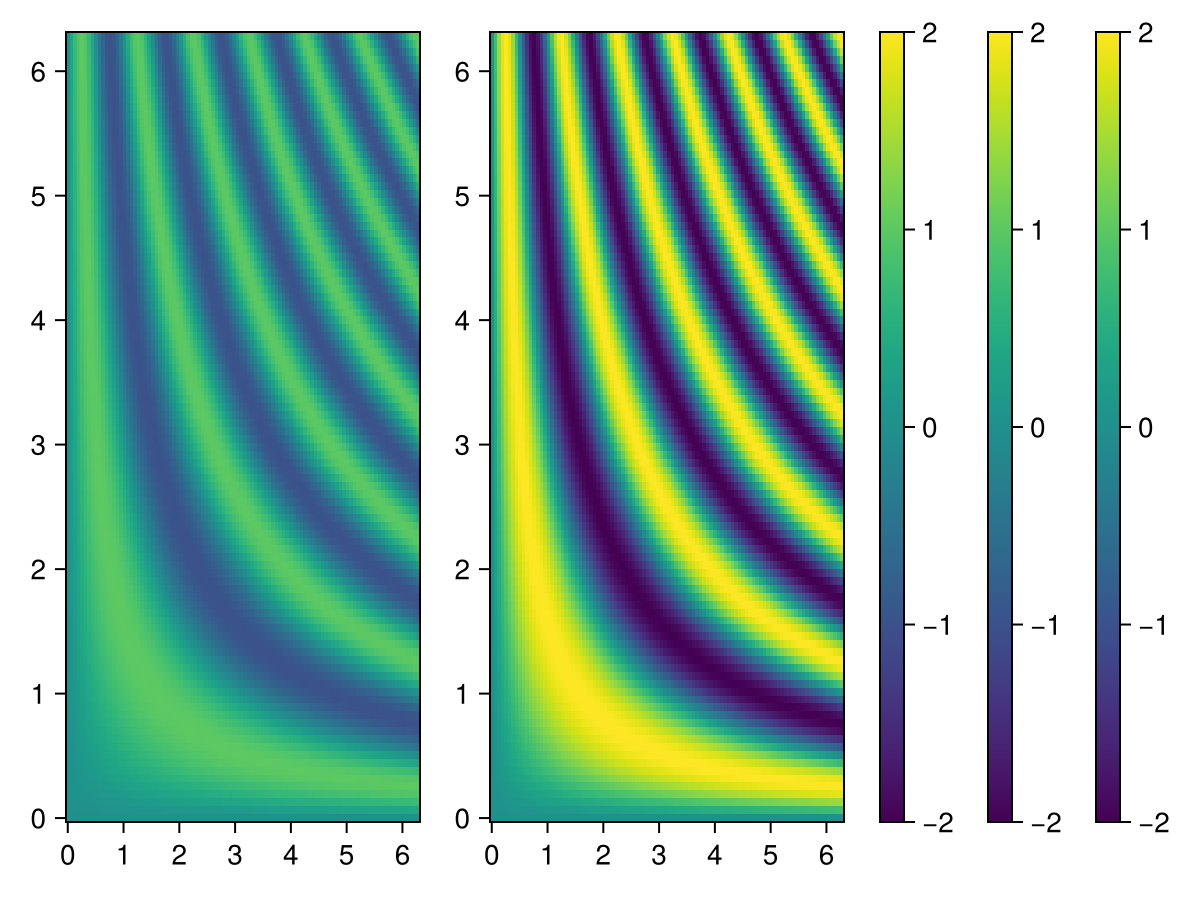
绘制大型热图
您可以将数据包装到 麦琪再取样器,只为观察区域自动重新采样大热图。 放大时,它会更新重新采样的版本,以最好的保真度显示它。 当任何鼠标或键盘按钮被按下时,它会阻止更新,而不是垃圾邮件,例如WGLMakie与数据更新。 这很适合 轴(图;zoombutton=键盘.left_control). 您可以使用以下方法禁用此行为:
重采样器(数据;update_while_button_pressed=true).
例子::
using Downloads, FileIO, GLMakie
# 30000×22943 image
path = Downloads.download("https://upload.wikimedia.org/wikipedia/commons/7/7e/In_the_Conservatory.jpg")
img = rotr90(load(path))
f, ax, pl = heatmap(Resampler(img); axis=(; aspect=DataAspect()), figure=(;size=size(img)./20))
hidedecorations!(ax)
f为了获得更好的下采样质量,我们建议使用 麦琪金字塔 (可能会移动到另一个包),它创建了一个简单的高斯金字塔,用于高效和无伪影的向下采样:
pyramid = Makie.Pyramid(img)
fsize = (size(img) ./ 30) .* (1, 2)
fig, ax, pl = heatmap(Resampler(pyramid);
    axis=(; aspect=DataAspect(), title="Pyramid"), figure=(; size=fsize))
hidedecorations!(ax)
ax, pl = heatmap(fig[2, 1], Resampler(img1);
    axis=(; aspect=DataAspect(), title="No Pyramid"))
hidedecorations!(ax)
save("heatmap-pyramid.png", fig)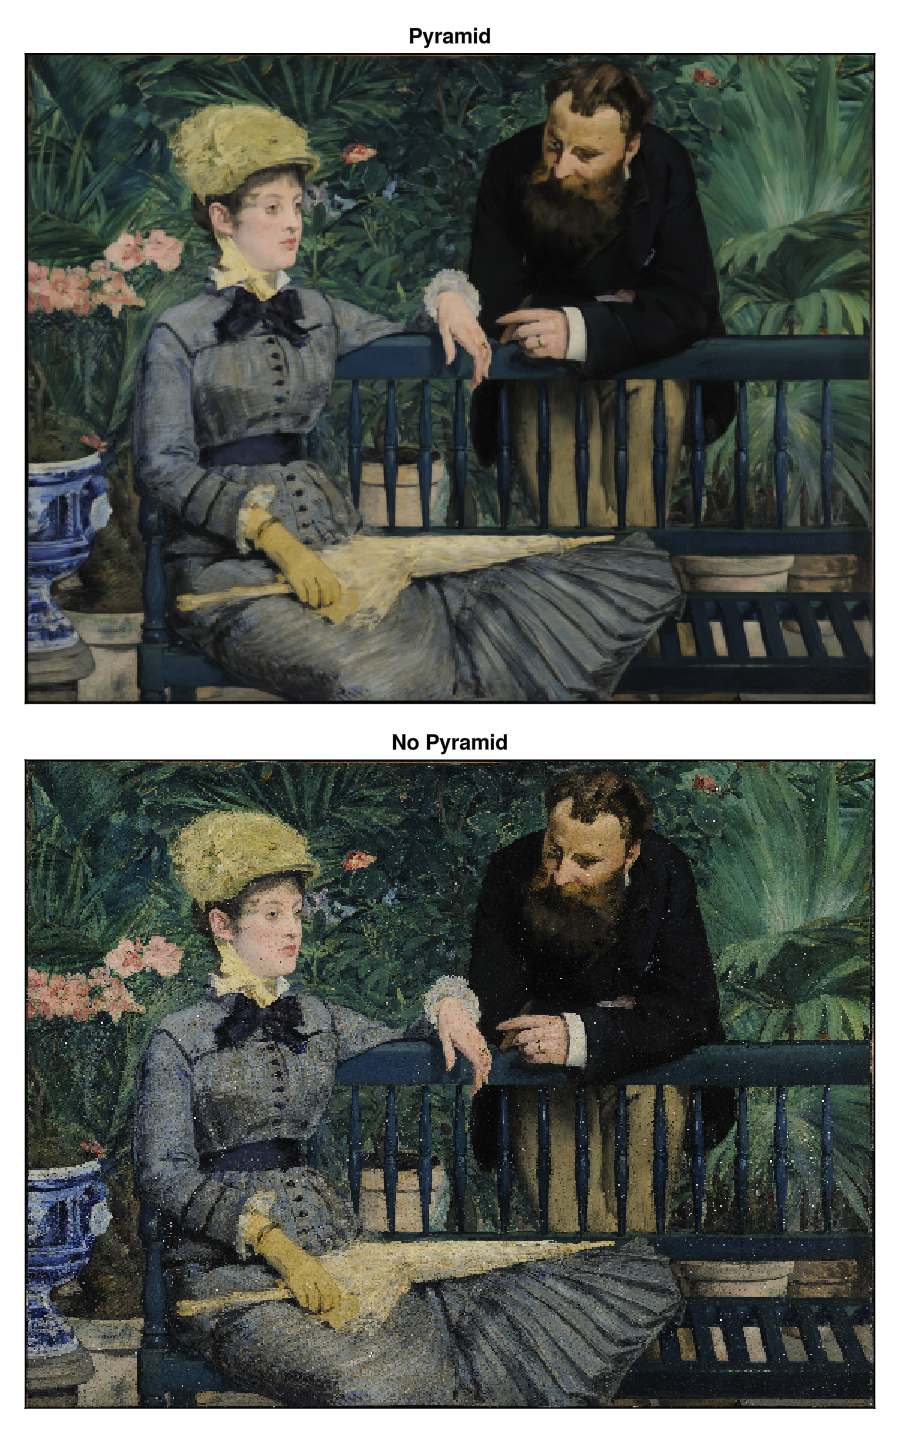
任何其他数组类型都允许在 再取样器,并且它也可能通过重载来实现它自己的插值策略:
function (array::ArrayType)(xrange::LinRange, yrange::LinRange)
    ...
end